0475
Dynamic assessment of early metabolic perturbations in glioma-bearing mice using denoised 2H-MRS1Champalimaud Research, Champalimaud Centre for the Unknown, Lisbon, Portugal, 2Neos Biotec, Pamplona, Spain, 3Center of Functionally Integrative Neuroscience (CFIN) and MINDLab, Department of Clinical Medicine, Aarhus University, Aarhus, Denmark
Synopsis
As our understanding of cancer metabolism advances, novel methods are needed to dynamically assess its heterogeneity in preclinical models, with high temporal resolution. Here we show the feasibility of dynamic 2H-MRS in glioma-bearing mice to monitor glucose metabolism with <3s resolution. This was achieved with a new 2H/1H RF coil design for the mouse brain and a novel application of Marchenko–Pastur denoising. We are now adapting this methodology to 2H-MRSI, with high spatial resolution.
INTRODUCTION
Cancer metabolic plasticity is associated with malignant phenotypes [1] but there are no imaging methods to assess this noninvasively. Recent work has demonstrated the potential of 2H-MRS to monitor normal brain and glioma metabolism in rats [2,3]. Moreover, denoising based on tensor decomposition has shown significant improvements in 13C-MRS quality in mouse tumors [4]. Here, we evaluate the combination of a customized 2H/1H RF coil design for the mouse brain, and a novel application of Marchenko–Pastur denoising to 2H-MRS, to dynamically monitor early metabolic changes in glioma-bearing mice in response to a reversible perturbation.METHODS
All animal experiments were preapproved by institutional and national authorities, and carried out according to European Directive 2010/63.MR setup.
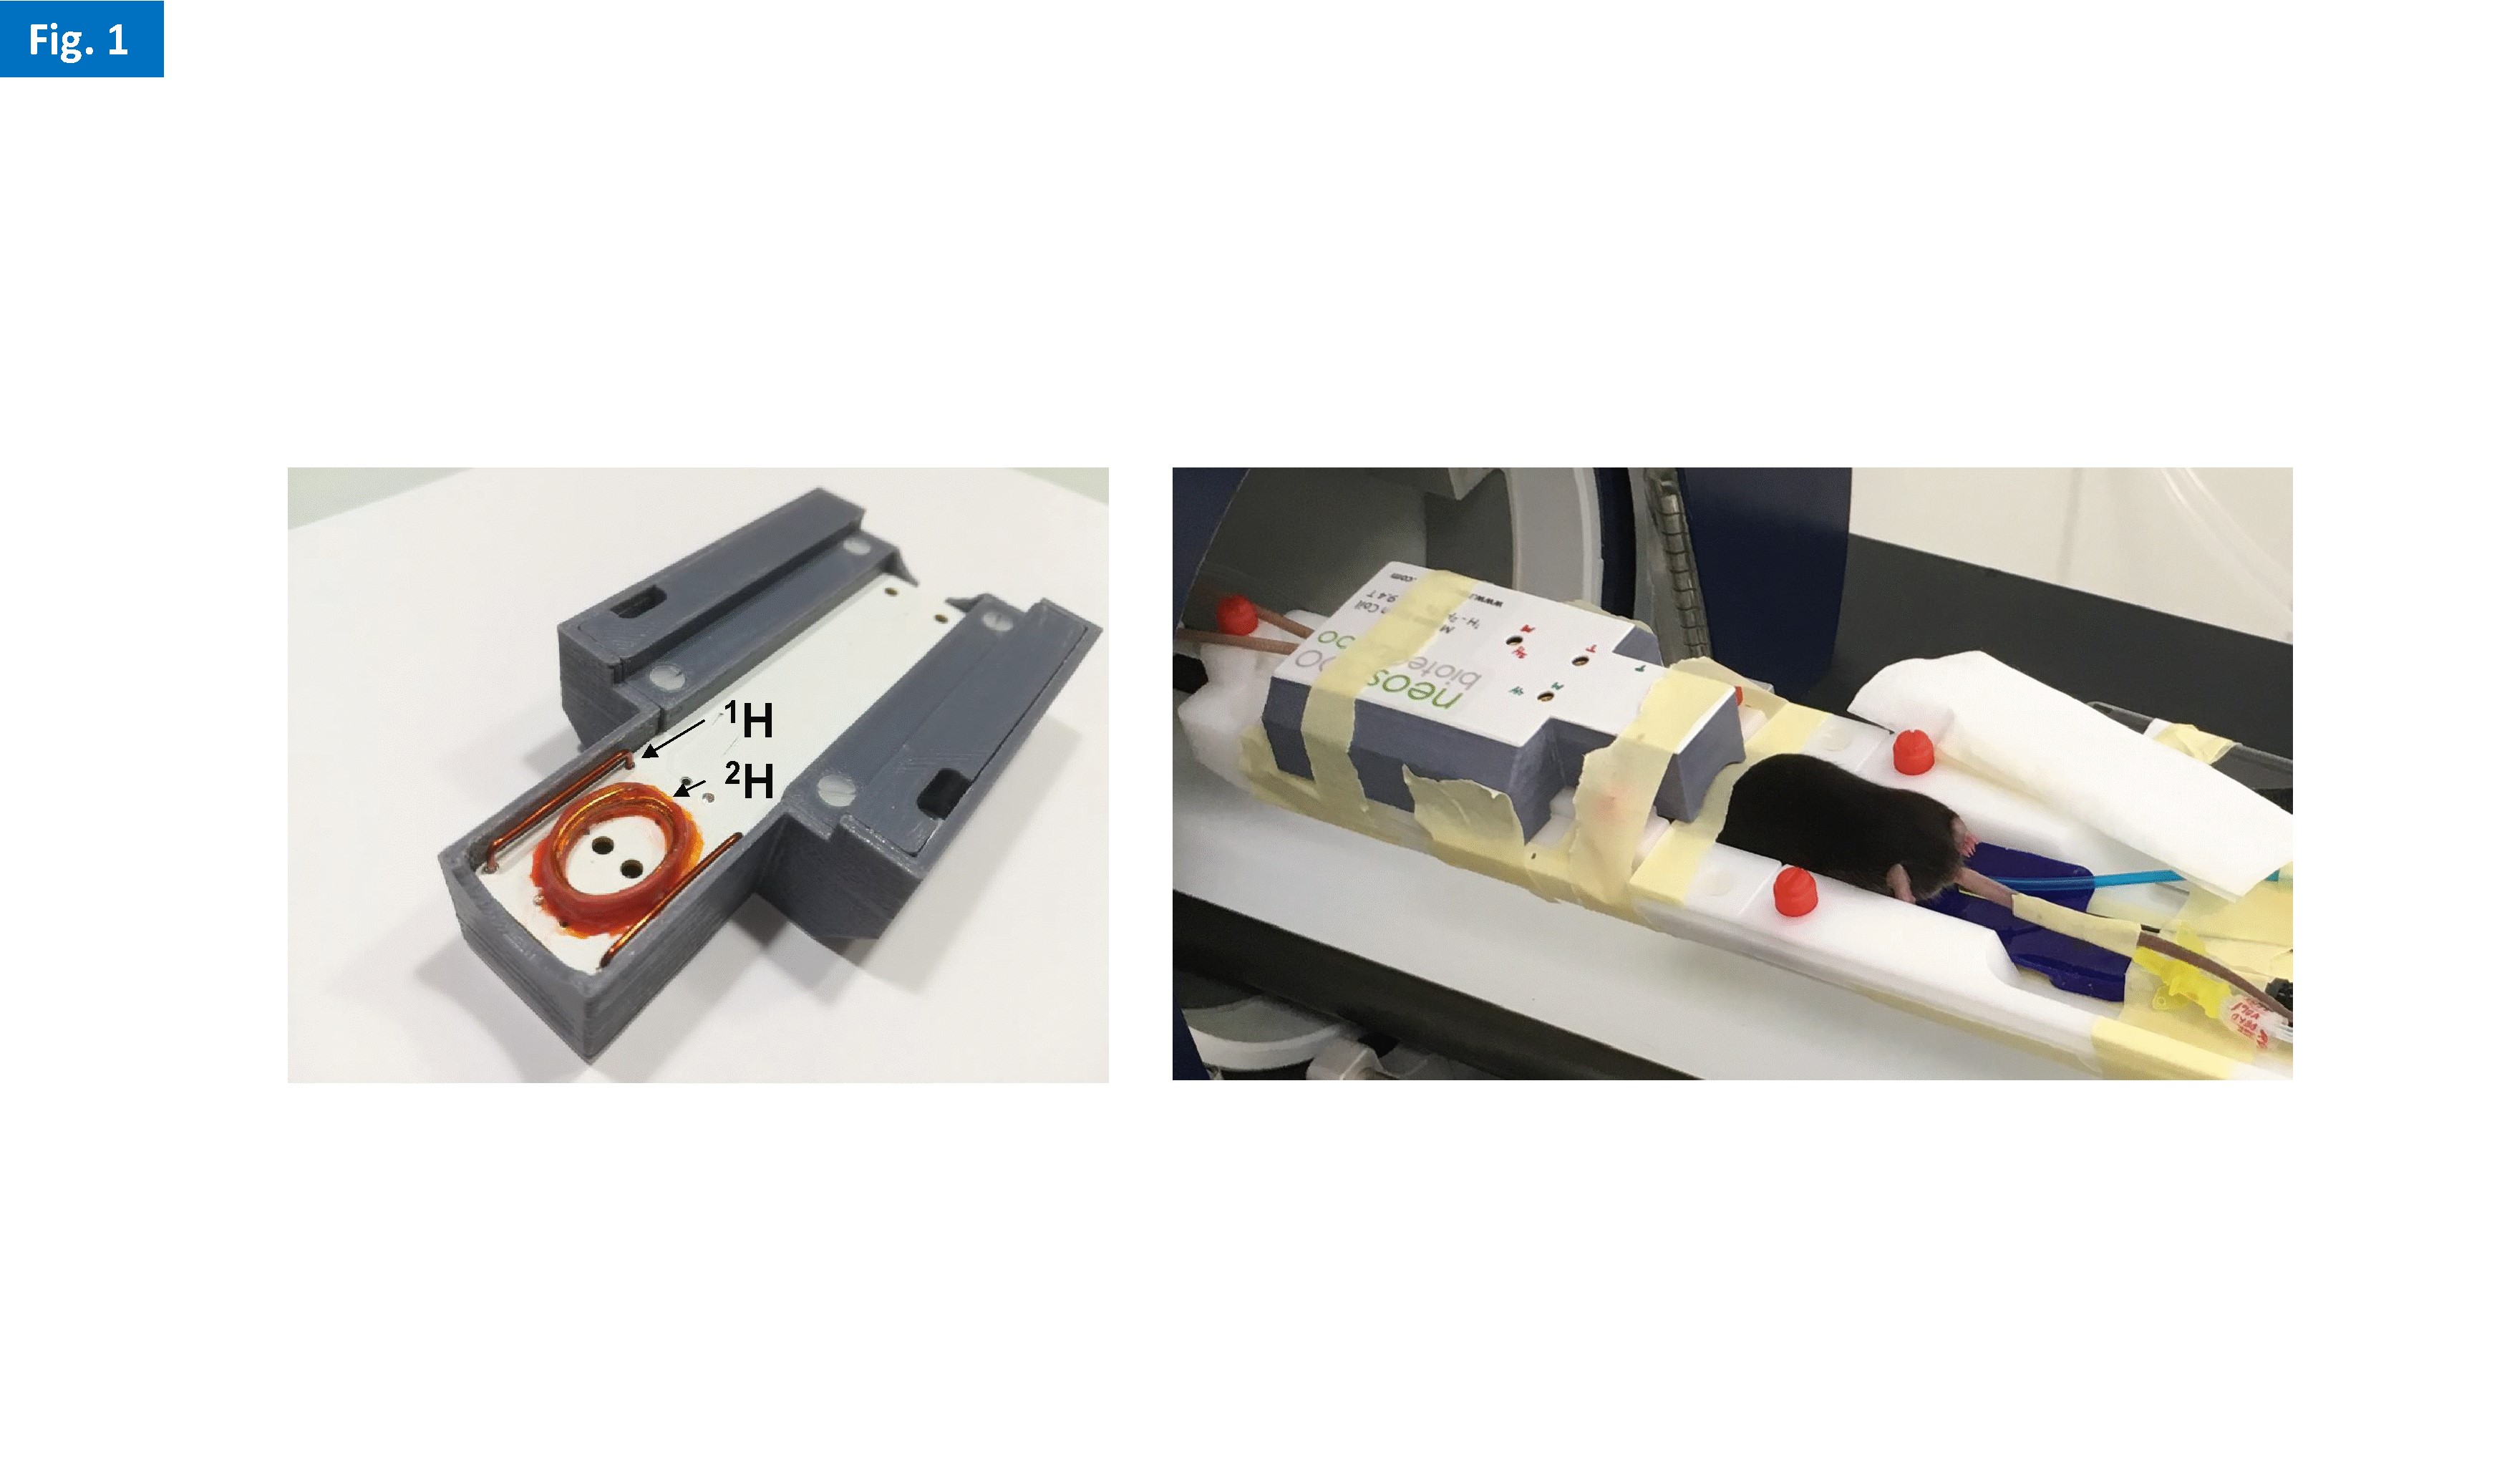
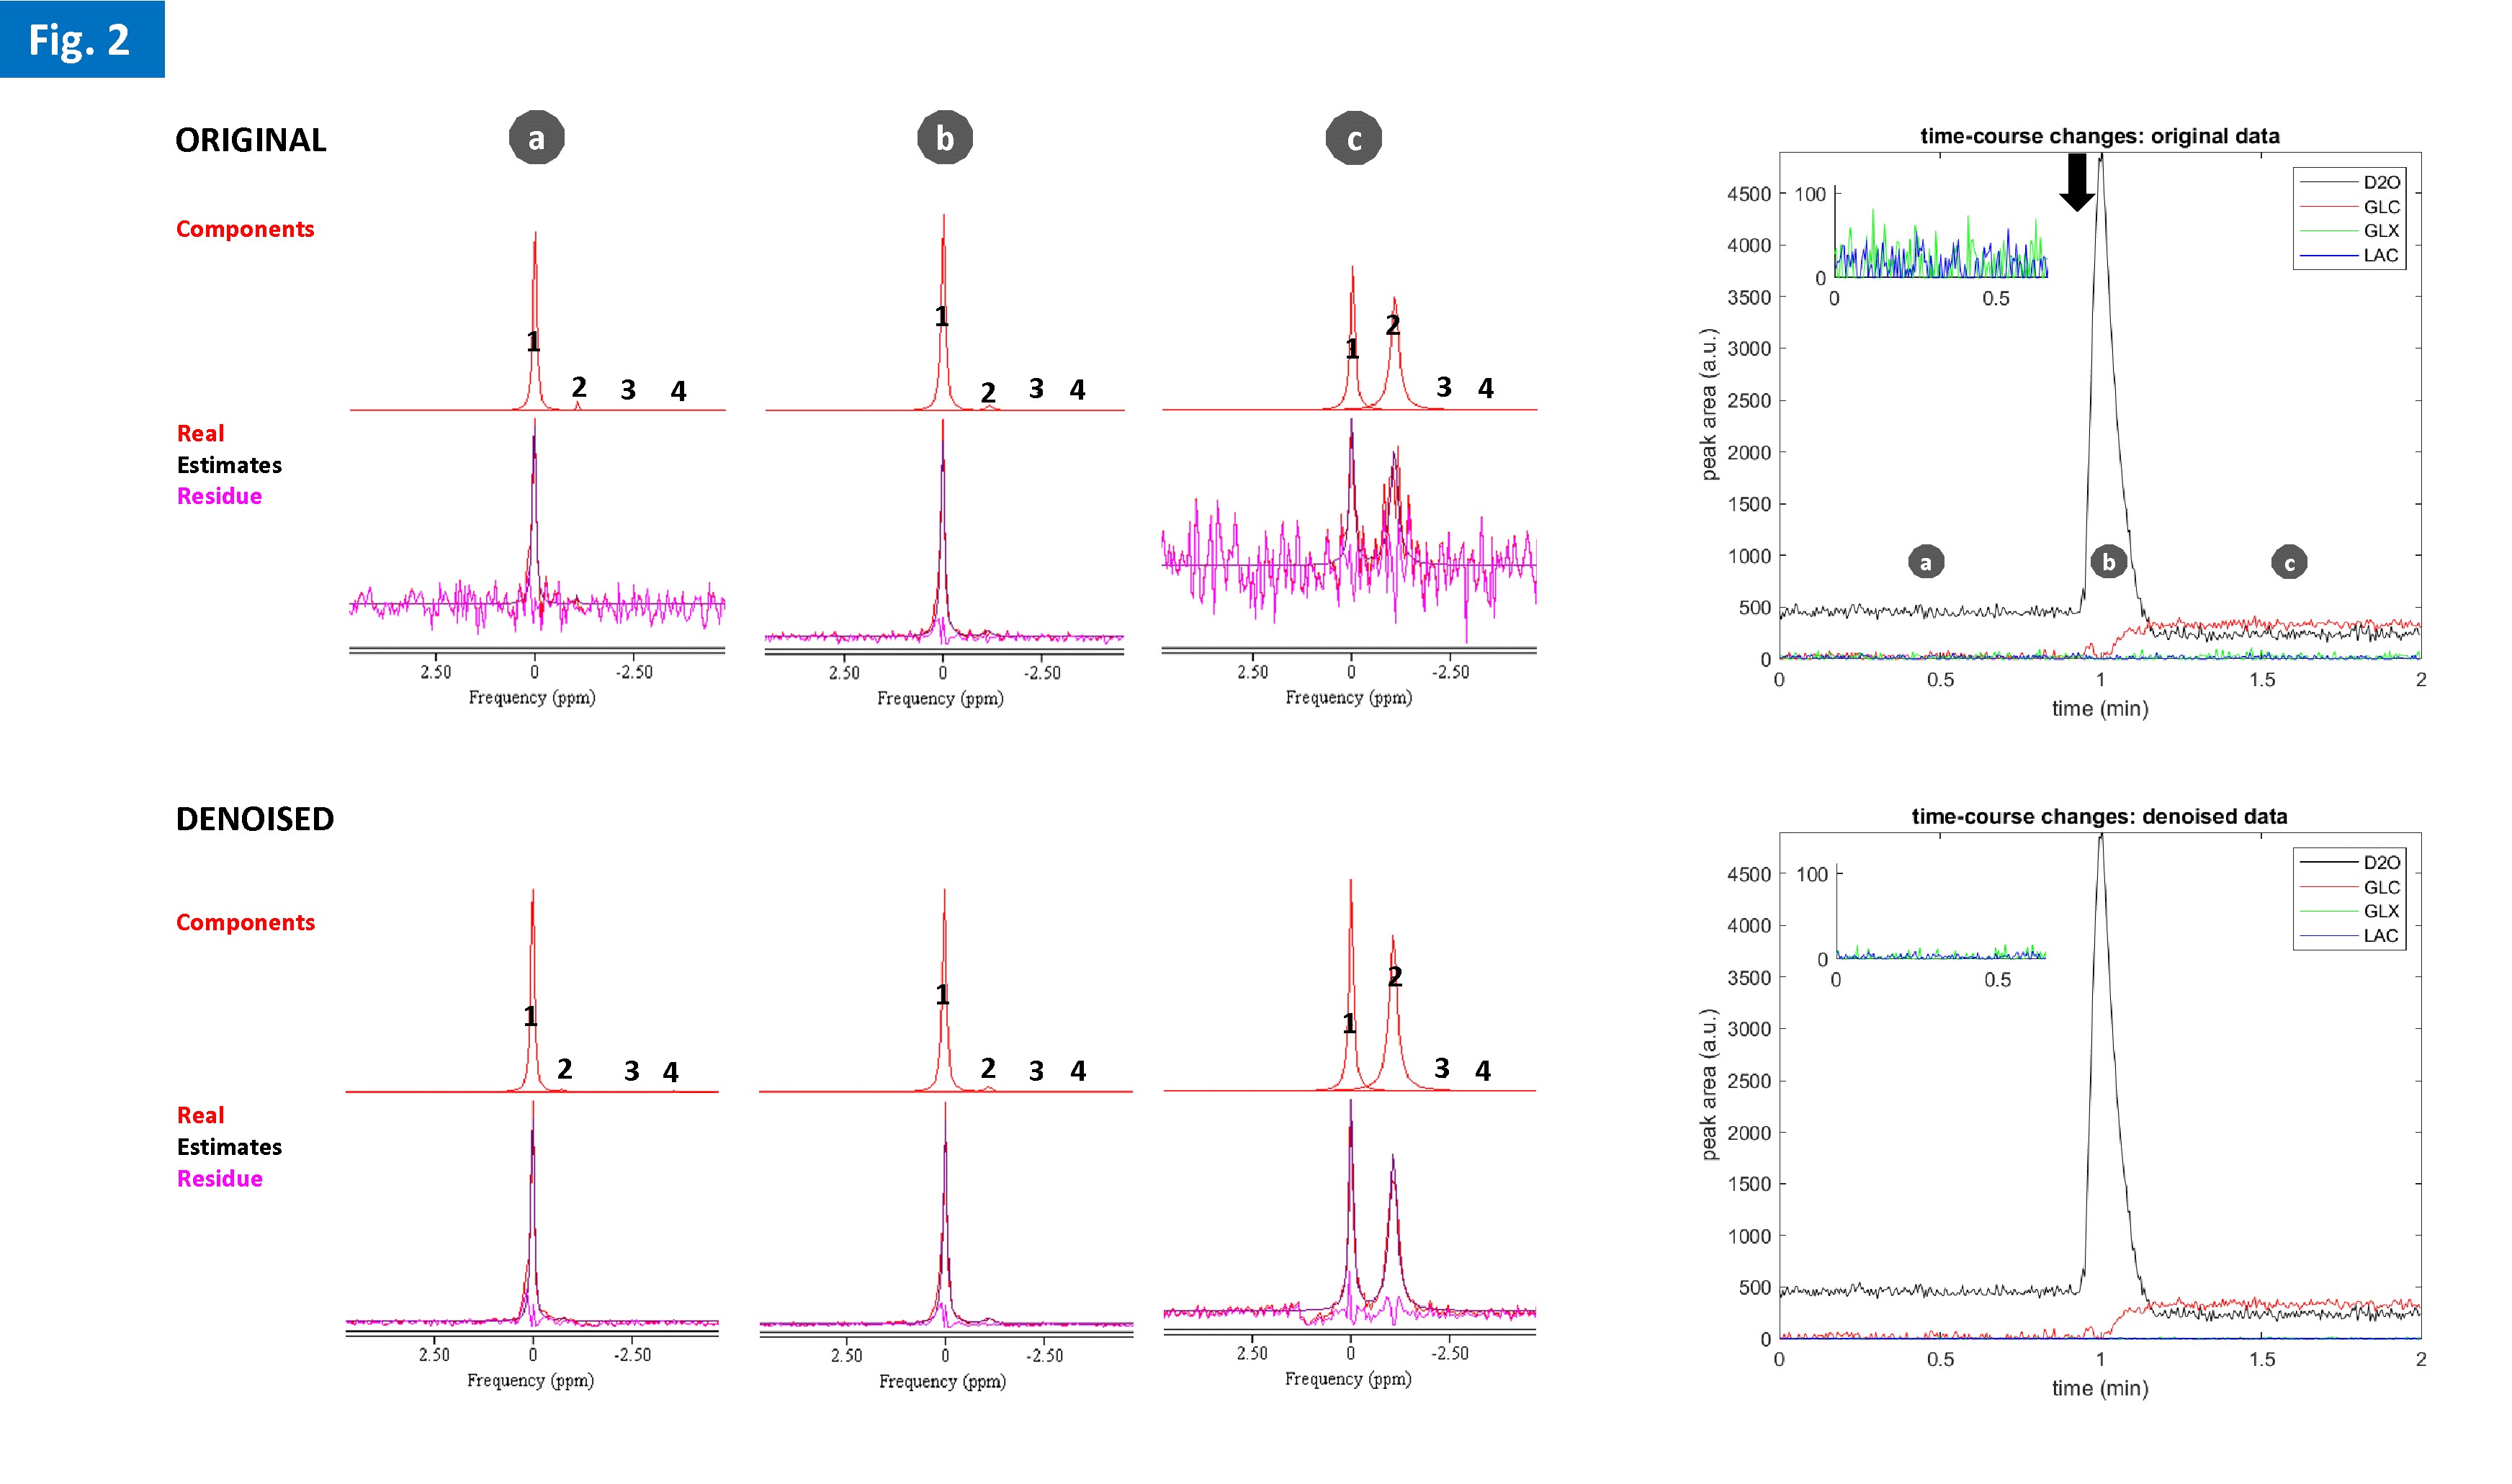
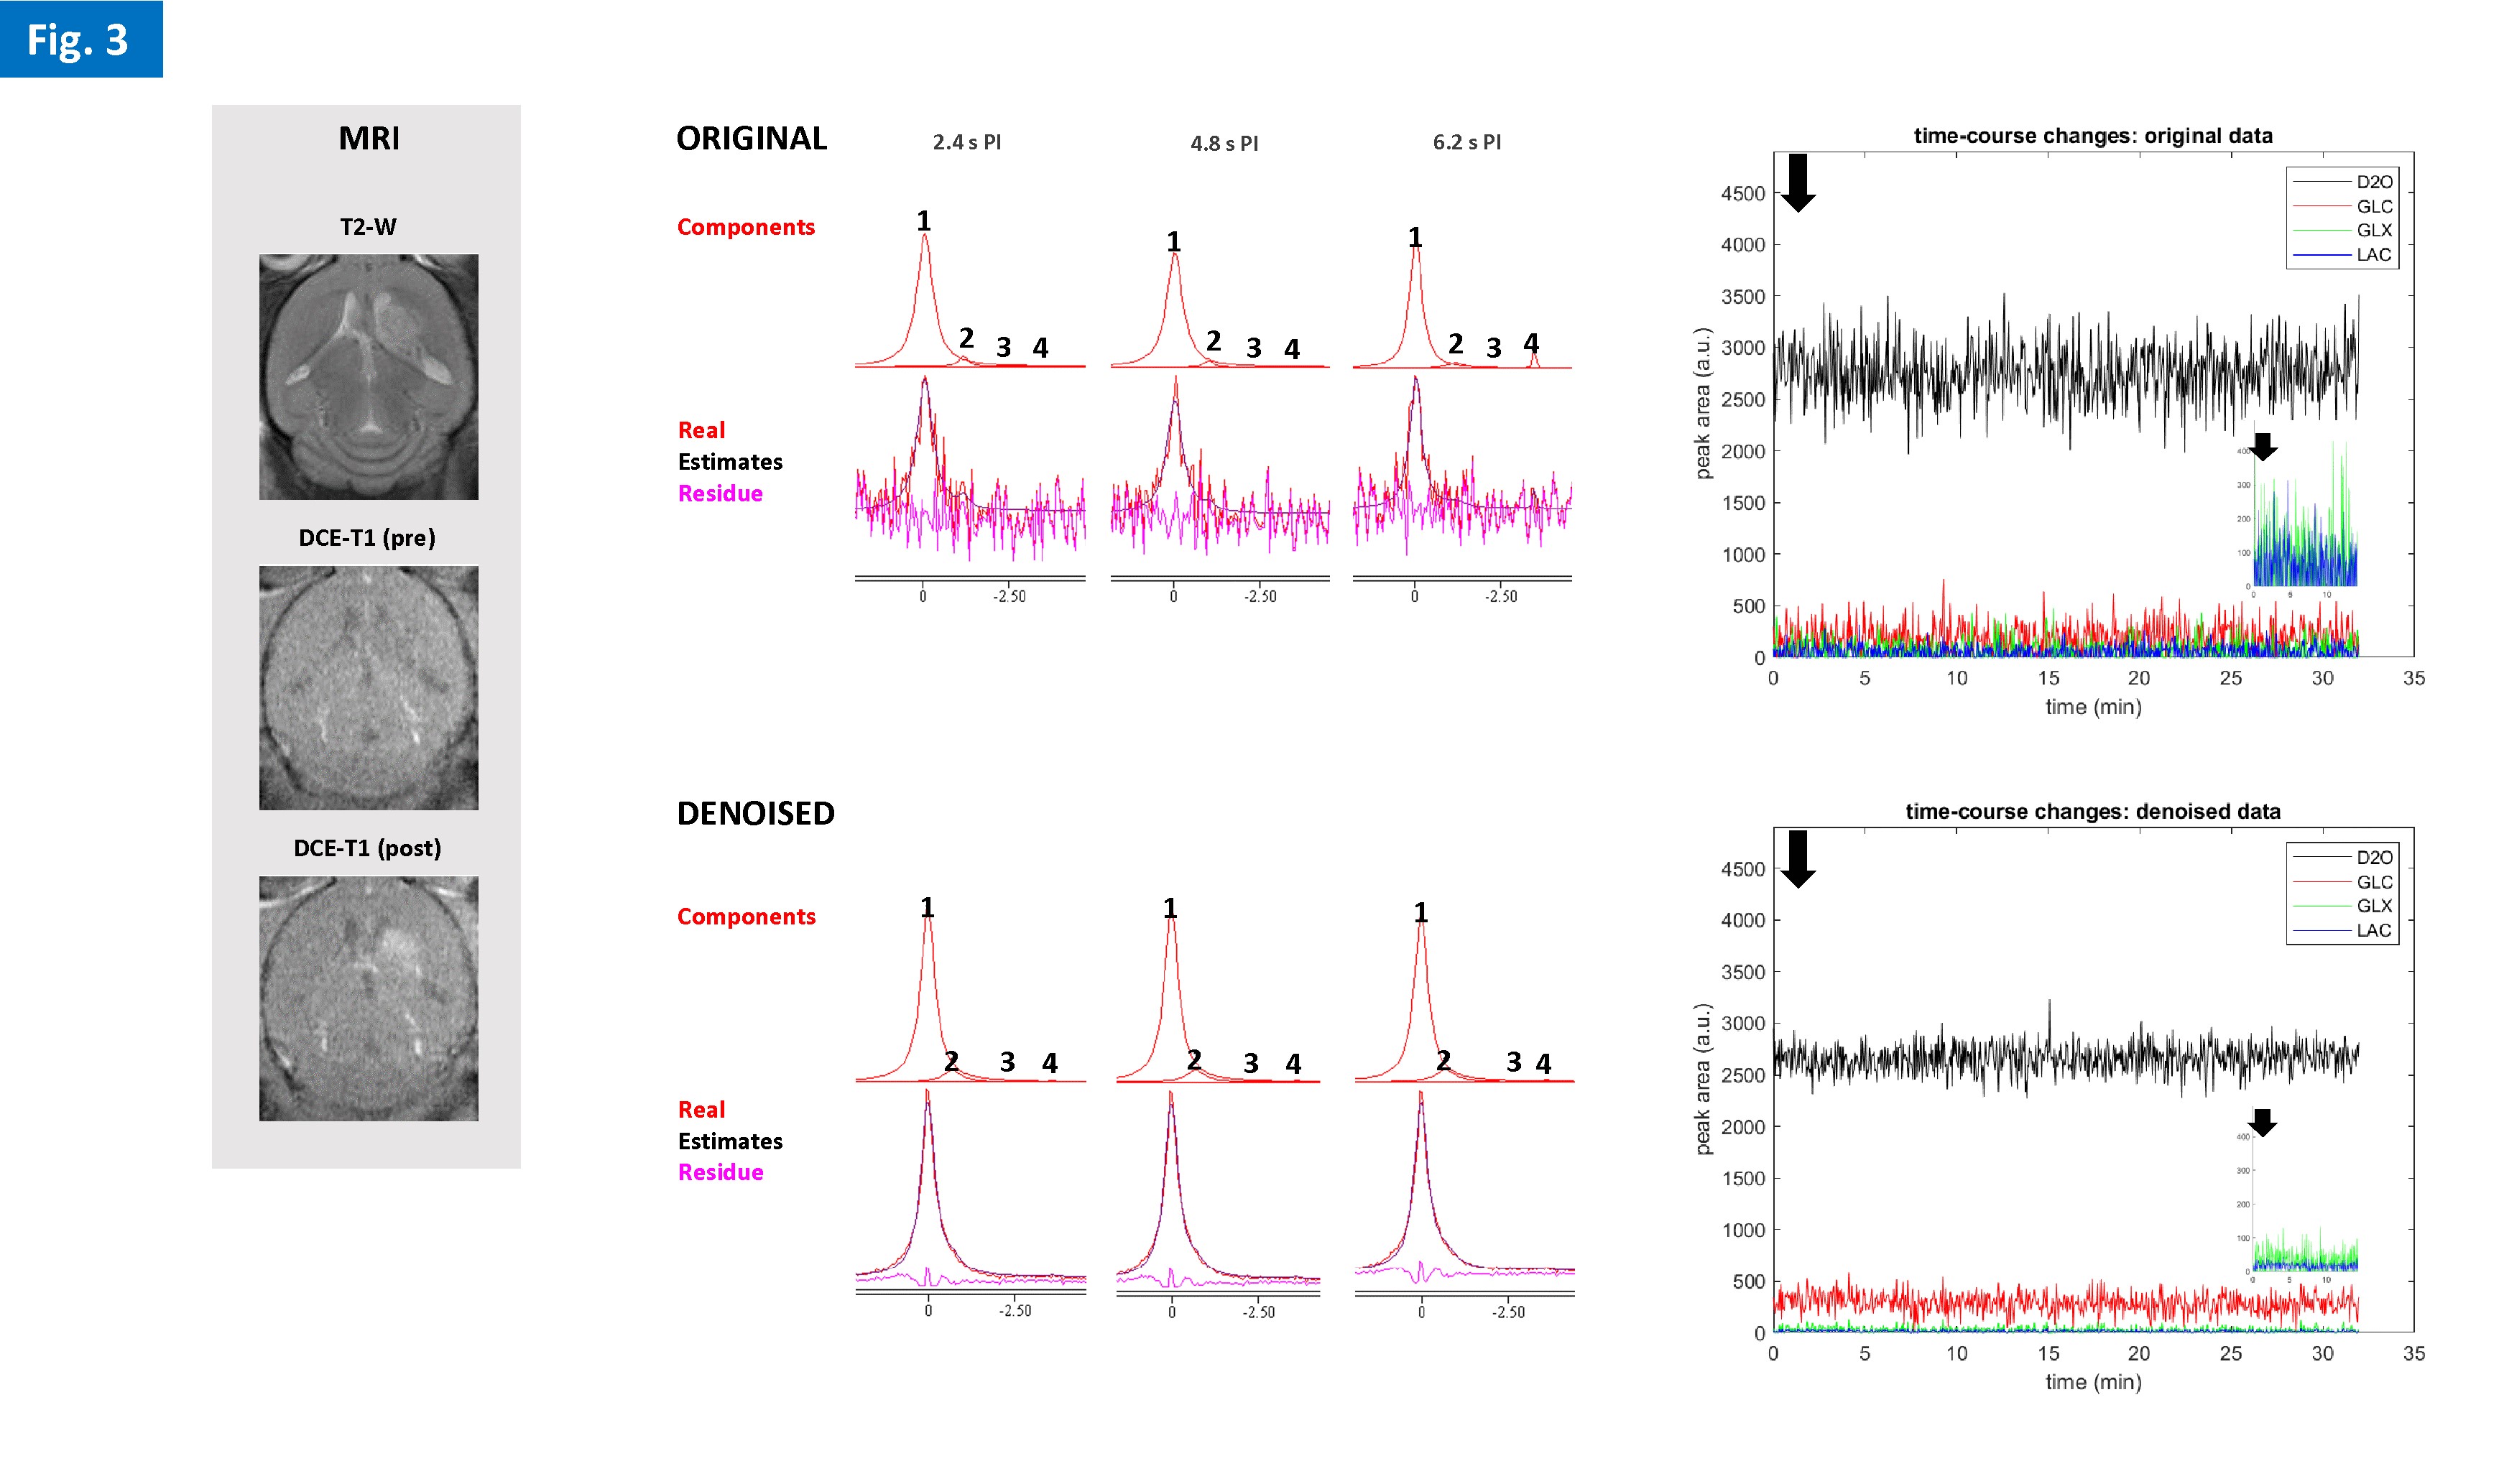
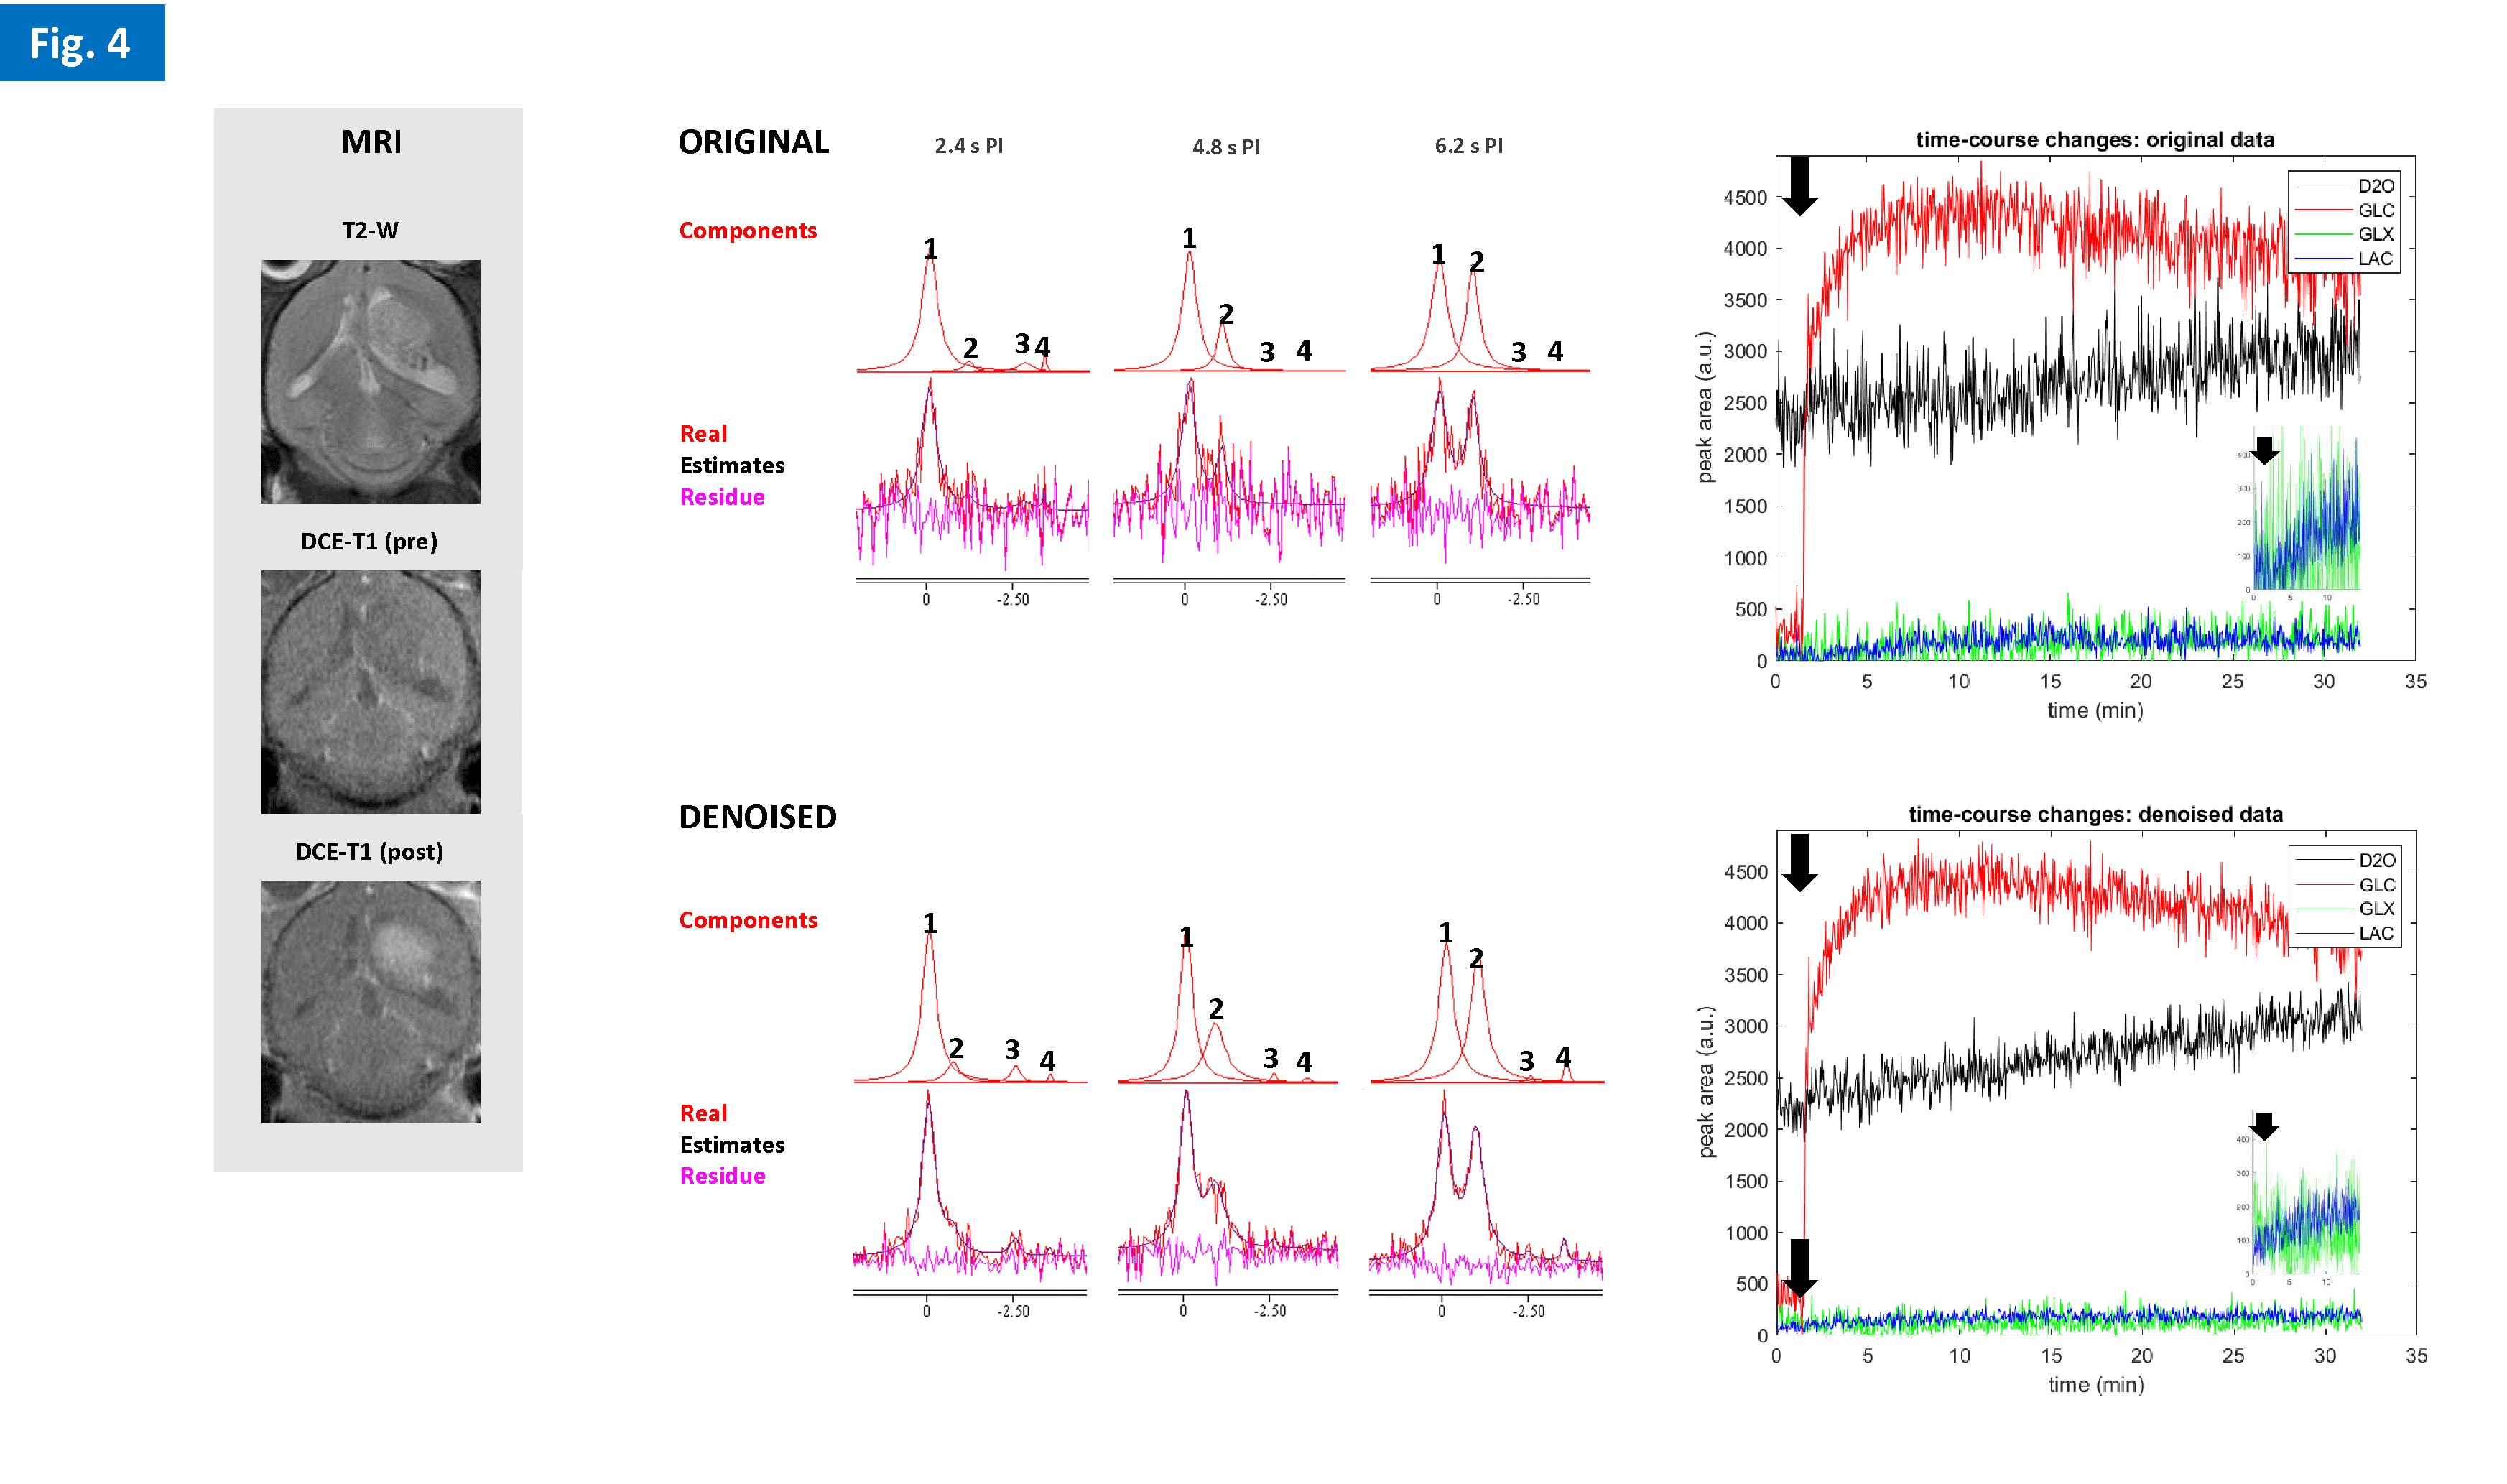
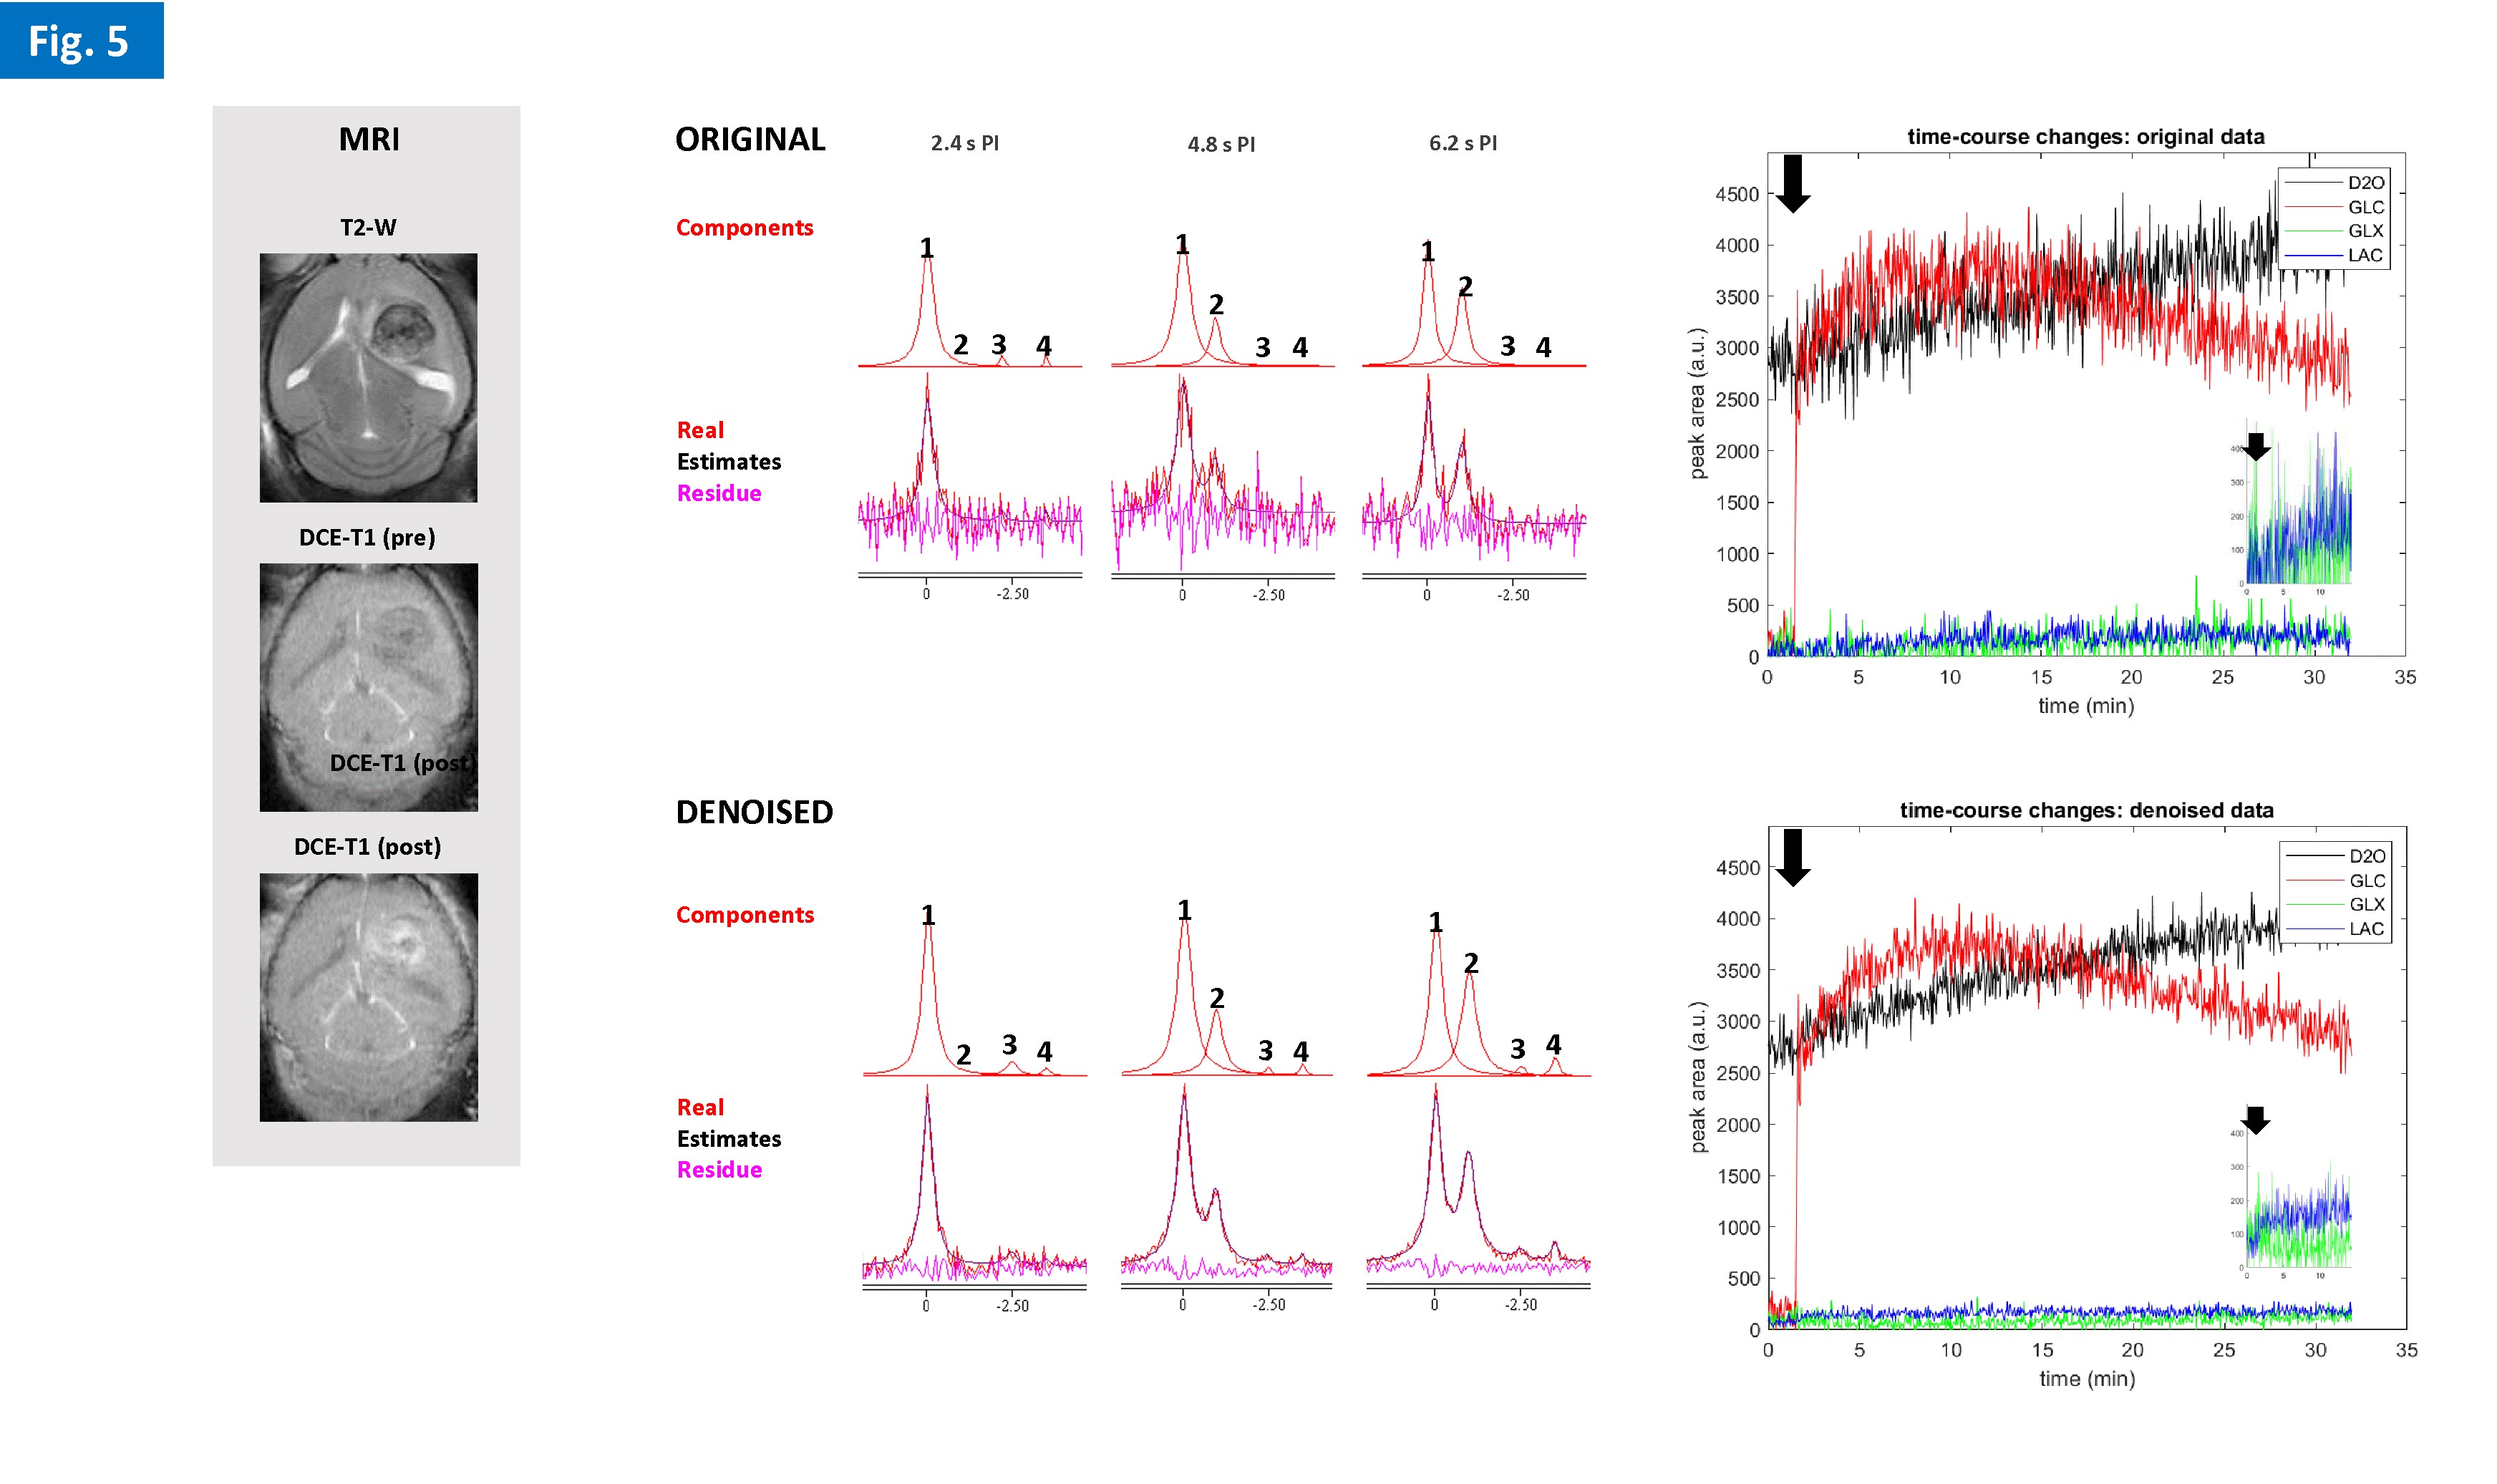
All experiments were performed on a 9.4 T Bruker BioSpec, using a Neos Biotec customized 2H/1H transmit-receive surface coilset: 2H, 11 x 15 mm loop, with high sensitivity for the mouse head; 1H, butterfly configuration, providing quadrature B1 field orientation that minimizes coil coupling (Fig. 1). 2H-MRS data were acquired with a 90º single pulse sequence, TR=300ms, 512 points, and 1749 Hz. In vitro and ex vivo. Spectral quality/sensitivity were evaluated using a homebuilt glass-sphere phantom where D2O and 2H-labelled glucose (6,6′-2H2-glucose) mixtures were changed during the experiments between 25M-25mM and 500-5mM, respectively. Dynamic 2H-MRS data were acquired with 1 average (300 ms resolution) and 200 repetitions, and 2H-labelled glucose injected after 1 min. For mouse studies, RF pulse calibration was initially performed with an excised mouse head loaded with D2O: animal i.c. perfused with D2O after sacrifice (pentobarbital 200mg/Kg i.p.), head chopped, and the neck region occluded. In vivo. High grade gliomas were induced in 2, 10-week-old female mice (GL#1 and GL#2) by intracranial stereotactic injection of 105 GL261 cells in the caudate nucleus [5] and studied 2 weeks later. Before each experiment, mice were fasted for 4-6h, weighted (22-24g), cannulated in the tail vein and placed in the animal holder under anesthesia (1.5-2.0% isoflurane in 29% O2), where they were heated with a recirculating water blanket, and monitored for rectal temperature (35-37 ºC) and breathing (60-80 BPM); the i.v. catheter was connected to a home-built 3-way injection system filled with heparinized saline (10U/mL), glucose (1.6M), and Gd-DOTA (25mM). The RF coil quality factor (Q) was measured for both nuclei: frequency / wobble curve full width at half minimum. Animals were imaged first with T2-RARE (acceleration 8, 2500ms TR, 40ms TE; 4 averages, 1.25mm slice thickness, 125μm in plane resolution). Dynamic 2H-MRS data were then acquired with 8 averages (2.4 s resolution) and 800 repetitions, with i.v. bolus of glucose (1.2 g/Kg, 30 s) after 1.5 min. This protocol was tested first with cold (non-labelled) glucose in mouse GL#1 and repeated in the same animal 2 days later, using 6,6’-2H2 glucose; the latter experiment was reproduced with mouse GL#2. Before finalizing the study, each animal underwent DCE-T1 MRI (FLASH, 10º excitation, 16.5ms TR, 4 averages, 150 repetitions, 1.25mm slice thickness, and 125μm in plane resolution; Gd-DOTA i.v. bolus 0.1 mmol/Kg, 30 s) to confirm good permeability/perfusion of the tumor. After completing the study, blood glycemia was measured with a pocket glucometer. Data analysis. MRI images were visualized in Bruker ParaVision 6.0.1. 2H-MRS data were processed in MATLABTM R2018b with Marchenko–Pastur denoising [6] and analyzed by individual peak fitting using jMRUI 6.0b [7], with an AMARES basis set for D2O (0 ppm) and 2H-labelled: glucose (-0.95 ppm), glutamine-glutamate (-2.4 ppm), and lactate (-3.45 ppm).
RESULTS
Phantom experiments showed high sensitivity to D2O natural abundance (~0.03% in water) and physiologic concentrations of glucose (5mM), as well as the advantage of denoising to improve fitting performance in noise regions (Fig. 2). The in vivo studies demonstrated good and reproducible Q-factor for both nuclei in the mouse head: 1H, 185-200; 2H, 181-186. All gliomas had good perfusion/permeability, according to DCE-T1 MRI (Figs 3-5). The cold glucose study demonstrated high sensitivity to D2O natural abundance in vivo, time-course spectral stability, and higher quantification precision using denoising (Fig. 3). The 2H-labelled glucose studies (Fig. 4-5) revealed dynamic metabolic changes in glioma-bearing brains, with <3 s temporal resolution; denoising notably improved the detection of early kinetic changes in de novo lactate, associated with Warburg effect, and overall quantification performance. Blood glycemia had normalized by the end of each study, ~2h after 2H-labelled glucose bolus: GL#1, 8 mM; GL#2, 6 mM.DISCUSSION
While previous 2H-MRS studies focused on rat brain and relatively long i.v. infusion times (2H-labelled glucose: 1.95 g/Kg over 2h [3]; 1.3 g/Kg over 2 min [2]), we demonstrate the feasibility of 2H-MRS in the mouse brain using quick bolus injection (1.2 g/Kg over 30 s), and an acquisition and processing setup that provides sensitivity to track early metabolic responses, such as lactate.CONCLUSION
2H-MRS is feasible in glioma-bearing mice. We are currently adapting this methodology to 2H-MRSI, to resolve intra-tumor metabolic heterogeneity.Acknowledgements
The authors thank Ms. Francisca Fernandes for periodic MRI monitoring of glioma-bearing mice.
Funding Support: Champalimaud Foundation; H2020-MSCA-IF-2018, ref. 844776.
References
1. Lehuédé C et al. Cancer Res. 2016; 76:5201-08.
2. Lu et al. JCBFM 2017; 37: 3518-3530
3. De Feyter et al. Sci Adv. 2018; 4: eaat7314.
4. Brender et al. Sci Rep. 2018; 9: 3410.
5. Simões et al. NMR Biomed. 2008; 21: 251-264,
6. Veraart et al. Magn Reson Med. 2016; 76: 1582-1593.
7. Stefan et al. Meas Sci Technol. 2009; 20: 104035
Figures