0473
In vivo NAD+/NADH Measurements in the Human Brain using 31P MRS at 4 T and 7 T1McLean Hospital; Harvard Medical School, Belmont, MA, United States, 2McLean Hospital, Belmont, MA, United States, 3University of Minnesota, Minneapolis, MN, United States
Synopsis
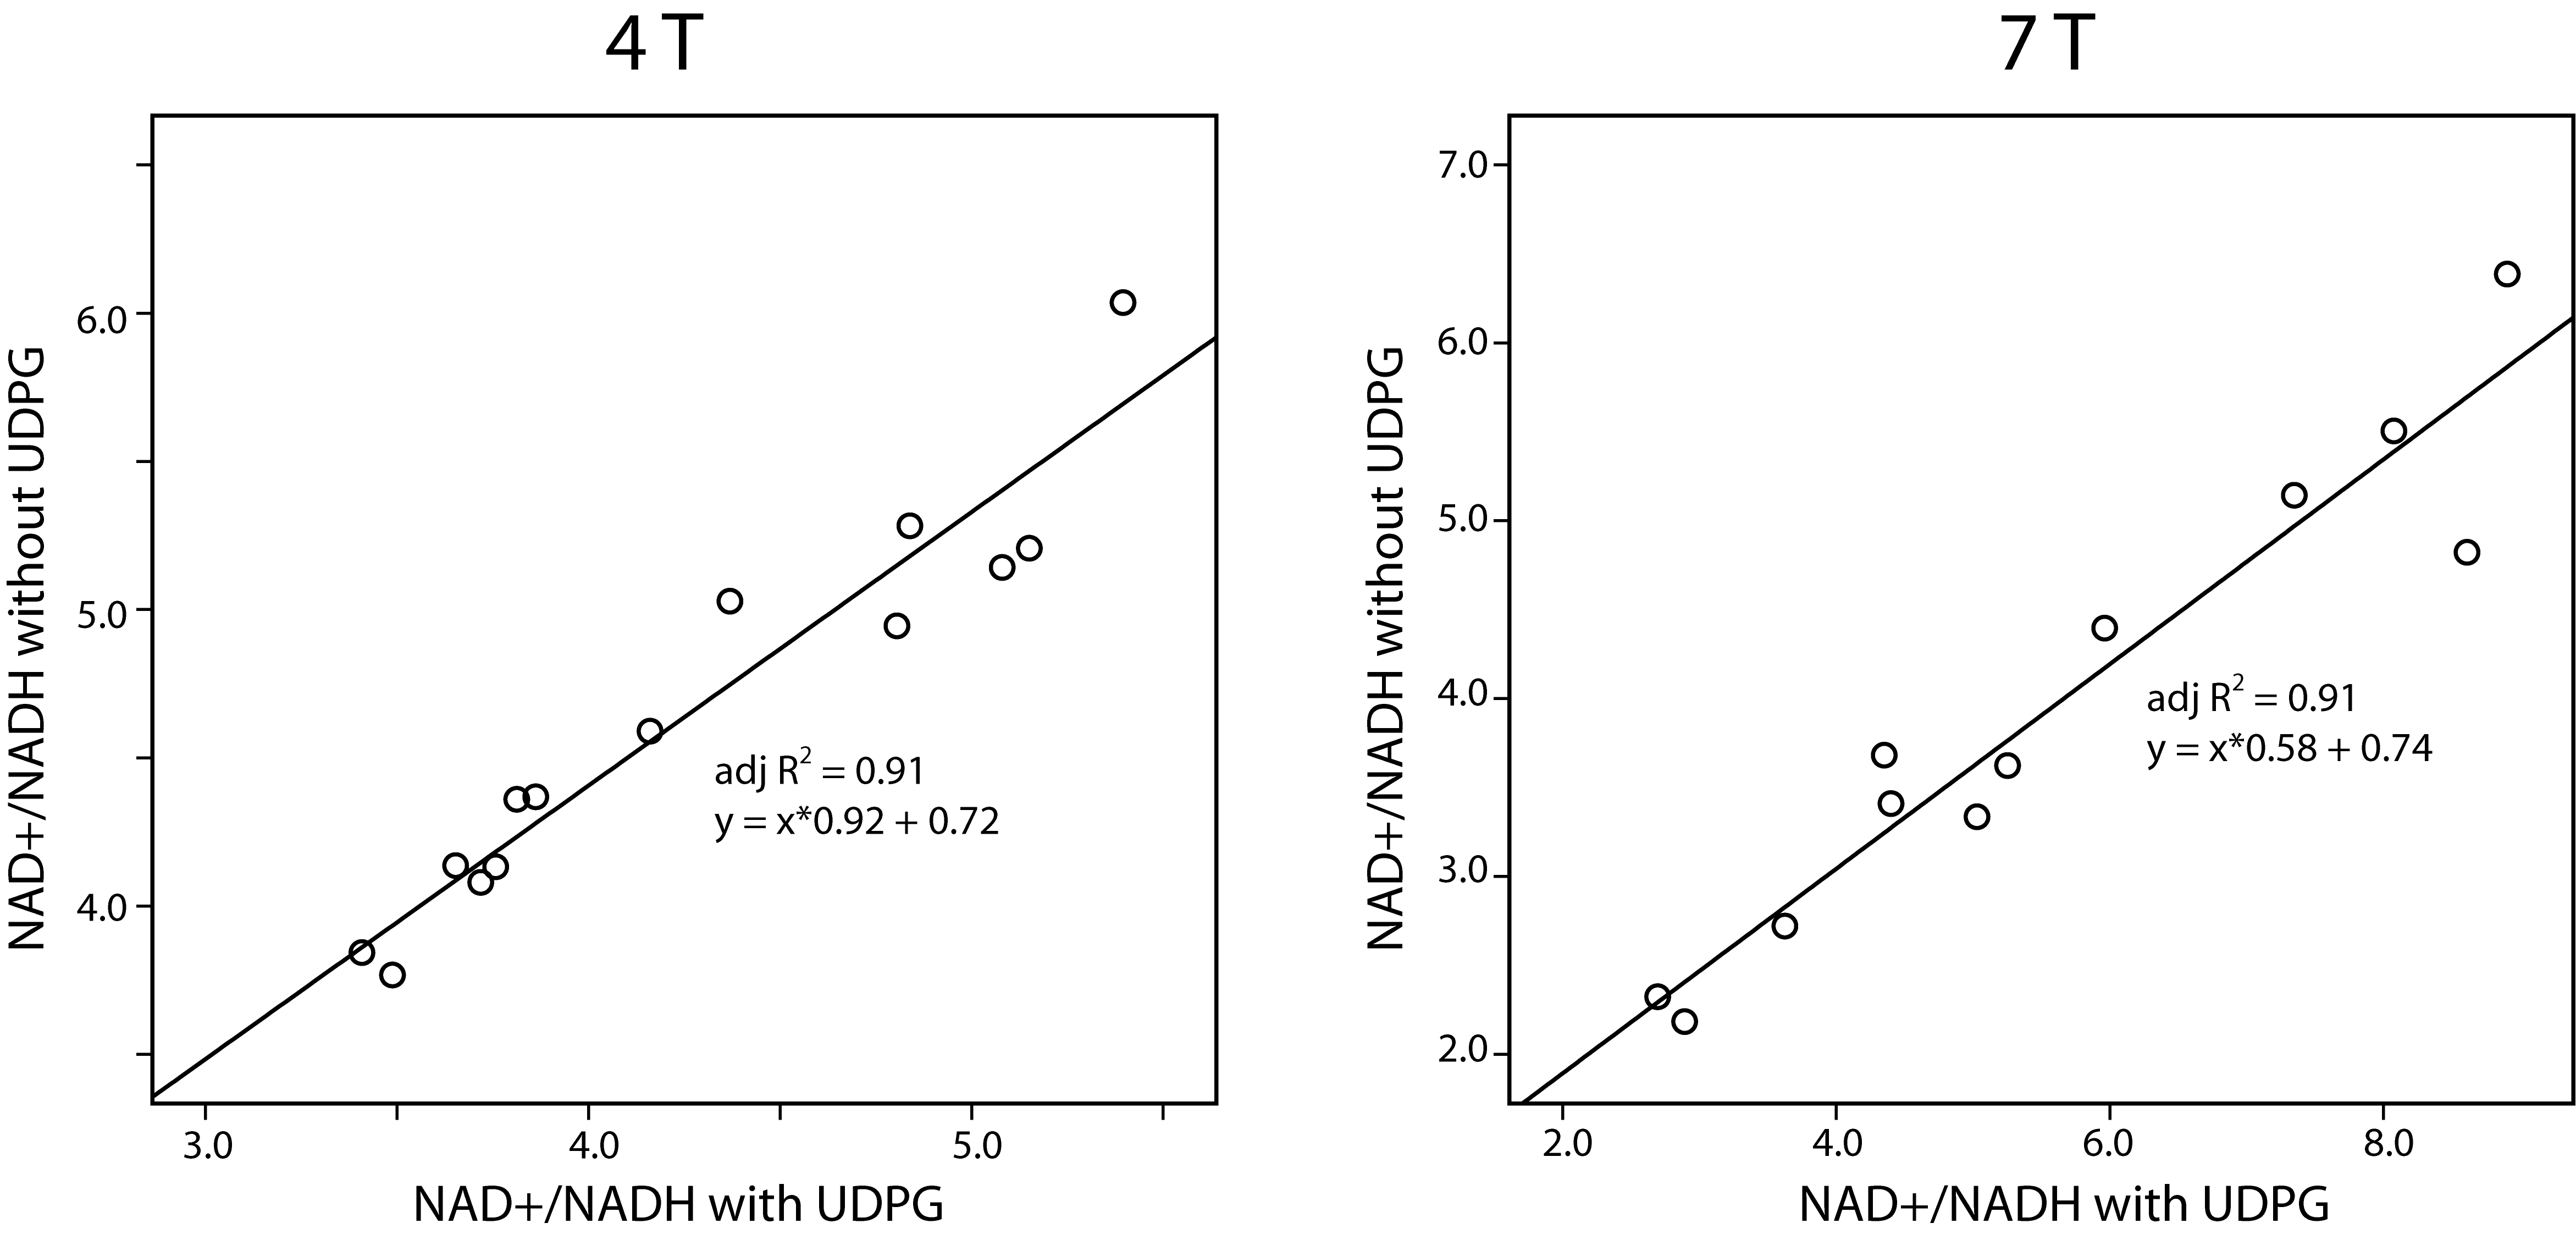
Nicotinamide adenine dinucleotides play a crucial role in human health, but measuring the redox ratio (NAD+/NADH) in vivo is technically challenging and the confounding effects from UDPG remain unclear. In this study, for the first time we observed that the NAD+/NADH values decreased in 4T proton-decoupling spectra when the UDPG contribution was accounted for as well as confirming the opposite trend at 7T. Furthermore, we revealed different overlapping patterns at 4T and 7T which lead to this result. Finally, individual redox ratio measures with and without UDPG quantification are strongly correlated with one another at both 4T and 7T.
Introduction
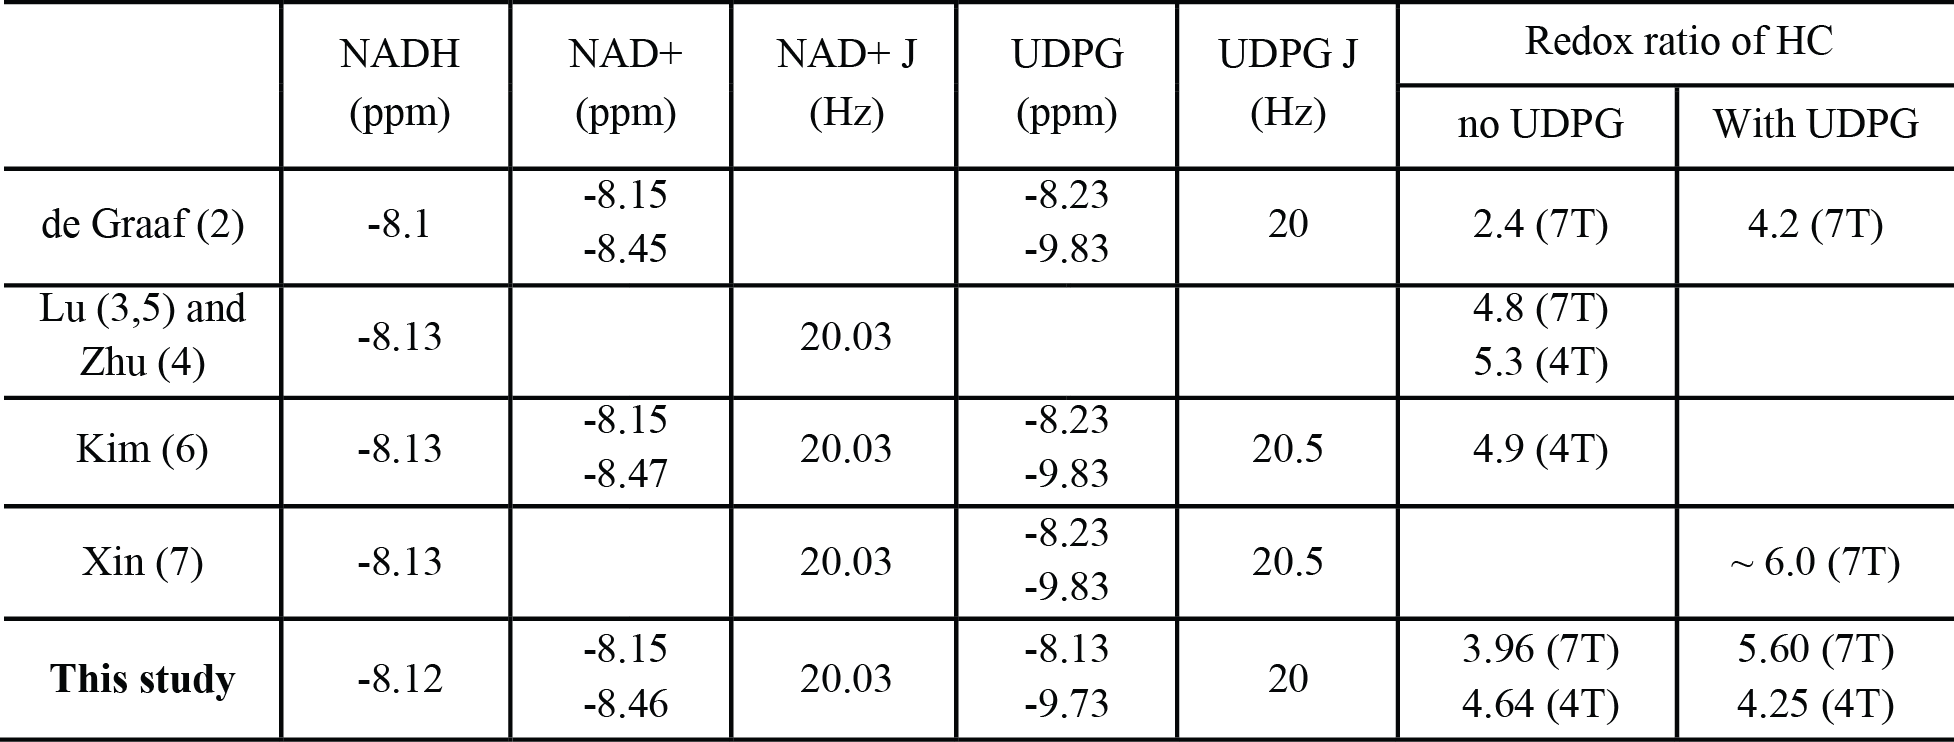
Nicotinamide adenine dinucleotide (NAD), which exists in oxidized (NAD+) and reduced (NADH) forms, has long been implicated in energy metabolism, reductive biosynthesis, and antioxidant activity. The balance between the redox pair of NAD+ and NADH reflects the oxidative state of cells and the ability of biological systems to carry out energy production (1). Despite the crucial roles of NAD+ and NADH (together termed NAD metabolites), noninvasive in vivo detection is extremely challenging due to their low concentration (< 1 mM) and overlapping resonances. Robin de Graaf et al. achieved 1H magnetic resonance spectroscopy (MRS) detection of NAD+ (2) but the observation of NADH is still unavailable. In vivo 31P MRS provides an alternative approach for NAD quantification, and has been developed recently to directly quantify NAD+ and NADH in vivo at ³ 7 T (3,4) as well as at 4 T incorporated with proton decoupling (5). Equipped with this 31P MRS method, redox dysregulation in schizophrenia (6) and the effect of nutritional ketosis on the redox ratio (i.e. NAD+/NADH) in the healthy human brain (7), as well as aging dependence of NAD redox ratio (3,4) have been observed. However, the reported redox ratio values are subject to a large range (2~7) (Table 1) and quantification of NAD+ and NADH with/without considering uridine diphosphate glucose (UDPG) has not been fully studied. In this study, we compared the 4 T 31P MRS with 1H decoupling and 7 T 31P MRS without 1H decoupling for NAD+/NADH quantifications in the human brain. The influence of including or excluding UDPG in the quantification, as well as the reliability assessment with LCModel quantification are also discussed.Methods
14 healthy human volunteers (24±5 years old, 11 females) participated in the 31P MRS study with 1H decoupling on a 4 T whole-body scanner (McLean Hospital) interfaced with Varian INOVA console. 31P spectra were acquired from the frontal lobe of the brain with a dual tuned radiofrequency (RF) surface coil covering the forehead. The 31P MRS was acquired with single pulse followed by a decoupling pulse train with WALTZ-16. Spectral width = 5000 Hz, TR = 3 s, average = 464 (23-min data acquisition). A separate group of 12 healthy human volunteers (25±3 years old, 7 females) participated in 7 T scans with a 90-cm bore actively shielded human magnet (University of Minnesota). 31P MRS without 1H decoupling was acquired from the occipital lobe at 7 T. Spectral width = 5000 Hz, TR = 3 s, average = 384 (19-min data acquisition). Data processing was performed using FID-A (8) with phase and frequency corrections. The quantification was performed in LCModel (9). The basis sets were simulated using VeSPA (10) for 4 T and 7 T, respectively, using the same chemical shifts and J coupling information (see Table 1). 4 T and 7 T spectra were summed separately and quantified in LCModel, to provide high SNR spectra for better confirmation of fitting parameters and observation of group effects. Paired t-test and correlation analyses were performed using SPSS to compare different data processing strategies at 4 T and 7 T.Results and discussions
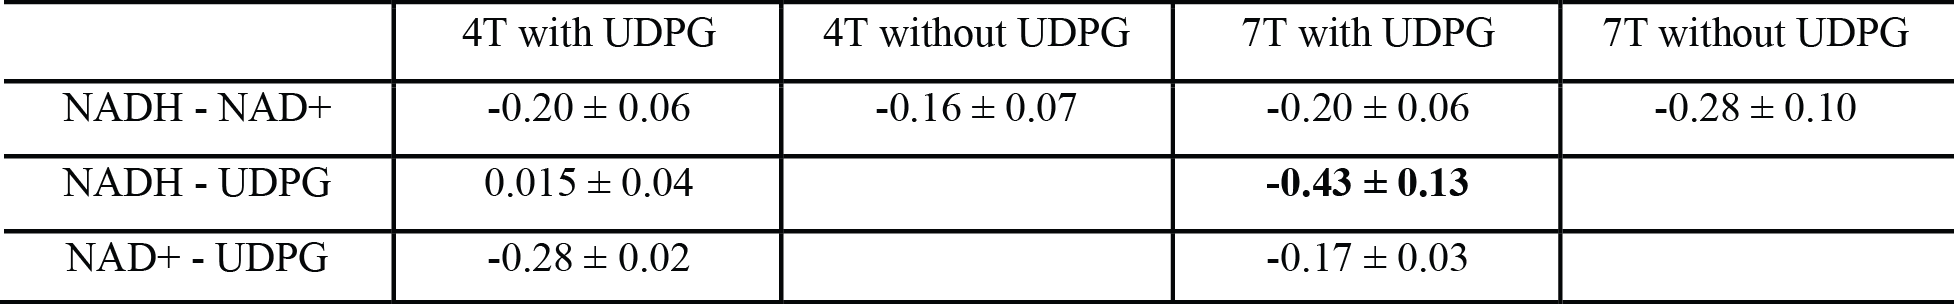
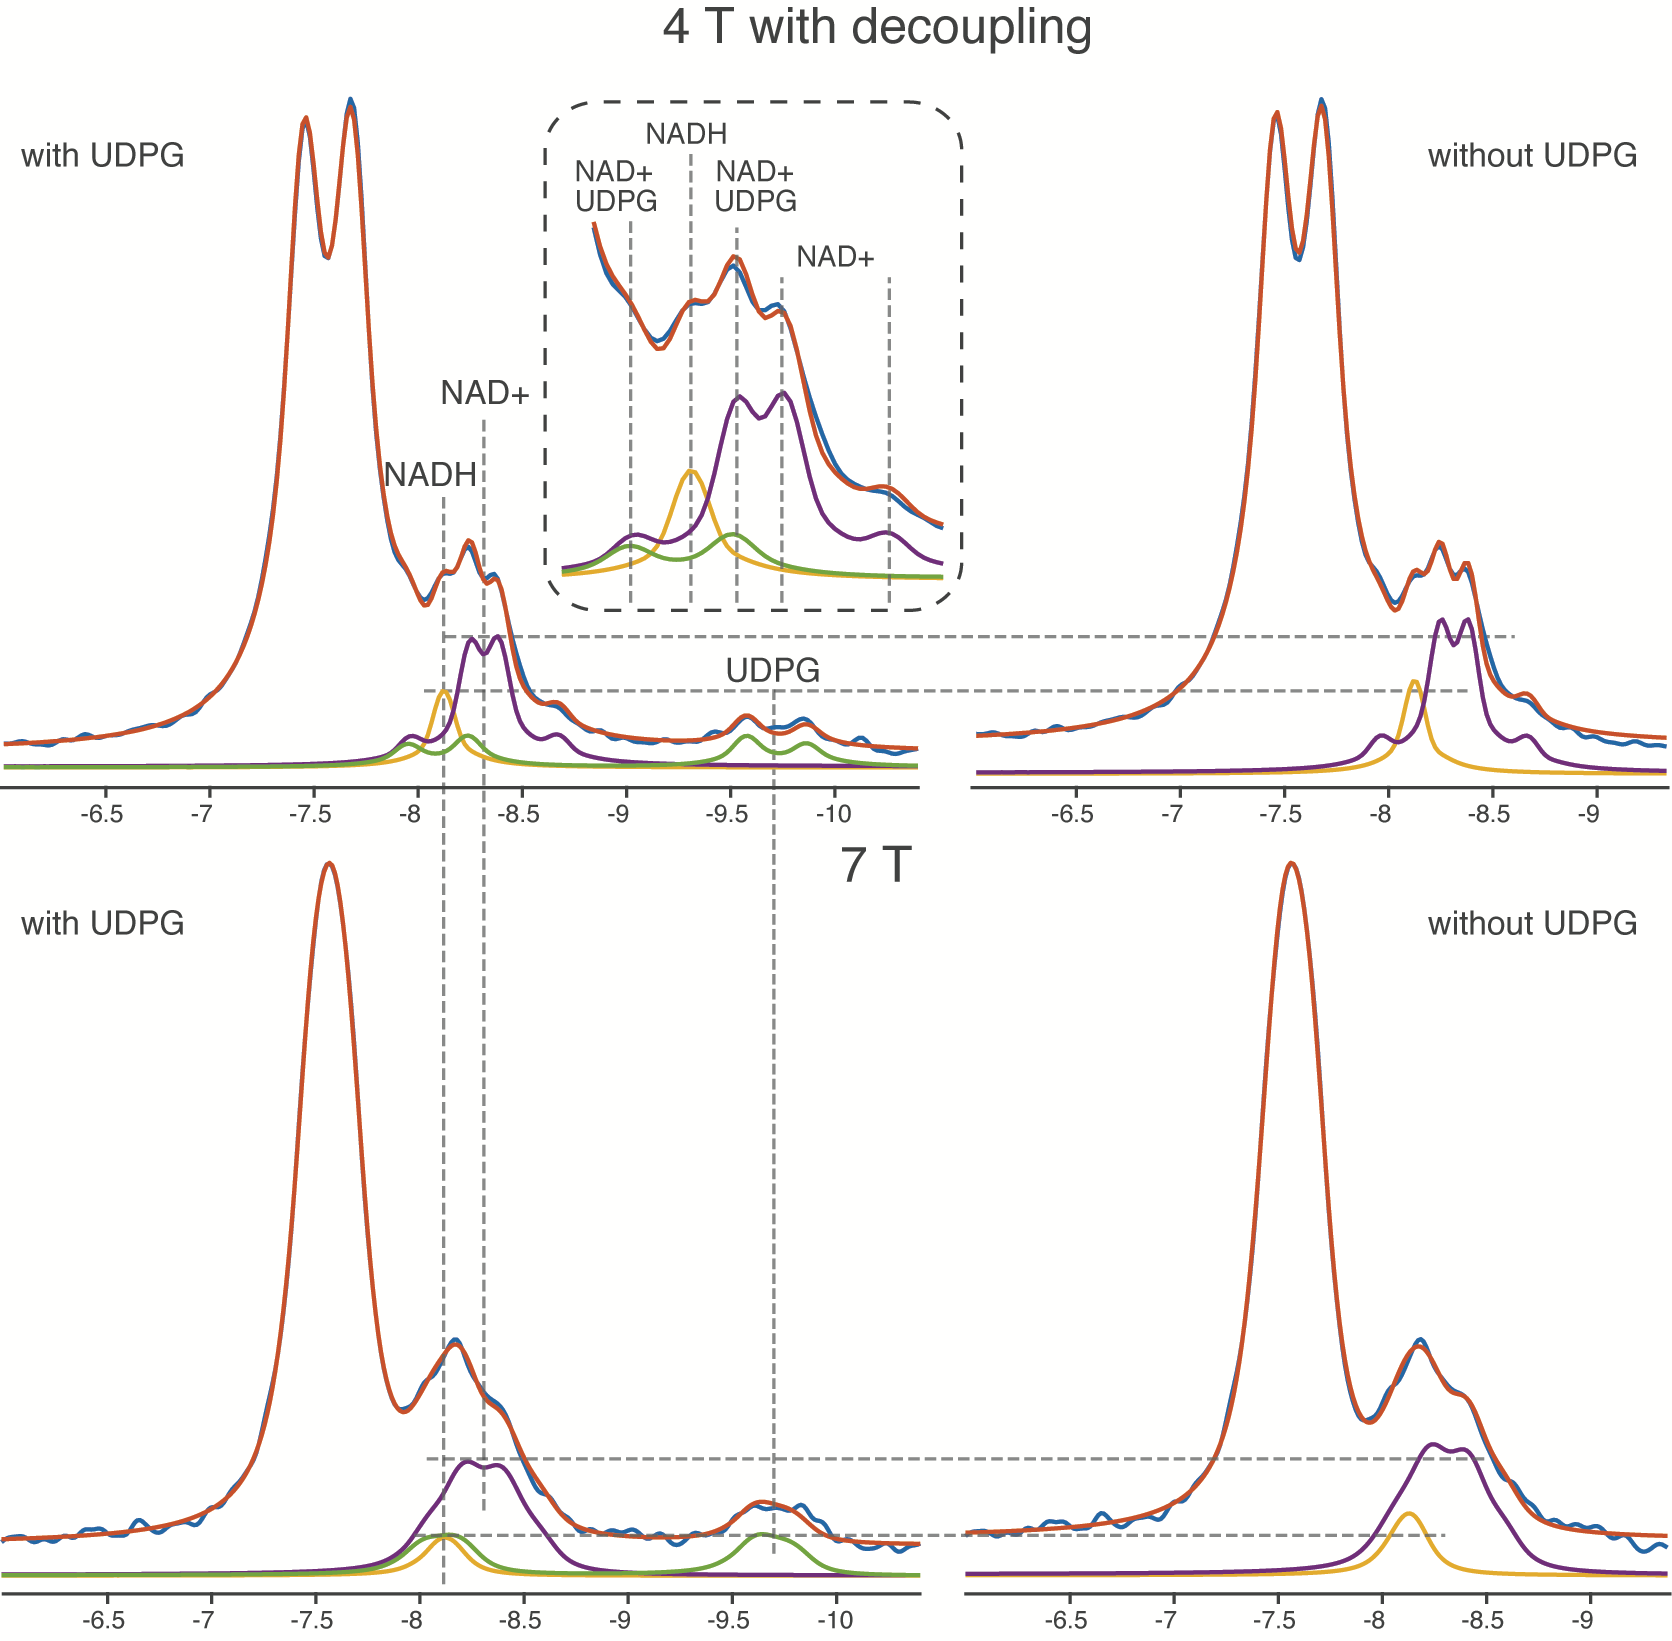
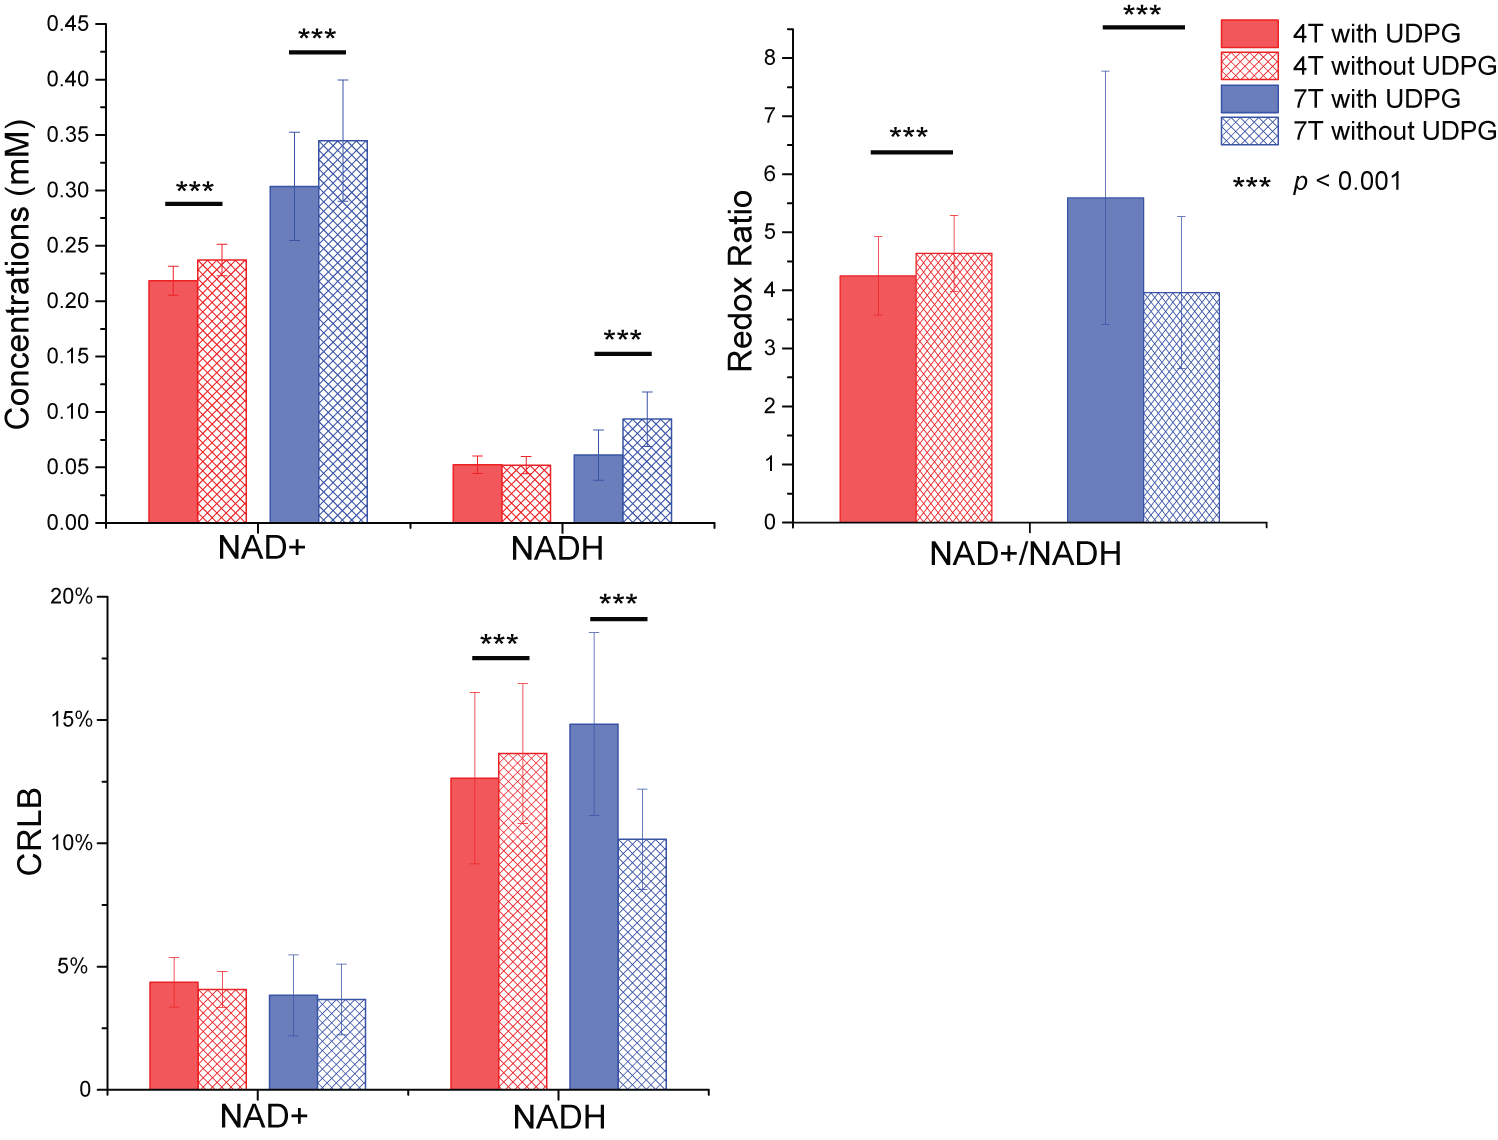
The linewidth of the PCr peak at 4 T and 7 T is 9.5 ± 1.8 Hz and 12.3 ± 2.7 Hz, indicating a good-shimming at both scanners. The summed spectra of 4 T and 7 T amoung subjects were presented in Figure 1, as well as the quantification with and without considering the UDPG signal contribution. Correlation terms were obtained from the LCModel as summarized in Table 2. Figure 2 demonstrated means and standard deviations (SDs) of NAD+ and NADH, the redox ratio and CRLBs. The results with and without including UDPG in the quantification were compared using a paired t-test. NAD+ concentration is modestly reduced at both 4 T (8%) and 7 T (13%) when UDPG is included whereas NADH shows a large reduction but only at 7 T (53%). This pattern results in a slightly lower redox ratio at 4 T but a much higher redox radio at 7 T when UDPG is included in quantification. We also calculated the inter-subject correlations between redox ratio quantified with and without UDPG correction at 4 T and 7 T, respectively. Despite a larger slope at 7 T indicating a significant shift of values, both illustrated very strong correlations with similar adjusted R2 values. At 4 T with 1H decoupling the triplet pattern between -8.0 ~ -8.5 ppm can be well resolved and assigned, and the NADH peak can be better separated from UDPG. With UDPG low field doublets overlapping with NAD+ or NADH, quantification of the redox ratio is affected differently at 4 T and 7 T. At 7 T, UDPG may compromise NADH quantification. Without UDPG included in the quantification, dramatically increased NADH contribution is always estimated to compensate the missing UDPG resonances (Figure 1) and therefore results in a lower redox ratio (Figure 2). On the other hand, NAD+ increases in the quantification not corrected for UDPG while NADH remains unchanged (Figures 1 and 2). This leads to an increased redox ratio quantified without UDPG correction at 4 T (Figure 2).Acknowledgements
This work was partially supported by grants from R01MH114982-01A1(FD), R21MH114020 (FD), R01MH105388 (DO), K24MH104449(DO), U01EB026978 (WC & XHZ). The authors thank Kenroy Cayetano for his assistance in the experiments. The authors report no conflict of interest to disclose.References
1. Imai S, Guarente L. NAD+ and sirtuins in aging and disease. Trends Cell Biol 2014;24(8):464-471.
2. de Graaf RA, De Feyter HM, Brown PB, Nixon TW, Rothman DL, Behar KL. Detection of cerebral NAD(+) in humans at 7T. Magnetic resonance in medicine : official journal of the Society of Magnetic Resonance in Medicine / Society of Magnetic Resonance in Medicine 2017;78(3):828-835.
3. Lu M, Zhu XH, Zhang Y, Chen W. Intracellular redox state revealed by in vivo (31) P MRS measurement of NAD(+) and NADH contents in brains. Magnetic resonance in medicine : official journal of the Society of Magnetic Resonance in Medicine / Society of Magnetic Resonance in Medicine 2014;71(6):1959-1972.
4. Zhu XH, Lu M, Lee BY, Ugurbil K, Chen W. In vivo NAD assay reveals the intracellular NAD contents and redox state in healthy human brain and their age dependences. Proc Natl Acad Sci U S A 2015;112(9):2876-2881.
5. Lu M, Zhu XH, Chen W. In vivo (31) P MRS assessment of intracellular NAD metabolites and NAD(+) /NADH redox state in human brain at 4 T. NMR Biomed 2016;29(7):1010-1017.
6. Kim SY, Cohen BM, Chen X, Lukas SE, Shinn AK, Yuksel AC, Li T, Du F, Ongur D. Redox Dysregulation in Schizophrenia Revealed by in vivo NAD+/NADH Measurement. Schizophr Bull 2016.
7. Xin L, Ipek Ö, Beaumont M, Shevlyakova M, Christinat N, Masoodi M, Greenberg N, Gruetter R, Cuenoud B. Nutritional Ketosis Increases NAD+/NADH Ratio in Healthy Human Brain: An in Vivo Study by 31P-MRS. Frontiers in Nutrition 2018;5.
8. Simpson R, Devenyi GA, Jezzard P, Hennessy TJ, Near J. Advanced processing and simulation of MRS data using the FID appliance (FID-A)-An open source, MATLAB-based toolkit. Magnetic resonance in medicine : official journal of the Society of Magnetic Resonance in Medicine / Society of Magnetic Resonance in Medicine 2017;77(1):23-33.
9. Provencher SW. Estimation of metabolite concentrations from localized in vivo proton NMR spectra. Magnetic resonance in medicine : official journal of the Society of Magnetic Resonance in Medicine / Society of Magnetic Resonance in Medicine 1993;30(6):672-679.
10. Soher BJ, Semanchuk P, Todd S, Steinberg J. VeSPA: integrated applications for RF pulse design, spectral simulation and MRS data analysis. Proc Intl Soc Mag Reson Med 2011;19:1410.
Figures