0471
Correcting motion registration errors caused by global intensity changes during CVR and CBF measurements.1CUBRIC, School of Physics and Astronomy, Cardiff University, Cardiff, United Kingdom, 2CUBRIC, School of Engineering, Cardiff University, Cardiff, United Kingdom
Synopsis
Motion correction is an important preprocessing step in fMRI research1. Motion artefacts not only affect image quality but can lead to erroneous results which are normally corrected using a volume registration algorithm (VRA). Here we demonstrate that when global intensity changes are present in the data (e.g., caused by a CO2 challenge during measurement of cerebrovascular reactivity (CVR) or by ASL tagging), the VRA misinterprets such intensity changes as motion. We compare the motion derived from the VRA with motion parameters derived from an external optical tracking system to determine the extent of the problem.
Purpose
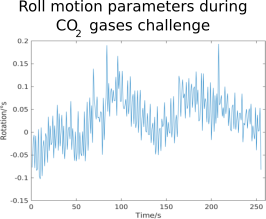
Although motion registration methods are designed to accurately determine motion parameters from the data, in certain circumstances they can also contain a large amount of signal that does not pertain to motion1,2. Figure 1, which shows the ‘roll’ motion parameters derived from ASL data during a CO2 gas challenge, displays a clear ‘tag-control’ pattern and CO2 signal. We propose that the VRA interprets global intensity changes (GIC’s) at edge voxels to be motion and therefore GICs are represented in the motion parameters – thus causing signal loss when motion regressions using these parameters is performed. To investigate the extent of this issue, we compare standard data-derived motion parameters with a separate method that uses an external markerless camera system (TracInnovations, Denmark) to track motion3. As this method is external to the data and any GICs therein, it will not be affected by them. Comparing the two methods will quantify the possible signal loss caused by motion regression.Methods
Image AcquisitionData were collected on a Siemens 3T MAGNETOM Prisma scanner with a 64-channel receiver head coil. Two scanning sessions were arranged per participant. The first would use physiological challenges to induce GIC’s while the second would act as a control with resting state scans only. The scanning protocol was: Multi-TI pCASL (TR1,2=5.6/3.1s, TE=11ms, TI=250/500/750/1000/1250/1500/1750/2000/2250/2500/2750/3000ms, α=90°, In-plane=3.4mm2, 20 slices(6mm)), Dual-excitation pCASL (TR=1.1/3.8s, TE=11/30ms, α=90°, In-plane=3.4mm2, 19 slices(6mm)), Breath Hold (TR=2s,TE=30ms, α=70°,In-plane=2mm2,64 slices(2mm)), TR=2s,TE=30ms, In-plane=2mm2, 64 slices(2mm)).
Camera Motion collection
The marker-less camera (TCL camera) acquired motion data throughout the scan by using infra-red light to create a ‘mesh’ on the face to track motion. This data was calibrated to the scanner coordinates using an MPRAGE to create final motion parameters.
Data Analysis
Estimates of motion were calculated in two separate methods. Motion parameters were calculated from the Imaging data using AFNI’s 3dvolreg algorithm (AFNI method) while data from the camera provided independent motion traces (TCL method). For each scan, the global signal was calculated from the raw data using AFNI’s 3dmaskave. Two separate linear regressions were performed on the global signal. The first using the 6 AFNI motion estimates as regressors and the second using the 6 TCL motion estimates. R2 values showing the variance explained in the global signal by each of the respective methods were calculated. Paired t-tests were performed on the R2 values to determine statistical differences between the variance explained by each method. CVR values were calculated from the breath hold data, using the percentage global signal per subject with no motion regression, with AFNI motion regression and with TCL motion regression.
Results
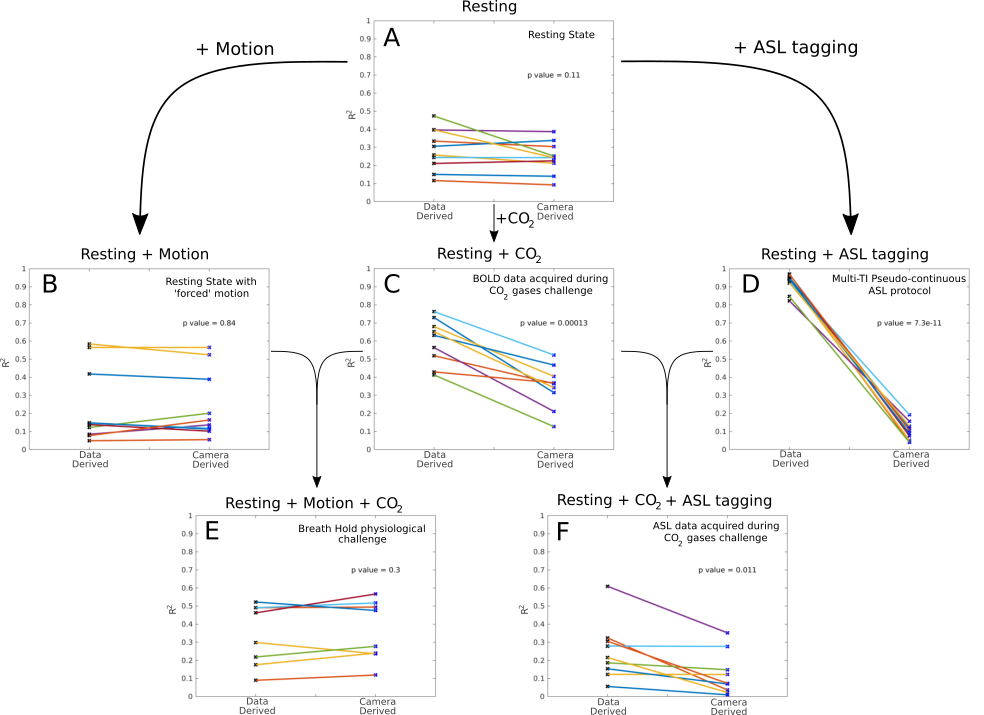
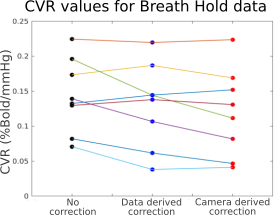
Fig. 2 demonstrates the difference in R2 values with each of the different scans conducted in this study. Motion parameters derived from the data (AFNI method) explain more variance in the global signal than the camera derived parameters (TCL method). This demonstrates that GICs caused by the CO2 challenge or by ASL tagging are interpreted as motion by the VRA. This is most obvious in Fig. 2 D which shows the multi-TI ASL protocol, where the variance explained by the data derived motion parameters is far greater than the “true” motion as measured with the camera (p=7.3x10⁻⁶). Both BOLD and ASL data during gas challenges show similar significant differences in variance explained (0.00013 and 0.011 respectively). In contrast, when there are no imposed GICs in the data, e.g. during a rest scan (Fig 2A) or during a rest scan with large motion (Fig 2B), data derived motion parameters explain similar amounts of variance to camera derived motion parameters. Breath-hold data is a special case (Fig 2E) since GICs caused by the increase in CO2 during the breath-hold are time locked to motion caused by the BH-task itself. Disentangling both to derive a trustworthy CVR measure is difficult as shown in Fig 3 where CVR estimates remain the same, independent of the motion regression approach and whether motion regression is applied at all.Discussion
Motion during functional imaging studies can lead to erroneous results if not dealt with correctly. Standard motion correction algorithms derive motion parameters from the data itself which are used to realign individual volumes and then to regress any related variance from the time series. Here, we demonstrate that although this might work well in a lot of cases, when global intensity changes are an integral part of the experiment, this approach is prone to errors. This is not only particularly problematic for studies investigating CVR and CMRO2 using gas challenges but also for more standard ASL experiments where the tag/control intensity changes manifest themselves in the motion parameters. Although the external camera approach to measuring motion could be seen as a gold-standard, this solution is not available widely. Furthermore, difficulties in using cameras or other tracking devices arise in the gas challenge experiments that need them the most due to the gas mask and other gas delivery equipment interfering with line-of-sight in the cramped bore/coil conditions. This motivates the need to re-examine the derivation of motion parameters from data to come up with alternative approaches in the context of global signal intensity changes.Acknowledgements
No acknowledgement found.References
1. Power, J., et al. NeuroImage.Recent progress and outstanding issues in motion correction in resting state fMRI. NeuroImage, 2015. Vol.105, p.536-551
2. Oakes TR., et al. Comparison of fMRI motion correction software tools. NeuroImage, 2005. Vol.28(3), p.529-543
3. Frost, R., et al. Markerless high‐frequency prospective motion correction for neuroanatomical MRI. Magnetic Resonance in Medicine, 2019. Vol.82(1), p.126-144
Figures