0449
Comparison of 3D Stack-of-Spirals and 2D Gradient Echo for Ventilation Mapping using Hyperpolarized 129Xe1Translational Medicine, The Hospital for Sick Children, Toronto, ON, Canada, 2Medical Biophysics, University of Toronto, Toronto, ON, Canada
Synopsis
Hyperpolarized 129Xe MRI is an emergent tool for the quantification of ventilation defects in the lungs. 129Xe is typically imaged with 2D gradient recalled echo (2D-GRE) which may require lengthy breath-holds (up to 16s) to image the lung. This may be problematic in subjects who are not able to comply with these breath-hold constraints. Non-Cartesian spiral imaging samples k-space more efficiently, reducing the acquisition duration. In this work a 3D stack-of-spirals (3D-SoS) imaging sequence was developed and tested in healthy adults alongside conventional 2D-GRE for hyperpolarized 129Xe ventilation mapping, showing equivalent ventilation defect percent quantification in a ~2 s scan.
Introduction
MRI with hyperpolarized (HP) 129Xe gas is a promising approach for imaging lung diseases such as asthma, cystic fibrosis, and COPD among others1–4. The spatial distribution of inhaled xenon gas in the airspaces is typically evaluated with slice-selective 2D gradient recalled echo (2D-GRE) imaging and compared to 1H thoracic cavity scans, yielding measures of ventilation defect percent (VDP). Though widely available and straight forward to implement, 2D-GRE imaging typically requires long breath-hold durations (up to 16s) due to the Cartesian nature of k-space acquisition. Such long breath holds can be difficult for subjects to perform, especially for very sick and/or younger patients. Non-Cartesian methods such as spirals acquire k-space data more efficiently, reducing overall scan duration5. More recently, these have allowed for dynamic 129Xe ventilation acquisitions6,7 or 3D isotropic imaging8. Nevertheless, these methods generally remain under-utilized for this application. In this work, HP 129Xe ventilation mapping is performed in healthy volunteers using a 3D stack-of-spirals (3D-SoS) acquisition and compared to a conventional 2D-GRE approach. The ventilation maps are compared on the basis of SNR and VDP. The effect of shortening the 3D-SoS readout duration is also investigated.Methods
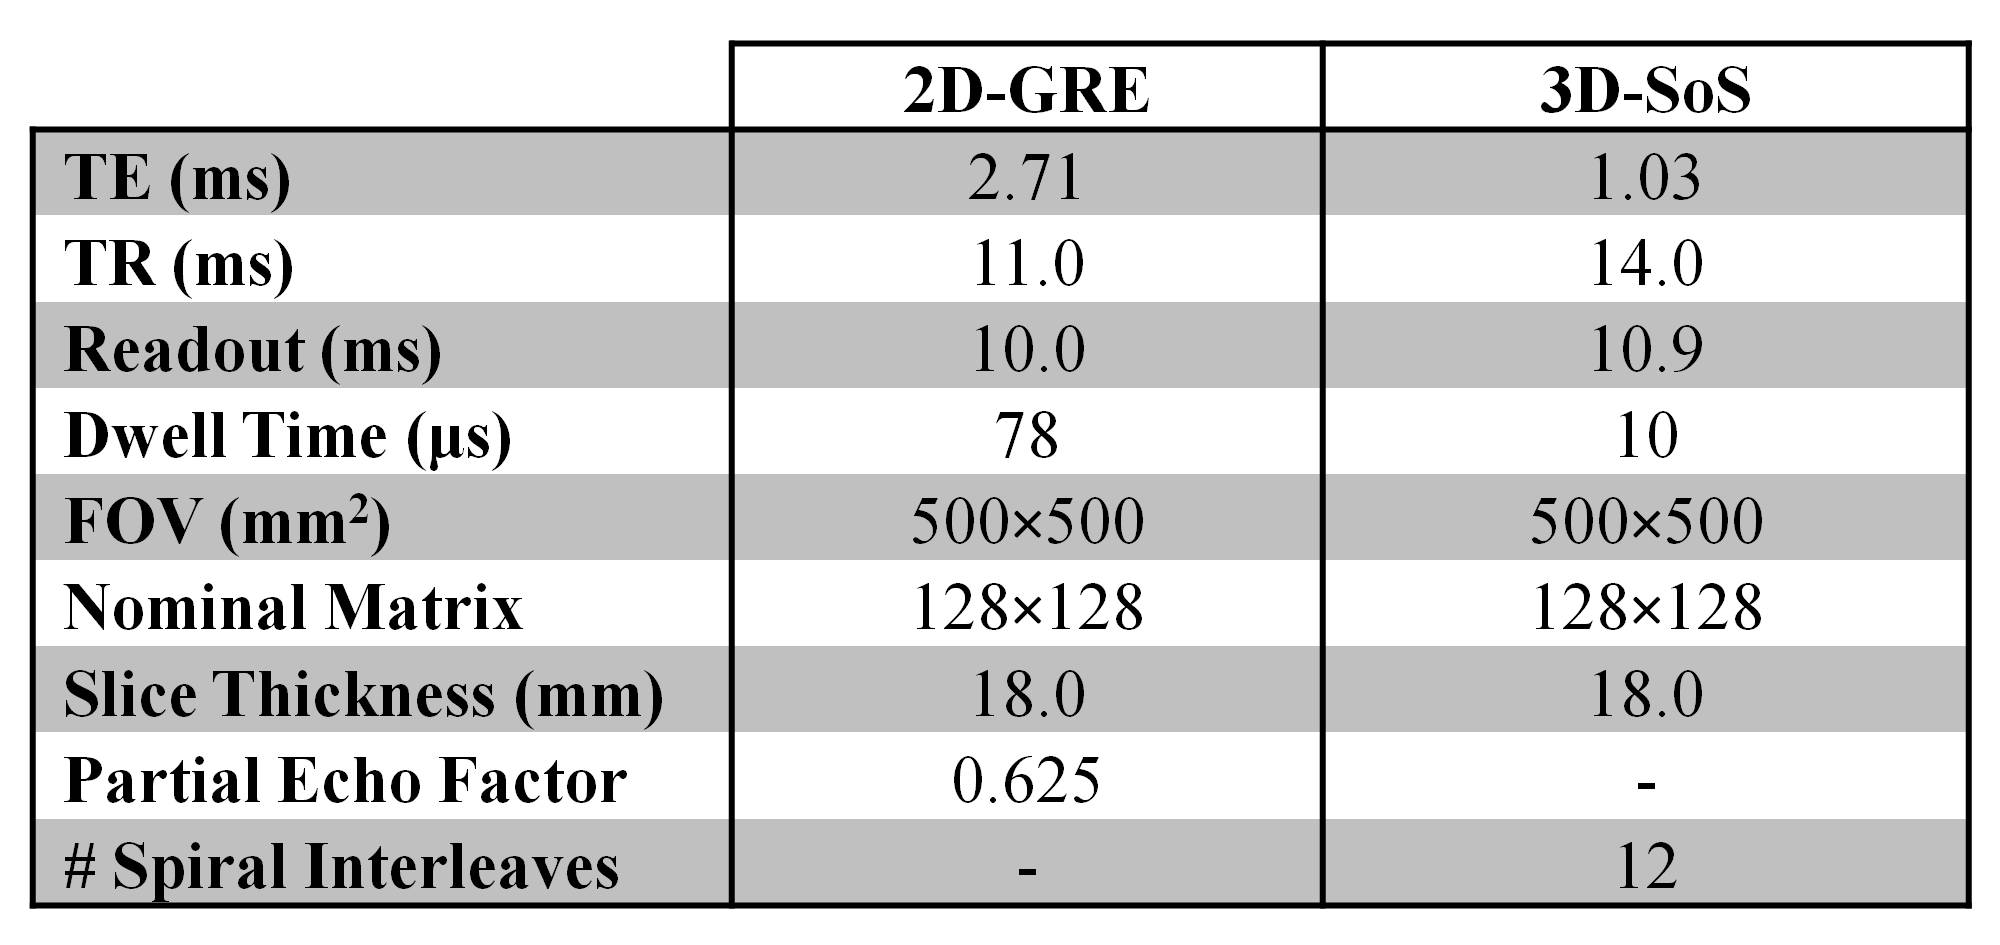
Four healthy participants (2 males, 2 females, mean age=27±5 years) were imaged in accordance with institutional ethics approval at The Hospital for Sick Children. Imaging was performed on a clinical 3T system (Magnetom Prisma, Siemens Healthcare, Erlangen, Germany) with a flexible transmit/receive 129Xe chest coil (Clinical MR Solutions, Brookfield, WI). 2D-GRE and 3D-SoS images were acquired with equivalent in-plane spatial resolutions (3.9×3.9mm2), slice thickness (18.0mm), and number of slices (8-10 depending on participant). Despite equivalent resolutions, 3D-SoS scan duration was approximately 6-7 times faster (from 12-14s for 2D-GRE to ~2s for 3D-SoS, depending on slice coverage). Sequence parameters are shown in Table 1. Additionally, a 3D-SoS acquisition with a shortened readout was performed in one subject. Isotopically enriched 129Xe was polarized to 28±9% using commercial polarizers (Models 9810 or 9820, Polarean, Durham, NC). Images were reconstructed in MATLAB (MathWorks, Natick, MA). 3D-SoS images were reconstructed using a non-uniform FFT9. A 9×9 pixel ROI assessed mean signal in the right-medial portion of the lung in a slice approximately halfway through the thorax in the anterior-posterior direction. An equal sized ROI measured the standard deviation of background noise in the same slice. SNR was calculated and scaled by polarization at the time of imaging. VDP was calculated as previously described10,11.Results
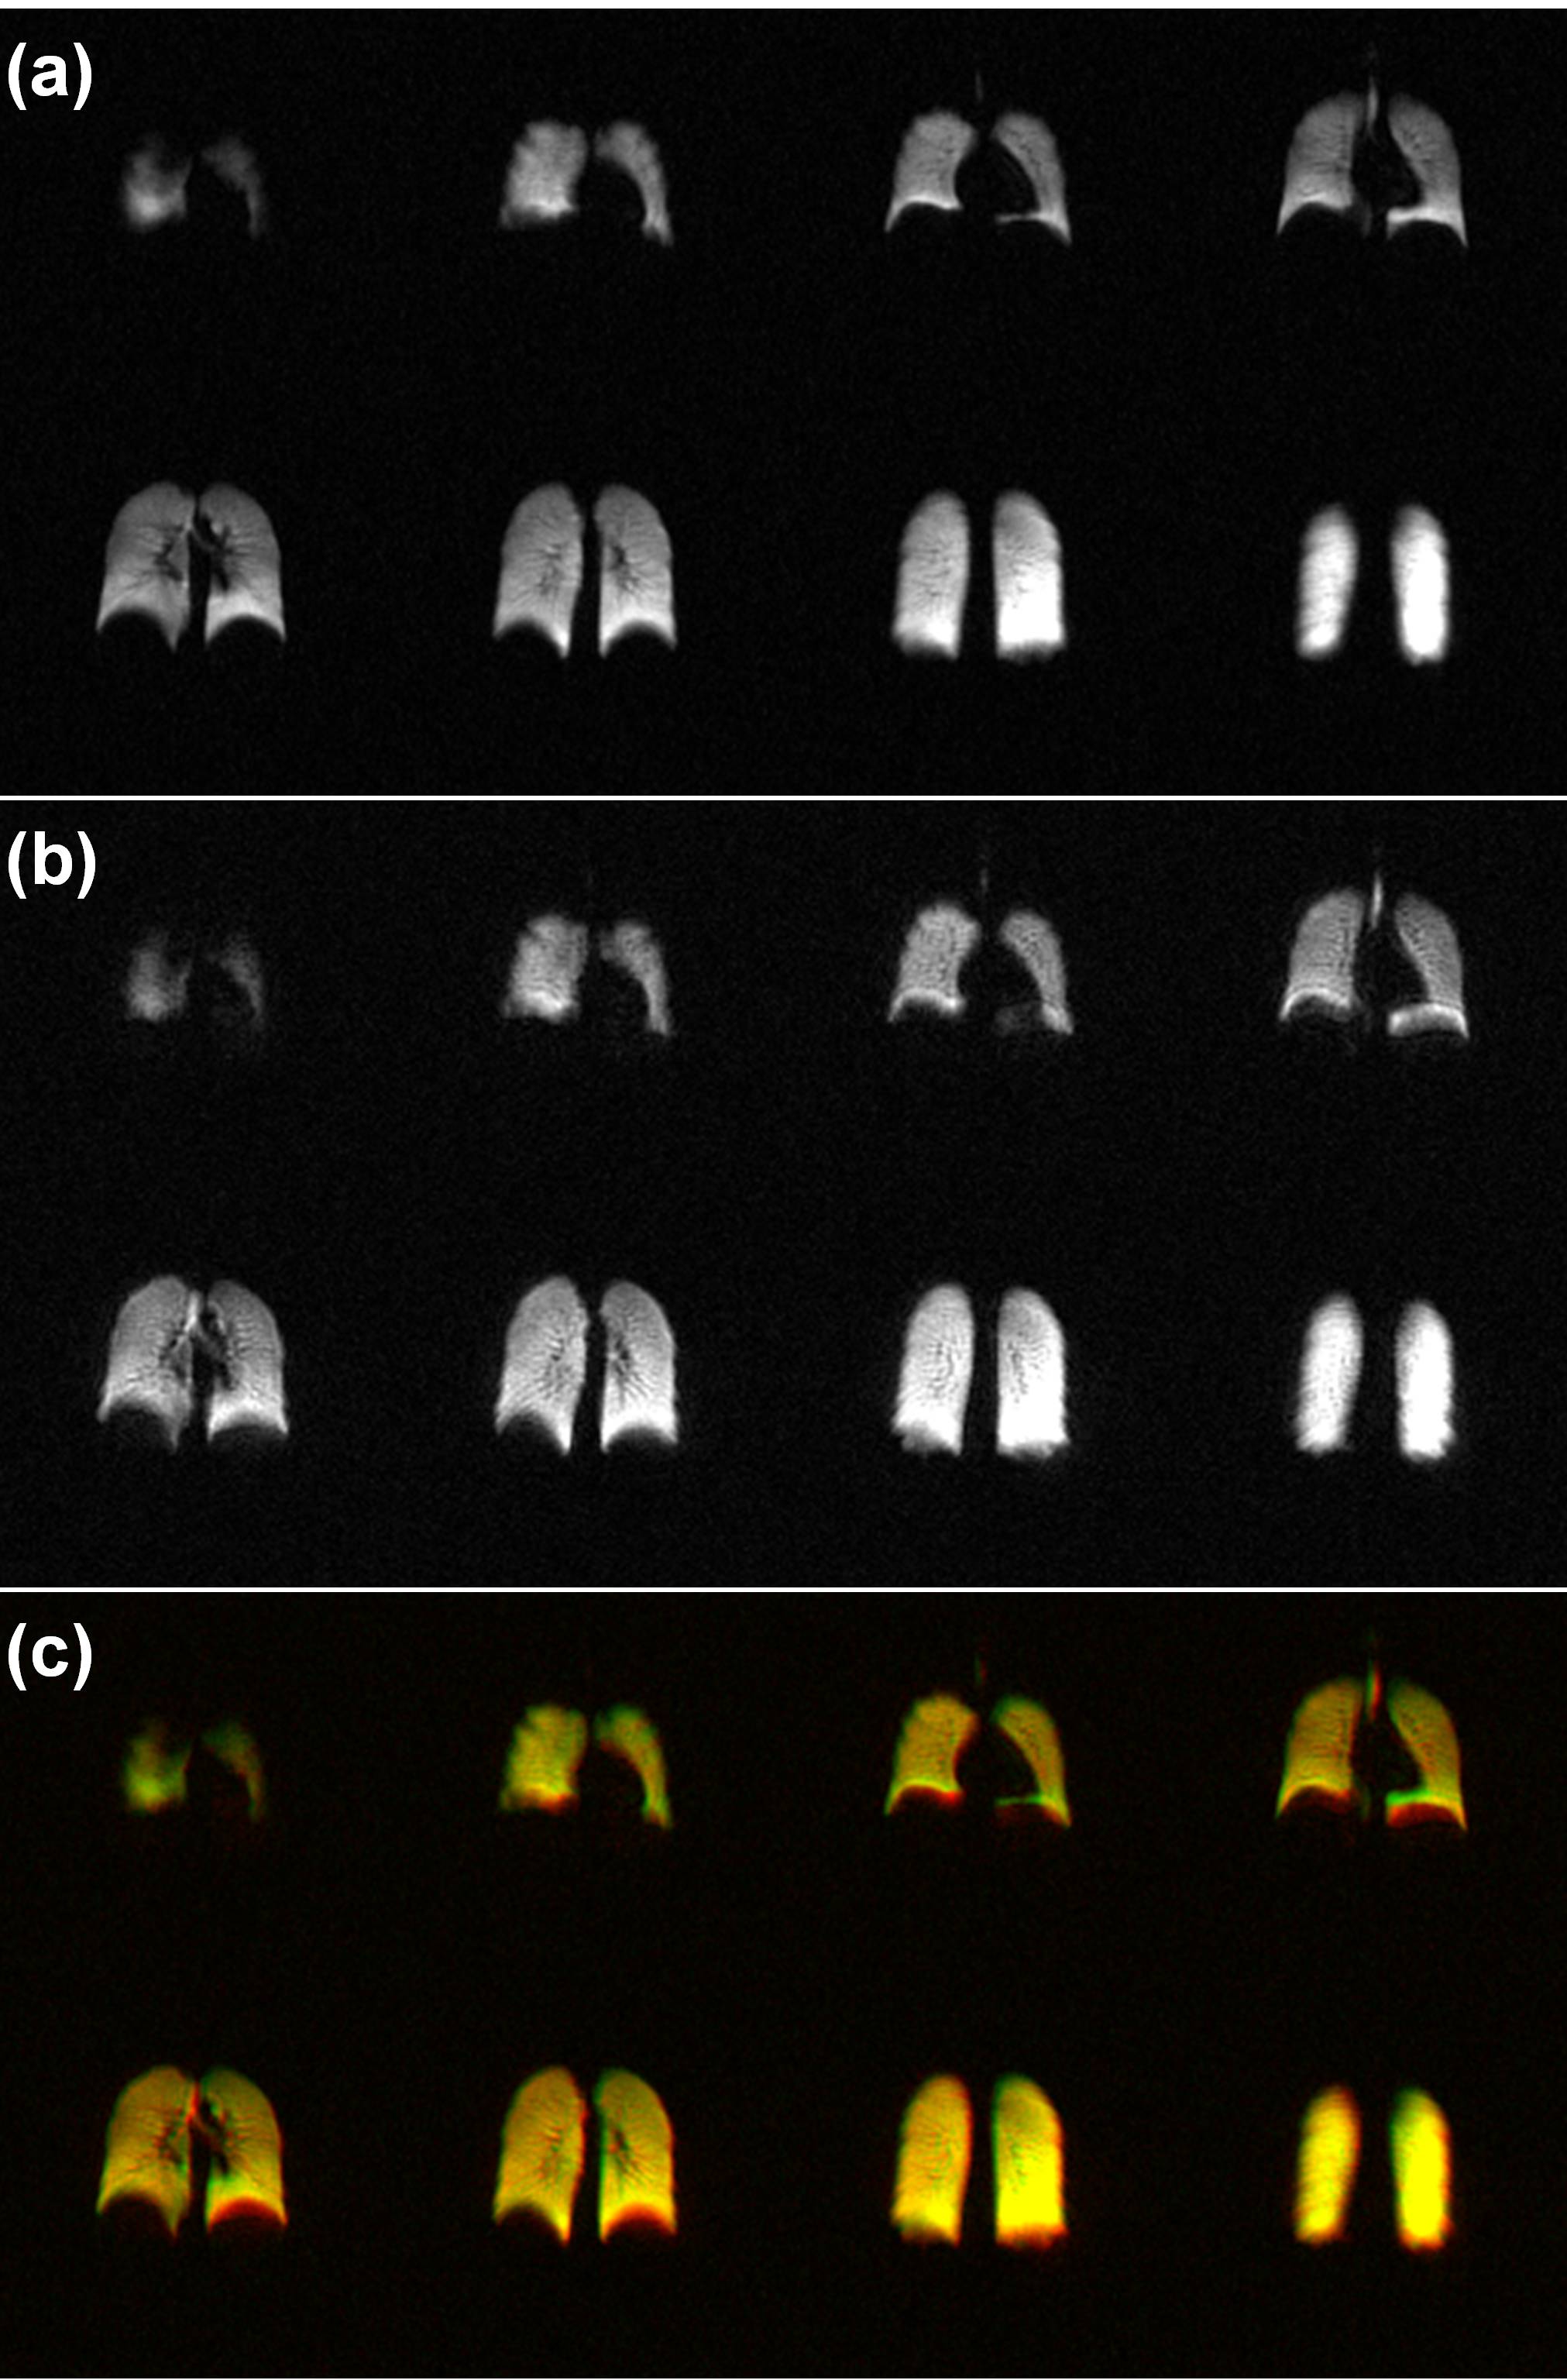
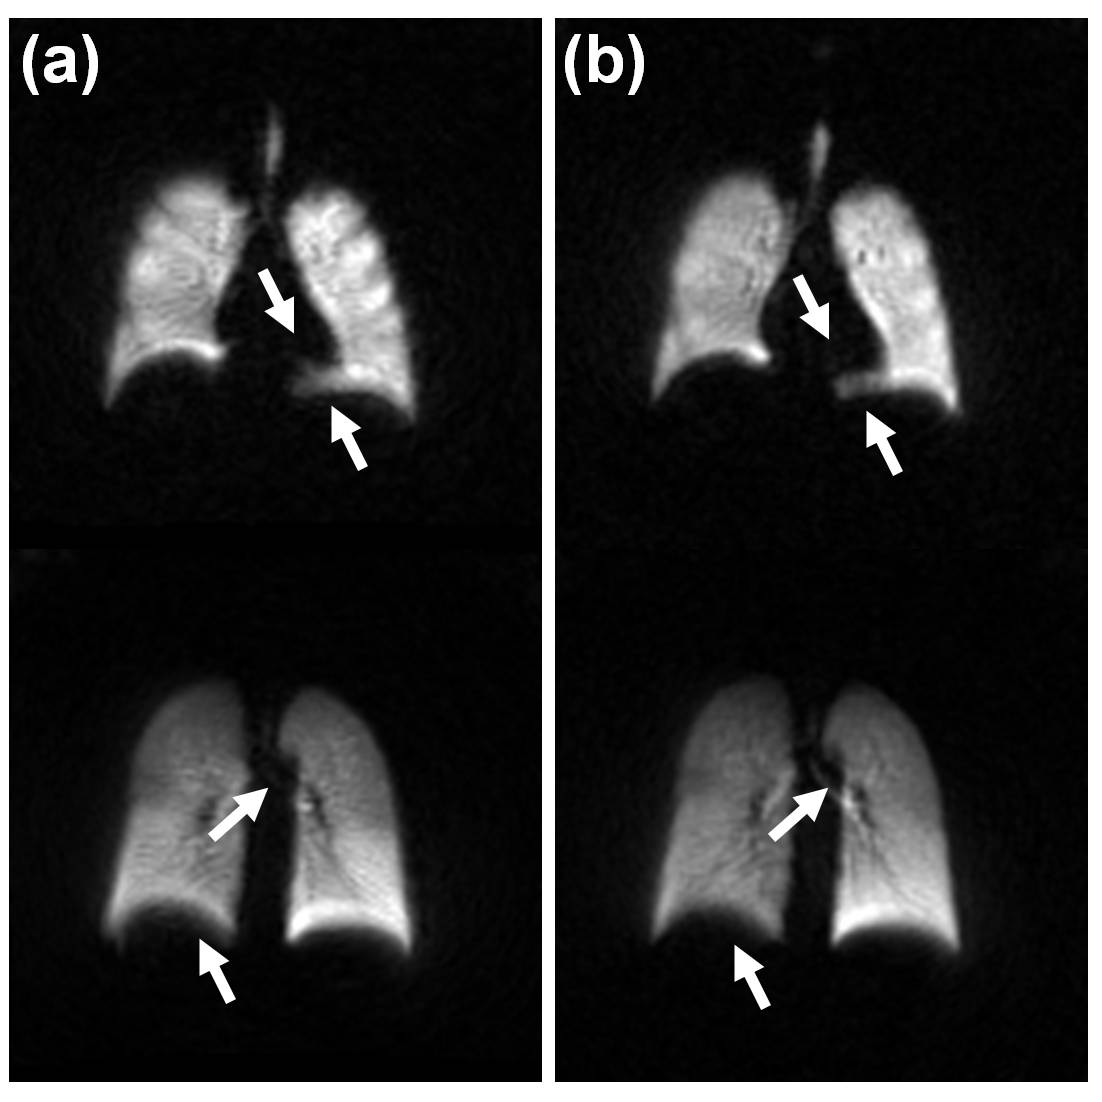
Figures 1a and 1b shows 129Xe ventilation maps acquired with 2D-GRE and 3D-SoS in a representative subject respectively. 3D-SoS maps had image quality comparable to 2D-GRE shown by the composite images in Figure 1c. 3D-SoS demonstrated slight blurring near the lung boundaries, presumably due to the relatively long readout window and/or presence of off-resonance effects. However, it is shown that this blurring can be reduced with the use of a shortened readout duration (Figure 2). Scaled SNR was measured to be slightly higher in the case of 2D-GRE compared to 3D-SoS (52±14 and 32±9 respectively). Nevertheless, VDP values measured across all subjects with 2D-GRE and 3D-SoS were very similar (0.06±0.02% and 0.03±0.01% respectively) with no significant difference between VDP distributions acquired with either approach (P>0.05, paired t-test), consistent with lack of any pulmonary disease in these healthy subjects.Discussion
In this work, a 3D-SoS k-space acquisition is applied to 129Xe ventilation mapping in a group of healthy adult participants, yielding image quality and VDP accuracy comparable to a conventional 2D-GRE. 3D-SoS SNR was slightly lower than 2D-GRE, predominantly driven by increased background noise. This may be improved in future through optimizations of the non-Cartesian reconstruction or filtering in k-space (e.g. Hamming, Fermi) which was not done in this study. Furthermore, the 2D-GRE images were reconstructed with zero-padding during Fourier transformation (due to partial echo undersampling) to match matrix sizes. This may have the effect of artificially suppressing background noise and should be accounted for in the future. Despite this, VDP values measured between approaches were not significantly different confirming that 3D-SoS provides similar ventilation information without introducing additional artifacts compared to 2D-GRE in this participant subset. The small VDP variations between approaches, though not statistically significant, may be caused by differences in image quality as described above or inherent misregistrations between the approaches, since each used a separate breath-hold. The main advantage of 3D-SoS was that data was acquired 6-7 times faster than 2D-GRE. This has potential for applications in subjects who normally would be unable to perform lengthy xenon MRI breath-holds. Furthermore, the reduction in scan time has the potential to be traded for higher spatial resolution, dynamic acquisitions with high temporal resolution, or wash-in/out ventilation data in a multi-breath fashion, that may otherwise be difficult to achieve with 2D-GRE. Further reductions in acquisition duration may be achievable with accelerated imaging techniques such as parallel imaging and compressed sensing12. Future work will involve optimizing the spiral acquisition/reconstruction to further improve image quality, as well as testing in patient populations to confirm quantification of VDP is in agreement with 2D-GRE.Conclusion
3D Stack-of-spirals imaging provides acquisition of accurate hyperpolarized 129Xe ventilation images comparable to 2D-GRE in approximately 1/7 the total scan time, enabling shortened breath-hold durations.Acknowledgements
The authors thank Dr. Marcus Couch, Elaine Stirrat, Daniel Li, Krzysztof Kowalik, Ruth Weiss, and Tammy Rayner for assistance with imaging experiments. The authors acknowledge the Ontario Research Fund (ORF), Canadian Institute of Health Research (CIHR), and Natural Sciences and Engineering Research Council of Canada (NSERC) as sources of funding.References
1. S.B. Fain, F.R. Korosec, J.H. Holmes, R. O’Halloran, R.L. Sorkness, and T.M. Grist, “Functional lung imaging using hyperpolarized gas MRI.,” J. Magn. Reson. Imaging 25(5), 910–23 (2007).
2. J.P. Mugler III and T.A. Altes, “Hyperpolarized 129Xe MRI of the human lung.,” J. Magn. Reson. Imaging 37(2), 313–31 (2013).
3. S.J. Kruger, S.K. Nagle, M.J. Couch, Y. Ohno, M. Albert, and S.B. Fain, “Functional imaging of the lungs with gas agents,” J. Magn. Reson. Imaging 43(2), 295–315 (2016).
4. L. Ebner, J. Kammerman, B. Driehuys, M.L. Schiebler, R. V. Cadman, and S.B. Fain, “The role of hyperpolarized 129xenon in MR imaging of pulmonary function,” Eur. J. Radiol. 86, 343–352 (2017).
5. M. Salerno, T.A. Altes, J.R. Brookeman, E.E. De Lange, and J.P. Mugler, “Dynamic spiral MRI of pulmonary gas flow using hyperpolarized 3HE: Preliminary studies in healthy and diseased lungs,” Magn. Reson. Med. 46(4), 667–677 (2001).
6. O. Doganay, T.N. Matin, A. Mcintyre, et al., “Fast dynamic ventilation MRI of hyperpolarized 129 Xe using spiral imaging,” Magn. Reson. Med. 79(5), 2597–2606 (2018).
7. M. Chen, O. Doganay, T. Matin, et al., “Delayed ventilation assessment using fast dynamic hyperpolarised Xenon-129 magnetic resonance imaging,” Eur. Radiol. E-Pub ahead of print (2019).
8. M.M. Willmering, P. Niedbalski, H. Wang, et al., “Improved Pulmonary 129Xe Ventilation Imaging via 3D-Spiral UTE MRI,” Proc. Intl. Soc. Mag. Reson. Med. 27, 0008 (2019).
9. J.A. Fessler, S. Member, and B.P. Sutton, “Nonuniform Fast Fourier Transforms Using Min-Max Interpolation,” IEEE Trans Signal Process. 51(2), 560–574 (2003).
10. M. Kirby, M. Heydarian, S. Svenningsen, et al., “Hyperpolarized 3He Magnetic Resonance Functional Imaging Semiautomated Segmentation,” Acad. Radiol. 19(2), 141–152 (2012).
11. G. Santyr, N. Kanhere, F. Morgado, J.H. Rayment, F. Ratjen, and M.J. Couch, “Hyperpolarized Gas Magnetic Resonance Imaging of Pediatric Cystic Fibrosis Lung Disease,” Acad. Radiol. 26(3), 344–354 (2019).
12. G.J. Collier, P.J. Hughes, F.C. Horn, et al., “Single breath-held acquisition of coregistered 3D 129 Xe lung ventilation and anatomical proton images of the human lung with compressed sensing,” Magn. Reson. Med. 82(1), 342–347 (2019).
Figures