0448
Dual Center and Dual Vendor feasibility of perfusion-weighted phase resolved functional lung (PREFUL) MRI in CF patients
Lea Behrendt1,2, Andreas Voskrebenzev1,2, Cristian Crisosto Gonzalez1,2, Marcel Gutberlet1,2, Helen Marshall3, Anna-Maria Dittrich4, Laurie Smith3, Paul Hughes3, Jim Wild3, and Jens Vogel-Claussen1,2
1Institute of Diagnostic and Interventional Radiology, Hannover Medical School, Hannover, Germany, 2Biomedical Research in Endstage and Obstructive Lung Disease Hannover (BREATH), German Center for Lung Research (DZL), Hannover, Germany, 3University of Sheffield, Sheffield, United Kingdom, 4Paediatric Pneumology and Neonatology, Hannover Medical School, Hannover, Germany
1Institute of Diagnostic and Interventional Radiology, Hannover Medical School, Hannover, Germany, 2Biomedical Research in Endstage and Obstructive Lung Disease Hannover (BREATH), German Center for Lung Research (DZL), Hannover, Germany, 3University of Sheffield, Sheffield, United Kingdom, 4Paediatric Pneumology and Neonatology, Hannover Medical School, Hannover, Germany
Synopsis
Dynamic contrast enhanced (DCE) MRI is an established technique for measurement of lung perfusion, but requires the administration of contrast agents and a breath hold. Thus, methods for contrast agent free assessment of lung perfusion in free breathing, like phase resolved functional lung (PREFUL) MRI, are desirable. Therefore, in this dual center and dual vendor feasibility study, we validated PREFUL MRI against DCE MRI in patients with CF. Perfusion defect percentage (QDP) maps of both methods were calculated, showing an overlap of 61% for the whole lung. Further, a strong correlation between QDPPREFUL and QDPDCE was found (r=0.70, p=0.005).
Introduction
Dynamic contrast enhanced (DCE) MRI is an established technique for assessment of lung perfusion1,2, but requires the administration of gadolinium-based intravenous contrast agents. These are reported to cause side effects like nephrogenic systemic sclerosis in patients with renal failure3. Furthermore, a breath-hold is required for DCE data acquisition. Therefore, validation of free-breathing contrast agent free 1H MRI postprocessing techniques like phase resolved functional lung (PREFUL) MRI4 is desirable. PREFUL MRI is based on the reconstruction of one respiratory and cardiac cycle to gain dynamic ventilation and perfusion information from one data set. A previous study already validated PREFUL MRI with DCE MRI in patients with chronic obstructive pulmonary disease (COPD)5. However, no feasibility study of PREFUL MRI across different centers was conducted. Therefore, we validated PREFUL MRI against DCE MRI in patients with cystic fibrosis (CF) in a dual center study using scanners from two different vendors.Method
14 CF patients were included in this study (Center 1: 9 patients, Center 2: 5 patients). All patients underwent PREFUL and DCE MRI in the same imaging session.Center 1: Data acquisition was performed on a 1.5T scanner (Siemens Avanto, Siemens Healthcare, Erlangen, Germany) using a spoiled gradient echo sequence (Field of view (FoV) = 500 x 500mm2, matrix size = 128 x 128 (interpolated to 256 x 256), TE = 0.82ms – 0.88ms, TR = 3, flip angle 3°, temporal resolution 192ms, slice thickness 15mm) for PREFUL MRI and a 3D time-resolved angiography with stochastic trajectories (TWIST) sequence (FoV = 450 x 366mm2, matrix size 256 x 146, TE = 0.80ms – 0.86ms, TR = 2.37ms – 2.47ms, temporal resolution 1.1s – 1.3s, slice thickness 5mm) for DCE MRI.
Center 2: Data was acquired on a 1.5T scanner (Signa HDxt, GE Healthcare, Milwaukee, WI) using a spoiled gradient echo sequence (FoV = 480 x 480mm2, matrix size = 128 x 128 (interpolated to 256 x 256), TE = 0.8ms, TR = 2.5ms, flip angle 4°, temporal resolution 374ms, slice thickness 15mm) for PREFUL MRI and a 3D gradient echo sequence with view sharing (TRICKS) and parallel imaging (R=2) (FoV = 480 x 480mm2, matrix size 120 x 80, TE = 0.69ms, TR = 2.1ms, temporal resolution 0.6s, slice thickness 10mm) for DCE MRI.
For PREFUL MRI four coronal slices, (two posterior slices, one tracheal slice centered at the aortic arch, one anterior slice) were acquired. Due to thinner slice thickness of DCE MRI compared to PREFUL MRI, compound DCE slices were calculated. PREFUL images were registered to DCE images. For further analysis, a perfusion-weighted PREFUL phase of the reconstructed PREFUL cardiac cycle and a corresponding perfusion-weighted DCE phase of the contrast agent pass of the DCE data set was selected. Then, perfusion defect percentage (QDP) maps for every slice and the whole lung were calculated using an individual threshold for each slice as previously descibed5. Values below this threshold were identified as perfusion defect. To assess the agreement between QDP-maps, the Dice coefficients of the defect and healthy regions were calculated on a voxel by voxel level. Furthermore, the spatial overlap between PREFUL and DCE QDP maps (i.e. percentage of voxels labeled as perfusion defect or healthy tissue with both methods) was computed and compared using a paired two-sided Wilcoxon test. The agreement of QDP was further assessed by Bland Altman analysis and Pearson correlation.
Results
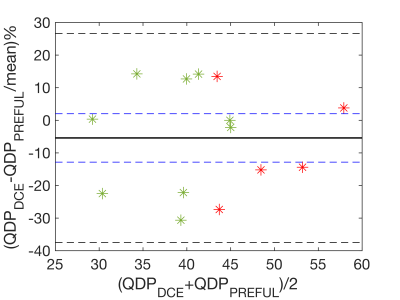
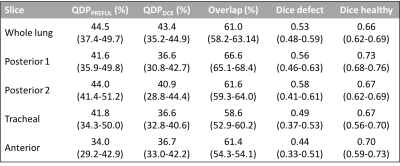
Figure 1 shows representative perfusion-weighted PREFUL and DCE maps for both centers, the corresponding QDP-maps and maps illustrating the spatial overlap of the QDP-maps, with good visual agreement. In Table 1 QDPPREFUL and QDPDCE are compared for all slices. A median spatial overlap of 61% was found for the whole lung. Using Pearson correlation, a correlation coefficient of r = 0.70 (p = 0.005) was obtained between QDPPREFUL and QDPDCE for the whole lung. Bland Altman analysis for the whole lung is shown in Figure 2 (mean difference -5.4%, 95% confidence interval of mean difference [-12.8%-2.0%], mean difference ± 1.96*standard deviation [-37.5%-26.7%]).Discussion
In accordance with a recent study5, good spatial agreement was found comparing QDP-maps. Minor differences between QDPDCE and QDPPREFUL could be explained by the lower resolution of PREFUL compared to DCE causing widening and blurring of vessels, which may contribute to imprecise estimation of perfused areas. In addition, the threshold used to calculate QDP-maps impacts the QDP values. Further, in this study data acquisition was performed with different temporal and spatial resolution across centers and imaging methods. Therefore, depending on the resolution, widening and blurring of vessels as well as partial volume effects are differently pronounced, affecting the calculated QDP-maps.Conclusion
In this dual center study feasibility of PREFUL MRI was shown and validated with DCE MRI using scanners from two different vendors. This is an important step towards clinical implementation of PREFUL MRI.Acknowledgements
No acknowledgement found.References
- Ingrisch M, Dietrich O, Attenberger UI, et al. Quantitative pulmonary perfusion magnetic resonance imaging: influence of temporal resolution and signal-to-noise ratio. Invest Radiol 2010;45:7-14.
- Kaireit T, Sorrentino SA, Renne J, et al. Functional lung MRI for regional monitoring of patients with cystic fibrosis. PLoS One 2017;12: e0187483
- Kanda T, Ishii K, Kawaguchi H, Kitajima K, Takenaka D. High signal intensity in the dentate nucleus and globus pallidus on unenhanced T1-weighted MR images: relationship with increasing cumulative dose of a gadolinium-based contrast material. Radiology 2014;270:834-841.
- Voskrebenzev A, Gutberlet M, Klimeš F, et al. Feasibility of quantitative regional ventilation and perfusion mapping with phase-resolved functional lung (PREFUL) MRI in healthy volunteers and COPD, CTEPH, and CF patients. Magn Reson Med 2018;79:2306-2314.
- Kaireit TF, Voskrebenzev A, Gutberlet M, et al. Comparison of quantitative regional perfusion-weighted phase resolved functional lung (PREFUL) MRI with dynamic gadolinium-enhanced regional pulmonary perfusion MRI in COPD patients. J Magn Reson Imaging 2019;49:1122-1132.
Figures

Figure 1: Perfusion-weighted DCE and PREFUL maps, corresponding
perfusion defect (QDP) maps and comparison of match/mismatch of the QDP-maps of
both methods for Center 1 (QDPDCE 39.3%, QDPPREFUL 43.4%,
69.1% overlap with a Dice coefficient of 0.63 for Q defect label and 0.74 for
the healthy label) and Center 2 (QDPDCE 39.6%, QDPPREFUL 53.8%,
60.5% overlap with a Dice coefficient of 0.60 for Q defect label and 0.61 for
the healthy label). Perfusion-weighted maps were normalized by the 95th percentile (percentage scale) of
all values above zero and inside the segmented lung parenchyma.

Figure
2: Bland Altman plots comparing perfusion defect percentage (QDP) assessed by
PREFUL and DCE for the whole lung. Data points obtained by Center 1 are marked
in green and data points obtained by Center 2 are marked in red. Solid line
represents mean difference. Black dashed lines indicate mean difference ± 1.96*standard deviation. Blue dashed lines represent
95% confidence interval of mean difference.

Table
1: Comparison of perfusion defect (QDP) of DCE and PREFUL. Data provided as
median with 25th and 75th percentiles in parentheses.