0447
Hyperpolarized 129Xe Imaging of Oxygenated and Deoxygenated Blood in a Free-Breathing Mouse1Radiology, University of Pennsylvania, Philadelphia, PA, United States
Synopsis
129Xe’s high solubility in tissue and blood, coupled with its dramatic change in chemical shift based on local chemical environment, enables quantitative measurements of blood oxygenation. In this work, we demonstrate a technique for distinguishing oxygenated vs. deoxygenated blood in the mouse circulatory system in vivo. Time-resolved dissolved-phase images and spectra were used to identify spectral signatures for 129Xe dissolved in oxygenated and deoxygenated blood, which were then applied to a mouse model of lung cancer to temporally assess regional changes in pulmonary blood oxygenation. The results presented here demonstrate
Introduction
While hyperpolarized 129Xe (HXe) MRI has primarily been used to study lung function due to its high solubility in blood and tissue, other potentially valuable applications include renal perfusion imaging1 and quantitative measurements of blood oxygenation2. In this study, we used a modified chemical shift imaging (CSI) sequence to acquire time-resolved images3 in order to distinguish between HXe dissolved in oxygenated vs. deoxygenated blood in vivo. This ability to measure real-time regional blood oxygenation could be valuable for studies of cancer, ischemia/hypoperfusion and other disease models.Methods & Materials
Genetically modified C57BL/6 mice (n = 4) were induced with lung cancer as previously described4 and anesthetized using 1-2% isoflurane; they were then imaged in a 9.4T vertical-bore micro-imaging MRI system (Bruker Inc.) while free-breathing a normoxic gas mixture consisting of O2, isoflurane, and HXe gas administered using a homemade gas delivery system. Image sets were acquired using a respiratory-gated CSI sequence combined with a user-defined phase-encode/flip-angle table; HXe distribution at different points in the circulatory system was visualized by varying the flip-angle (FA) and keeping the repetition time (TR) constant (FA = 6°, 12°, 25°, 50°, 90°; TR = 80 ms). Images were reconstructed using the respective flip-angle/phase-encode tables, and were corrrelated to an effective HXe RF-induced T1 decay value, T1,RF3, enabling temporal comparison between each image. As T1,RF increased, so did the complexity of the spectra and appearance of HXe signal. Given both the temporal and spatial information from CSI-acquired images, HXe resonances in the blood were assigned a certain chemical shift based on its appearance in the images and associated spectral contribution.Results
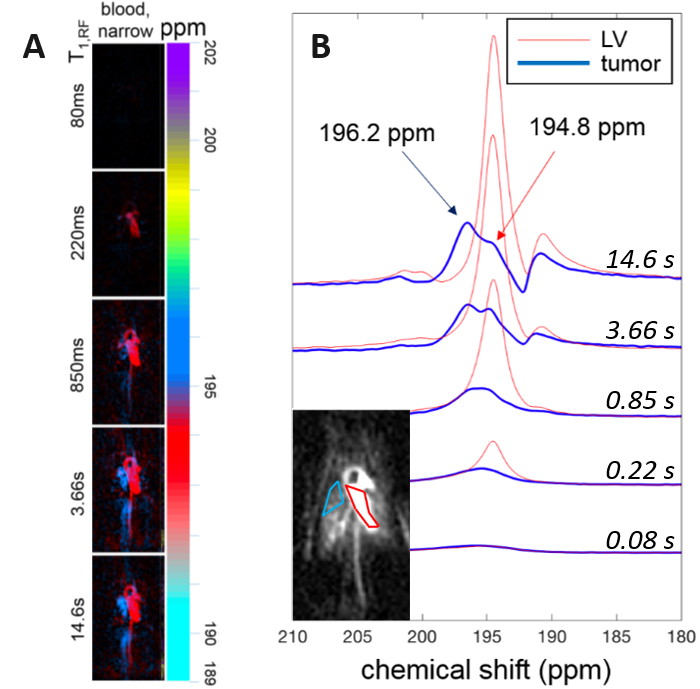
Figure 1A shows a representative image set of HXe dissolved in the narrow component of the blood resonance for a wide range of T1,RF values (0.08 s to 14.6 s, in this case). The chemical shift of HXe dissolved in oxygenated blood (HXe in the aorta/left ventricle) was measured to be +194.5 ppm with respect to the gas peak, while HXe in deoxygenated blood (HXe in the vena cava/right ventricle) presented a chemical shift slightly to the left at 195.5 ppm. Figure 1B shows HXe spectra for the same T1,RF range as in Figure 1A (short to long T1,RFs from bottom to top) for the two regions of interest (ROI) in the inset, corresponding to a lung tumor (blue) and the left ventricle (red). The spectra for the ROI in the left ventricle presents a resonance at 194.8 ppm that increases in amplitude with T1,RF; the spectra for the ROI in the lung tumor also shows a resonance at 194.8 ppm, while a more prominent resonance at 196.2 ppm increases in amplitude with increasing T1,RF.Discussion
The technique demonstrated here relies largely on the acquisition of images at different T1,RF3 values, which not only enables visualization of HXe distributed at different spatial points within the circulatory system but, when combined, can also be used to isolate the many distinct dissolved HXe spectral signatures in differing anatomical compartments of the mouse body5. Figure 1A shows this spectral isolation implemented for HXe dissolved only in the blood, while Figure 1B shows temporally-resolved dissolved-phase HXe spectra for two different ROIs (see Results). The spectra in the red ROI behave as expected: the resonance at 194.8 ppm, consistent with HXe dissolved in oxygenated blood, steadily grows in amplitude with T1,RF. It is interesting to note that additional resonances corresponding to HXe dissolved in surrounding structures can be seen at 190 – 193 ppm at a T1,RF of 14.6 s. While the spectra in the blue ROI show similar behavior across T1,RFs, the most prominent peak at T1,RF = 14.6 s appears to be at 196.2 ppm, consistent with HXe dissolved in deoxygenated blood. The presence and temporal evolution of this peak is most likely explained by real-time deoxygenation of blood within the region coincident with the tumor, or by an influx of deoxygenated blood from the venous system to that region. Since these images were acquired without anterior/posterior phase encoding, localization of the spectra in that direction was not possible.Conclusion
In this study, we demonstrated a technique for visualizing and distinguishing HXe dissolved in oxygenated and deoxygenated blood, showing its utility by measuring the time evolution of blood deoxygenation within a tumorous region of the lung. Future studies using this technique will focus on acquiring 3D images, rather than 2D projections, to more accurately localize signal contributions to specific anatomical compartments; these studies will also demonstrate this technique’s utility for investigating disease models characterized by alterations in regional blood oxygenation.Acknowledgements
No acknowledgement found.References
[1] Chacon‐Caldera, Jorge, et al. "Dissolved hyperpolarized xenon‐129 MRI in human kidneys." Magnetic Resonance in Medicine 83.1 (2020): 262-270.
[2] Wolber, Jan, et al. "Hyperpolarized 129Xe NMR as a probe for blood oxygenation." Magnetic Resonance in Medicine 43.4 (2000): 491-496.
[3] Ruppert, Kai, et al. "Assessment of flip angle–TR equivalence for standardized dissolved‐phase imaging of the lung with hyperpolarized 129Xe MRI." Magnetic Resonance in Medicine 81.3 (2019): 1784-1794.
[4] Sheen, Mee Rie, et al. "Constitutively activated PI3K accelerates tumor initiation and modifies histopathology of breast cancer." Oncogenesis 5.10 (2016): e267.
[5] Loza, Luis A., et al. "Quantification of Ventilation and Gas Uptake in Free-Breathing Mice with Hyperpolarized 129Xe MRI." IEEE transactions on medical imaging (2019). 2081 – 2091.
Figures