0446
Voxel-wise comparison of co-registered quantitative CT and hyperpolarized gas diffusion-weighted MRI measurements in IPF1Academic Radiology, University of Sheffield, Sheffield, United Kingdom, 2Biomedical Imaging Resource, Mayo Clinic, Rochester, MN, United States, 3Academic Directorate of Respiratory Medicine, Sheffield Teaching Hospitals NHS Foundation Trust, Sheffield, United Kingdom
Synopsis
A framework for spatial co-registration of 3He diffusion-weighted (DW)-MRI and high resolution CT (HRCT) images was developed and implemented in a cohort of fifteen idiopathic pulmonary fibrosis participants. Voxel-wise comparison of 3He DW-MRI derived apparent diffusion coefficient (ADC) and mean alveolar dimension (LmD) with CALIPER image analysis software classifications revealed that the largest DW-MRI metrics are in voxels classified as honeycombing. Furthermore, LmD values in voxels classified as normal by CALIPER were larger than those from age-matched healthy volunteers, suggesting DW-MRI may detect microstructural changes even in areas of the lung determined as macroscopically normal by HRCT.
Introduction
Idiopathic pulmonary fibrosis (IPF) is characterized by pathological fibroblastic activity, predominantly in the basal and peripheral lung tissue, leading to destruction of alveolar tissue. Recently, the global apparent diffusion coefficient (ADC) and stretched exponential model derived mean alveolar dimension (LmD)1 from hyperpolarized 3He diffusion-weighted (DW)-MRI was demonstrated to be elevated in lungs afflicted with IPF, indicative of a loss of acinar integrity related to fibrosis2. Furthermore, 3He DW-MRI metrics also correlated with visual scoring of interstitial lung disease (ILD) severity on high resolution CT (HRCT) images. However, to elucidate which features of ILD correspond to the observed elevated DW-MRI metrics, a more regional or voxel-wise comparison is required. Image analysis software tools such as CALIPER, developed by the Biomedical Imaging Resource at Mayo Clinic (Rochester, MN, USA), can automatically characterize and quantify HRCT images for patterns of ILD on a voxel-wise level3. Therefore, the aim of this work was to develop a spatial co-registration framework for voxel-wise comparison of 3He DW-MRI and CALIPER classification maps.Methods
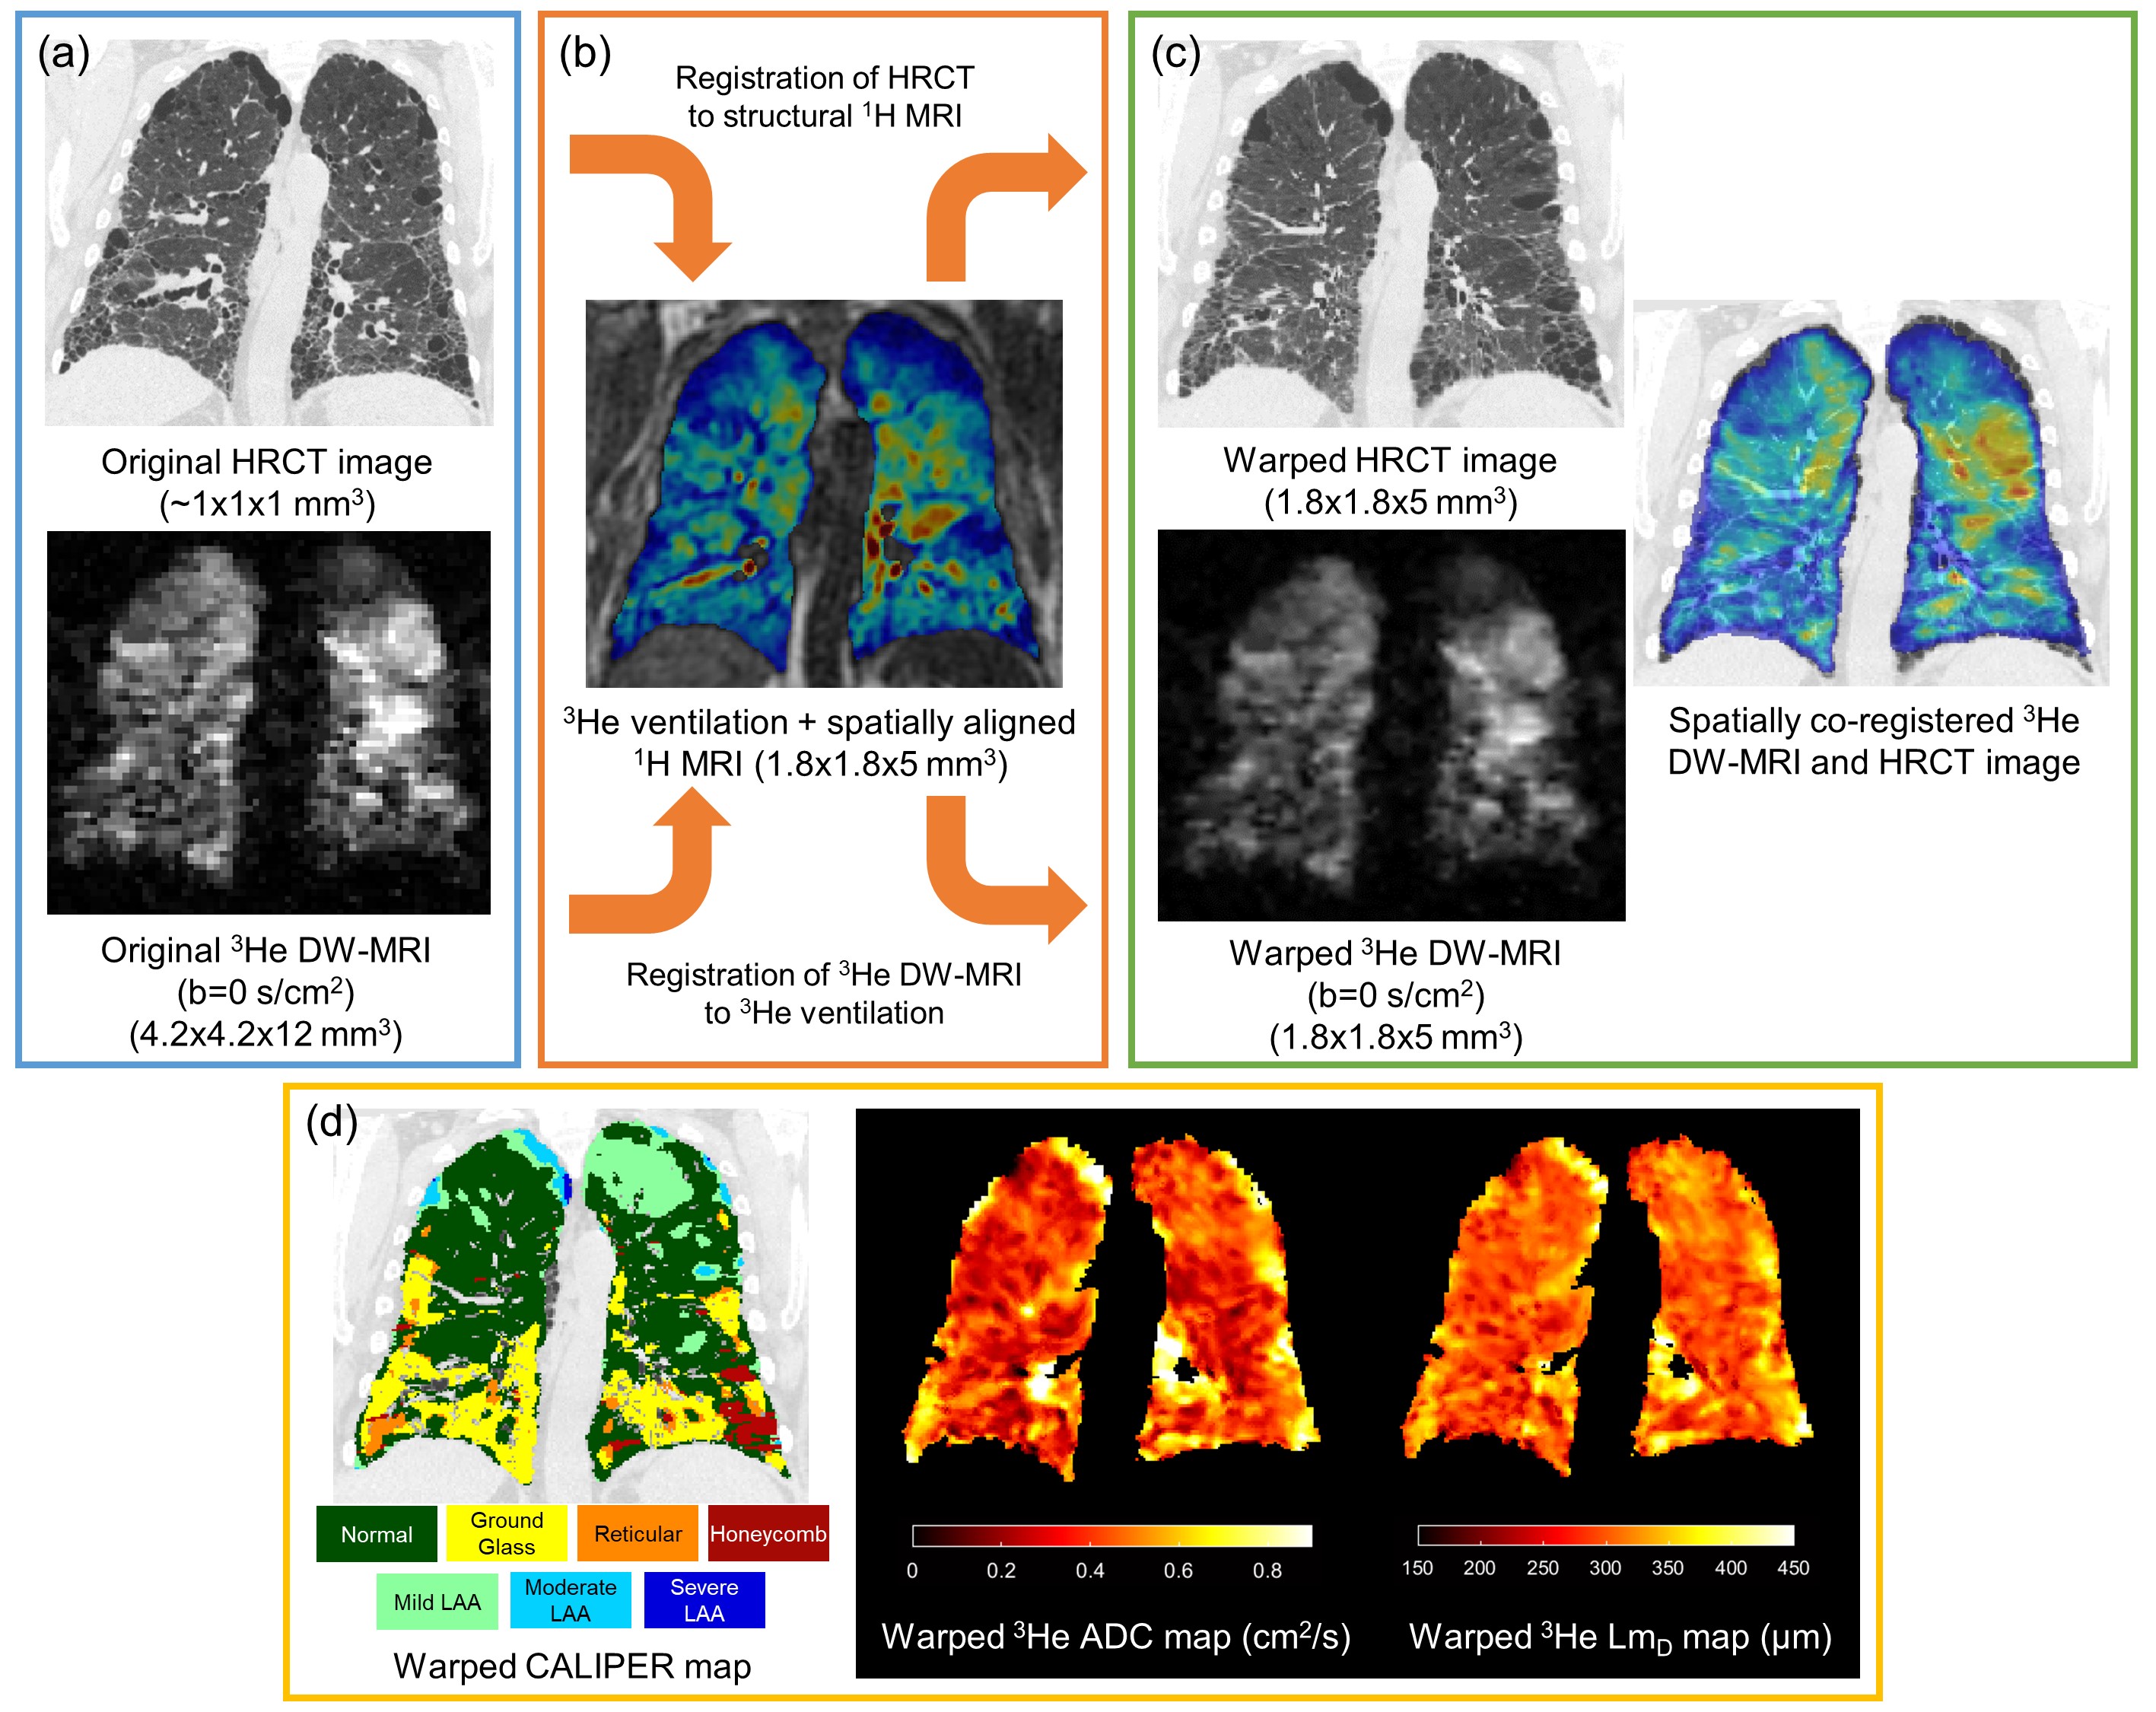
Fifteen participants (mean 71±5 years) with IPF from Chan et al.2 were chosen for this retrospective analysis. Each participant had underwent hyperpolarized 3He MRI at 1.5T (GE HDx), including 3D DW-MRI1 and 3D ventilation with spatially aligned structural 1H MRI4, and HRCT imaging (Figure 1a). The lung parenchyma in HRCT was characterized with CALIPER software into seven classification groups including: normal, ILD patterns (honeycombing, reticular changes and ground-glass opacities), and lower attenuation areas (mild, moderate and severe)3. Reconstructed 3He DW-MRI was spatially co-registered to HRCT indirectly via spatially aligned 3He ventilation and structural 1H MRI5 using Advanced Normalization Tools image registration software6 (Figure 1b). 3He DW-MRI was deformed to the spatial domain of the ventilation images, while HRCT was deformed to the spatial domain of structural 1H MRI. The resultant spatial resolution of co-registered images was approximately 1.8x1.8x5 mm3 (Figure 1c).Image registration accuracy was assessed by Dice similarity coefficients between the semi-automated binary lung segmentation masks of warped HRCT and structural 1H, and warped 3He DW-MRI and 3He ventilation, respectively. The same HRCT-1H deformation was used to warp CALIPER classification maps, and maps of ADC and LmD were subsequently derived from the warped 3He multiple b-value DW-MRI (Figure 1d). Overlapping warped HRCT and ADC or LmD voxels were compared across all participants for each CALIPER classification group, and statistical differences between each group were assessed with Kruskal-Wallis and Dunn’s multiple comparison tests.
Results and Discussion
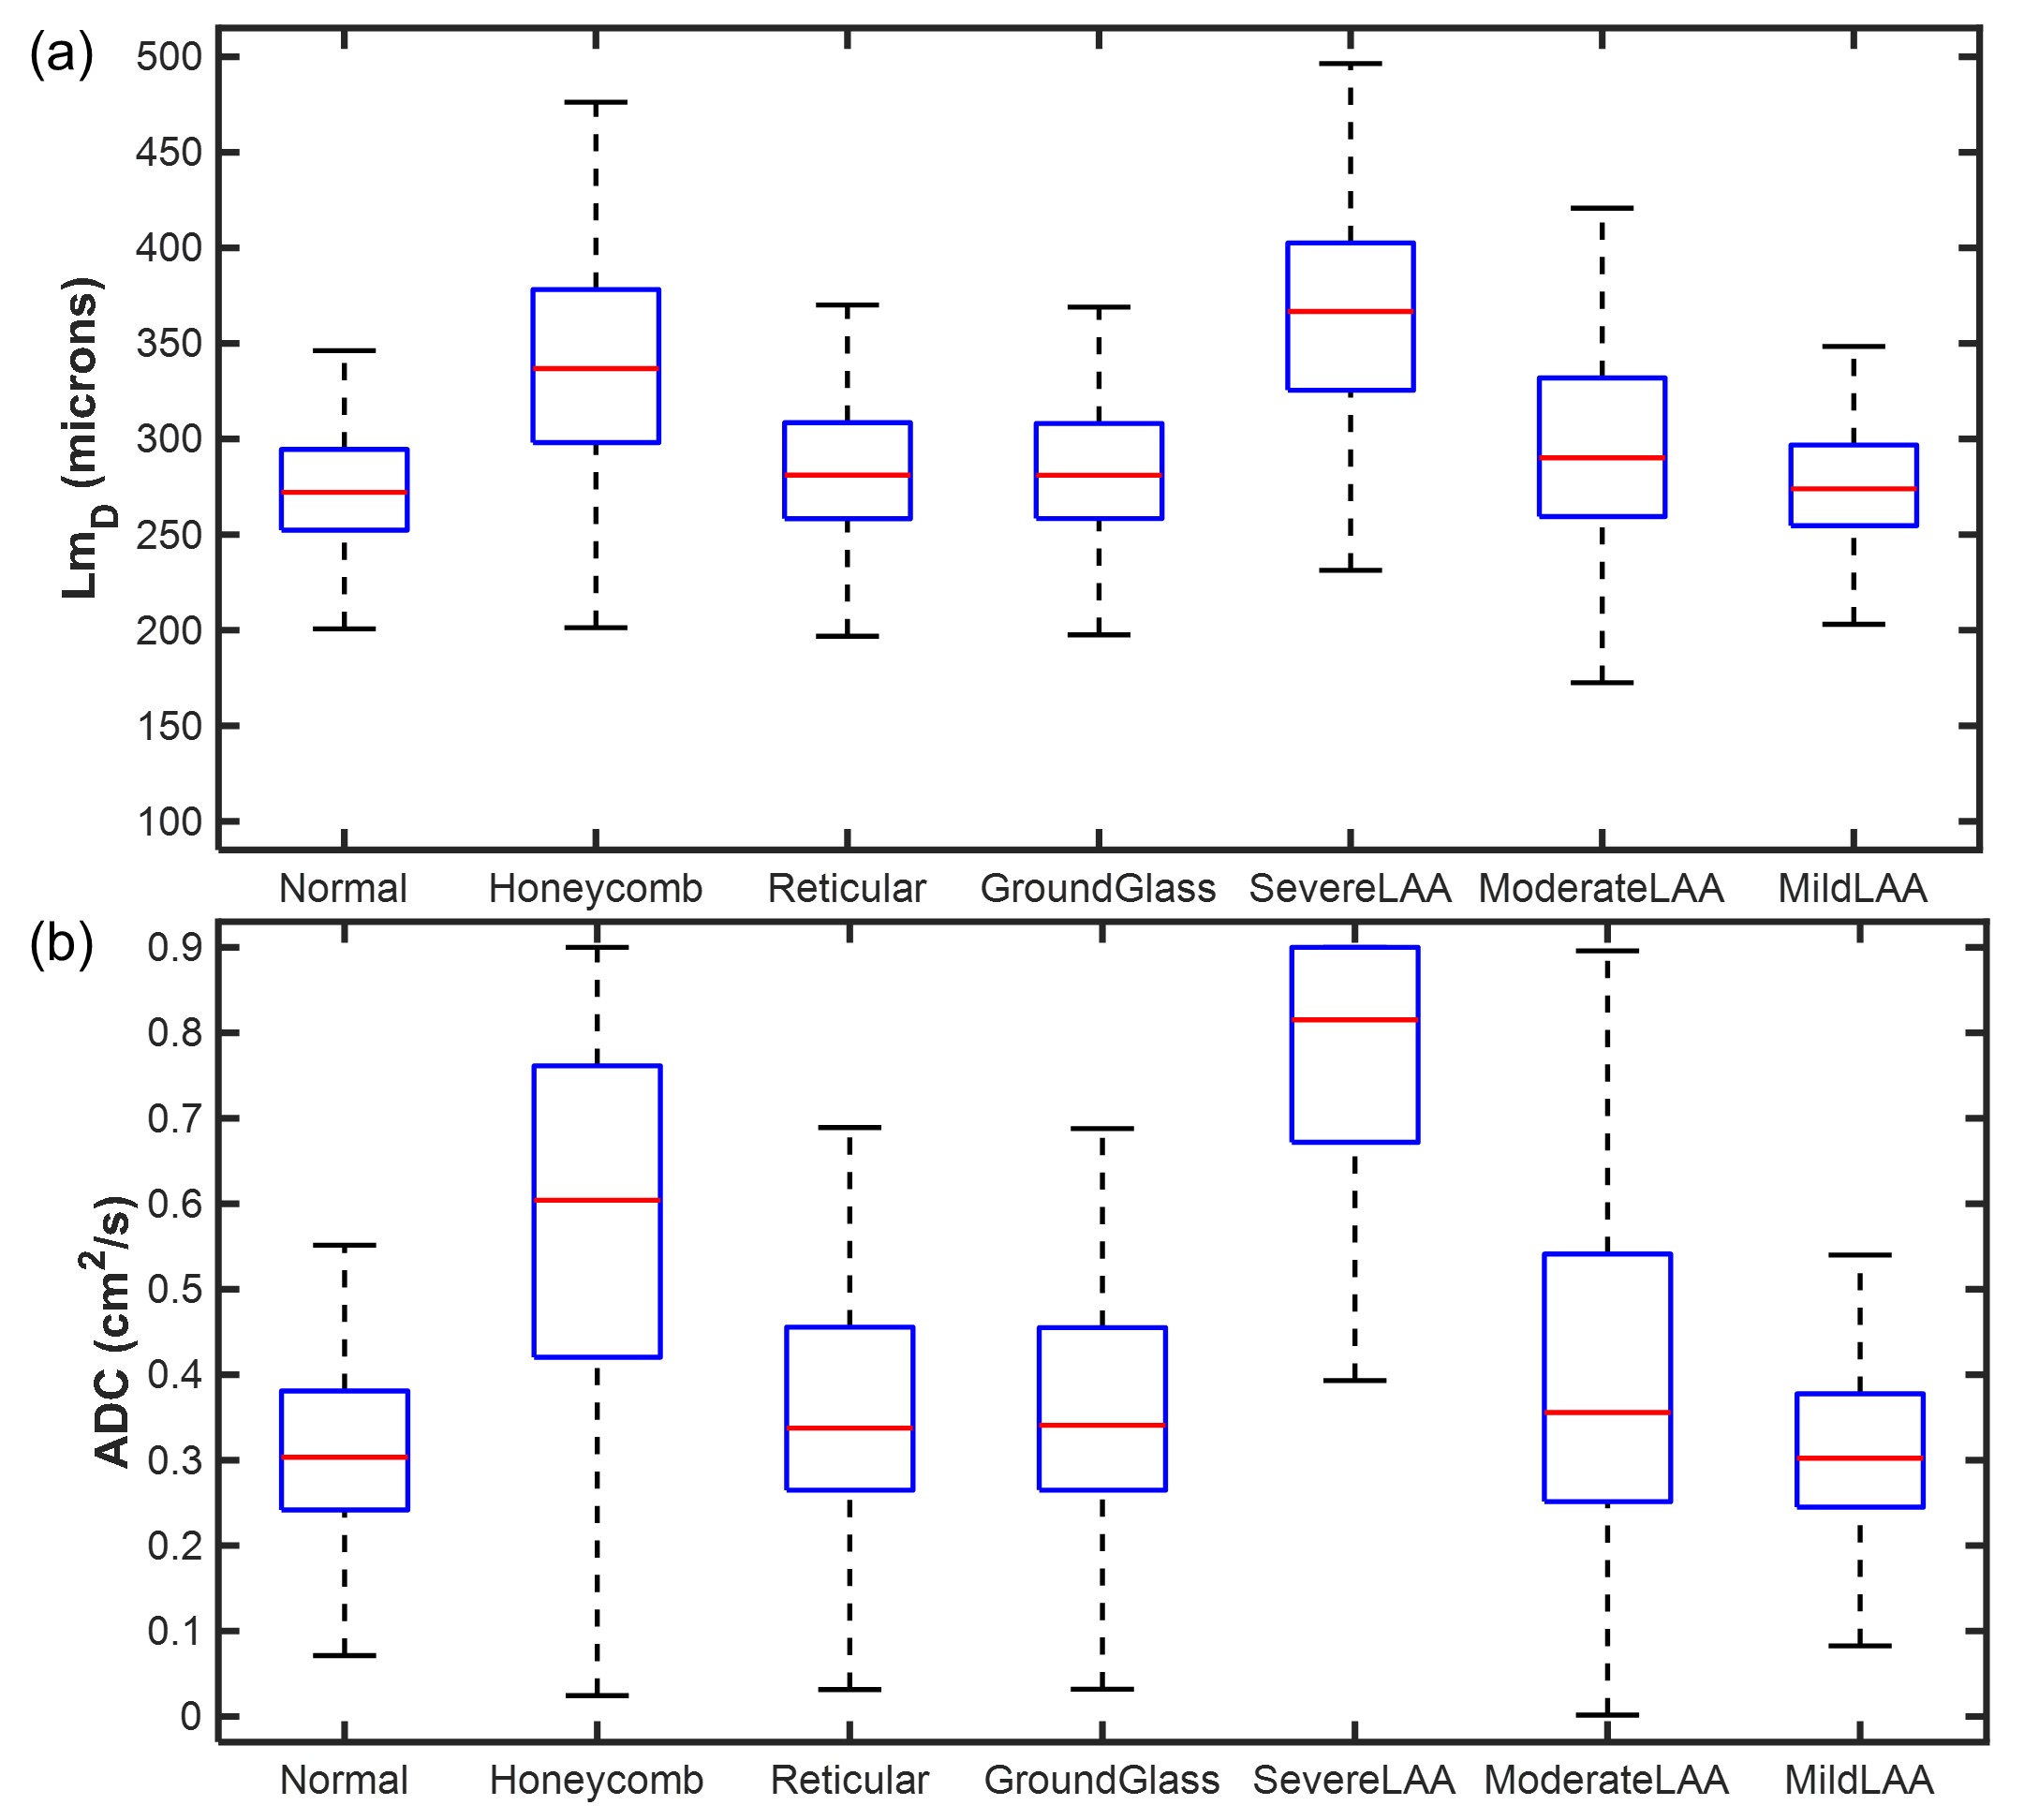
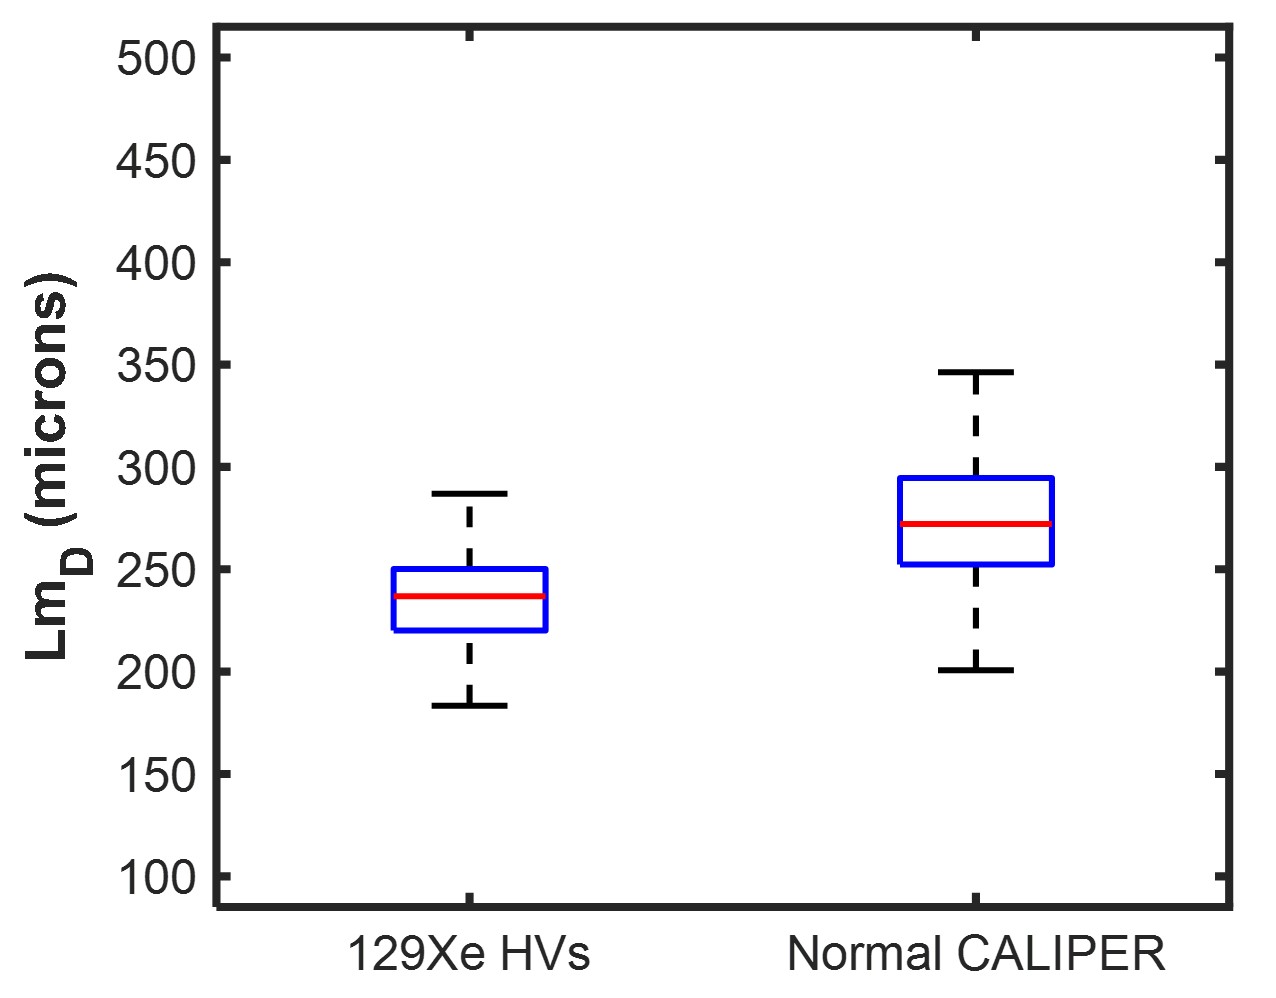
Spatial co-registration of HRCT and 3He DW-MRI was successfully implemented in all fifteen IPF participants. Mean Dice similarity coefficients of 0.95±0.01 and 0.91±0.01 were obtained for the HRCT to structural 1H and 3He DW-MRI to 3He ventilation co-registrations, respectively. Voxel-wise comparison of CALIPER classifications with LmD and ADC values in all participants are summarized in Figure 2. Statistically significant differences between ADC and LmD values within the different CALIPER classification groups (P<0.001) were observed. Dunn’s multiple comparison tests found significant differences between all CALIPER classification groups with both ADC and LmD (P<0.001), except between reticular and moderate lower attenuation area groups for ADC, and between reticular and ground-glass groups for LmD. Voxels classified as honeycombing by CALIPER had the largest ADC and LmD values out of all the ILD pattern groups; further supporting the hypothesis that elevated hyperpolarized gas DW-MRI metrics are a result of honeycomb cysts2.Small differences in ADC and LmD between normal and reticular or ground-glass classification groups may suggest these interstitial changes have minimal accompanying acinar microstructural changes. However, when the LmD values (mean=274±35 µm) within the normal classified CALIPER group are compared to 129Xe LmD7 (mean=234±24 µm) in seven older healthy volunteers (mean 66±3 years), a statistically significant difference was observed (P<0.001) (Figure 3). This perhaps suggests that hyperpolarized gas DW-MRI is sensitive to aspects of acinar microstructural changes in IPF lung disease such as microscopic cysts that are not resolved by HRCT.
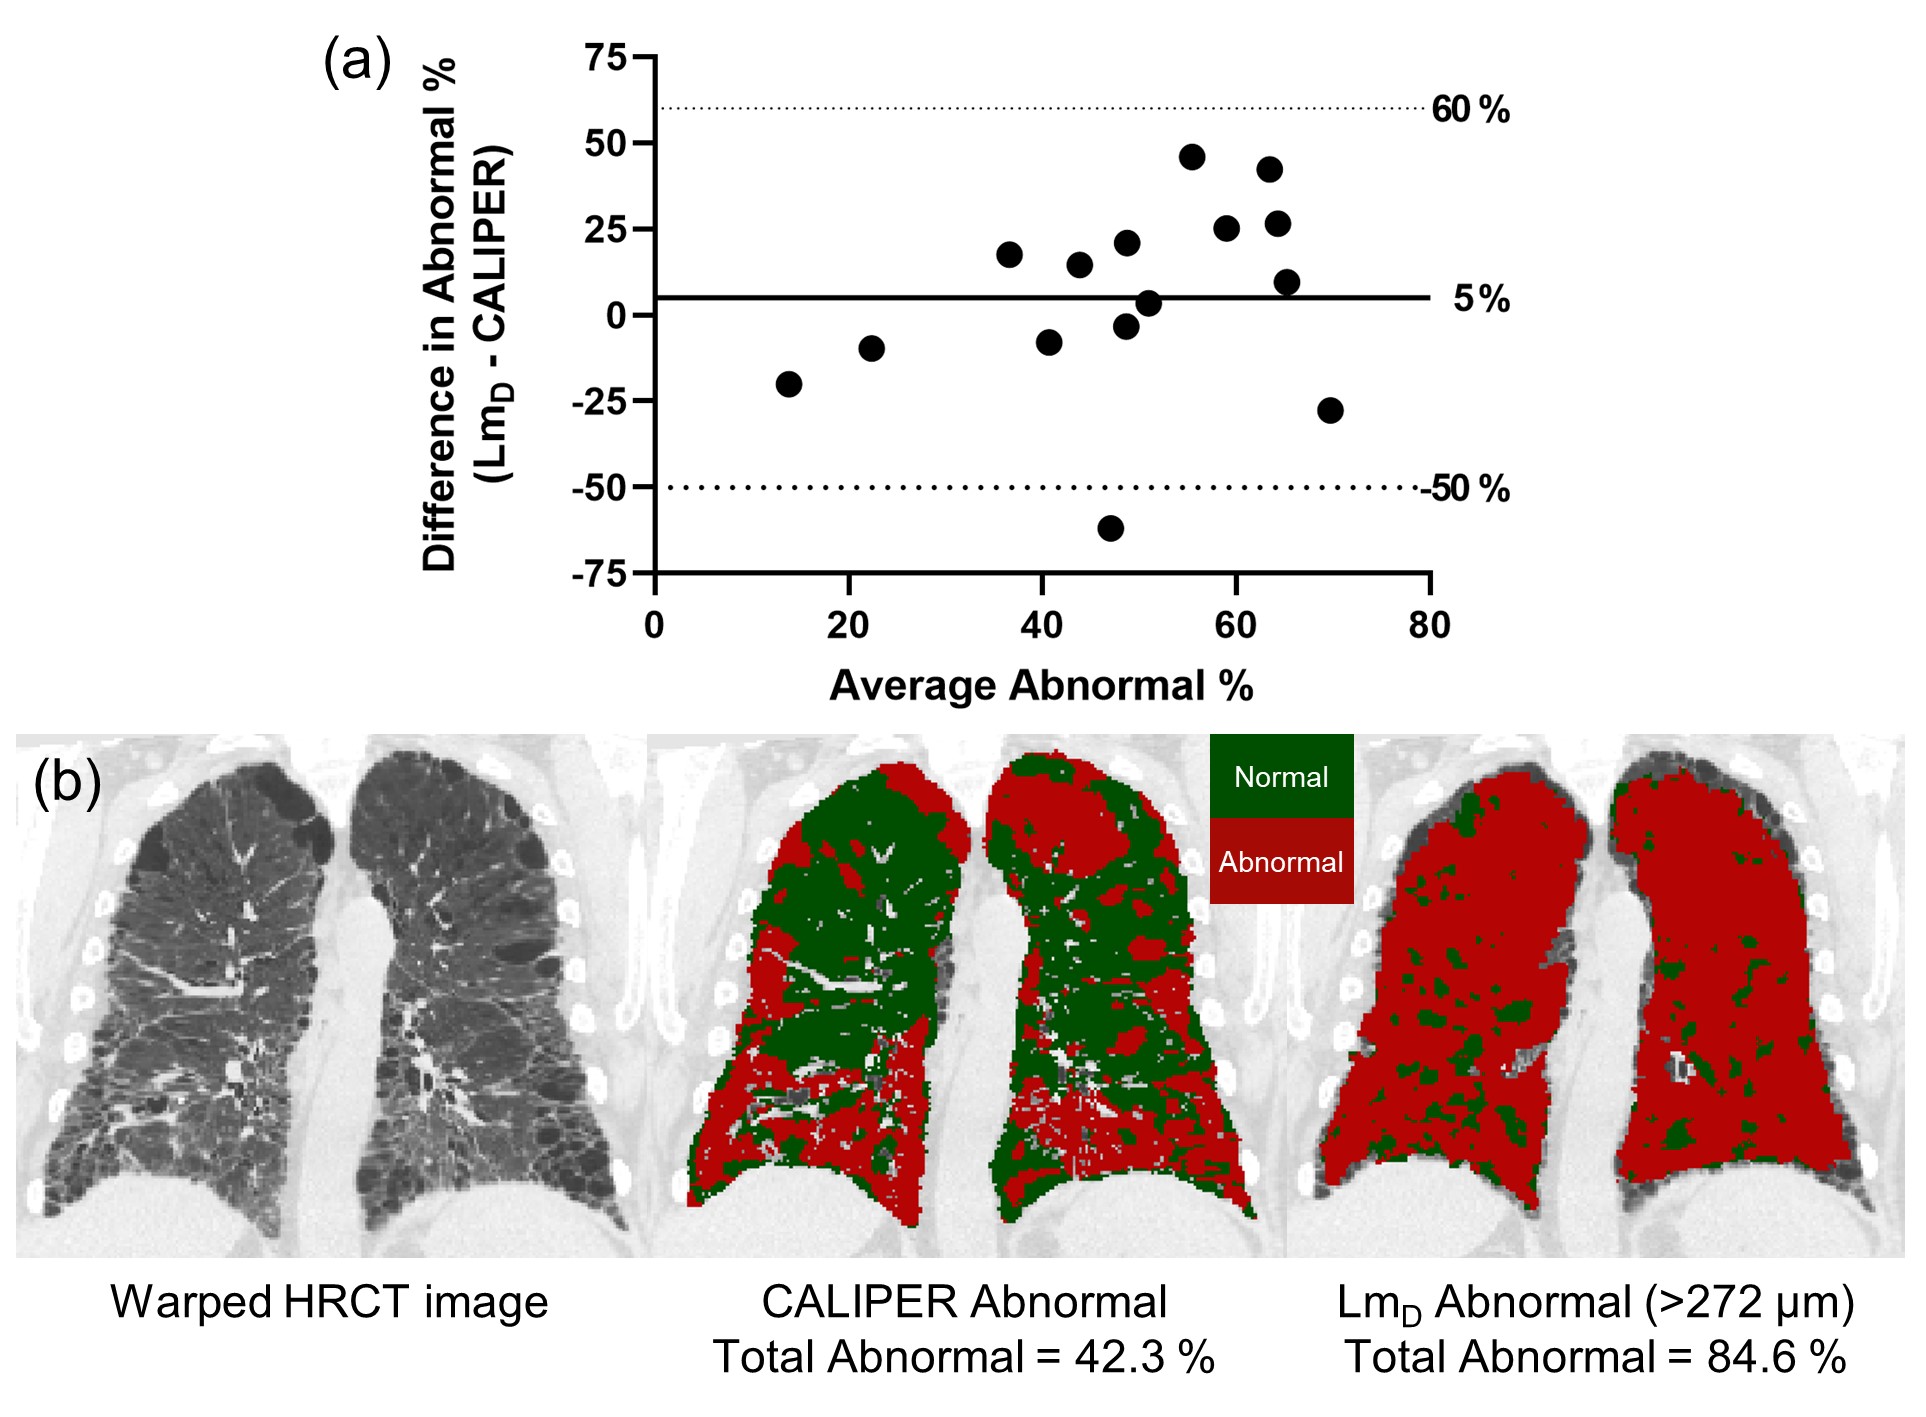
To further explore this, IPF LmD maps with voxels greater than 272 µm, corresponding to the 95% upper limit of older healthy LmD values, were classified as abnormal. LmD maps classified for abnormality were compared to CALIPER maps where all abnormal classifications were grouped together. Bland-Altman analysis of the percentage of abnormal classified voxels between LmD and CALIPER obtained a mean bias of 5% towards LmD across all IPF participants (Figure 4a), suggesting more abnormal microstructural changes are detected by DW-MRI. This bias is demonstrated in a representative IPF participant with 42.3% of the lung classified abnormal with CALIPER, in contrast to the 84.6% abnormal as determined from LmD (Figure 4b).
Conclusion
A framework for co-registration of 3He DW-MRI and HRCT images was developed and implemented in fifteen IPF participants. Voxel-wise comparison of derived ADC and LmD values with CALIPER classifications of ILD patterns confirmed the largest DW-MRI metrics are in honeycombing voxels. LmD in voxels classified as normal by CALIPER were larger than those in age-matched healthy volunteers, suggesting DW-MRI may detect microstructural changes in regions determined as macroscopically normal by HRCT. Future work will involve co-registering 129Xe DW-MRI with HRCT to explore classification differences in other ILD subtypes.Acknowledgements
This work was supported by NIHR grant NIHR-RP-R3-12-027 and MRC grant MR/M008894/1. The views expressed in this work are those of the author(s) and not necessarily those of the NHS, the National Institute for Health Research or the Department of Health.References
1. Chan HF, Stewart NJ, Parra-Robles J, et al. Whole lung morphometry with 3D multiple b-value hyperpolarized gas MRI and compressed sensing. Magn Reson Med. 2017;77(5):1916-25.
2. Chan HF, Weatherley ND, Johns CS, et al. Airway Microstructure in Idiopathic Pulmonary Fibrosis: Assessment at Hyperpolarized (3)He Diffusion-weighted MRI. Radiology. 2019;291(1):223-9.
3. Bartholmai BJ, Raghunath S, Karwoski RA, et al. Quantitative computed tomography imaging of interstitial lung diseases. J Thorac Imaging. 2013;28(5):298-307.
4. Horn FC, Tahir BA, Stewart NJ, et al. Lung ventilation volumetry with same-breath acquisition of hyperpolarized gas and proton MRI. NMR Biomed. 2014;27(12):1461-7.
5. Tahir BA, Swift AJ, Marshall H, et al. A method for quantitative analysis of regional lung ventilation using deformable image registration of CT and hybrid hyperpolarized gas/(1)H MRI. Phys Med Biol. 2014;59(23):7267-77.
6. Avants BB, Tustison NJ, Song G, et al. A reproducible evaluation of ANTs similarity metric performance in brain image registration. Neuroimage. 2011;54(3):2033-44.
7. Chan HF, Stewart NJ, Norquay G, et al. 3D diffusion-weighted (129) Xe MRI for whole lung morphometry. Magn Reson Med. 2018;79(6):2986-95.
Figures