0445
Supervised shallow learning of 129Xe MRI texture features to predict response to Anti-IL-5 biologic therapy in severe asthma1Department of Medical Biophysics, Robarts Research Institute, Western University, London, ON, Canada, 2Robarts Research Institute, Western University, London, ON, Canada, 3Division of Respirology, Department of Medicine, Western University, London, ON, Canada, 4Department of Medical Biophysics, Division of Respirology, Department of Medicine, Robarts Research Institute, Western University, London, ON, Canada
Synopsis
129Xe MRI ventilation images consist of embedded texture features that help explain abnormal ventilation heterogeneity. We postulated that such texture features may help predict severe asthma patient response to anti-IL-5 therapies. Therefore, we employed supervised shallow learning techniques to identify specific 129Xe MRI features that help predict anti-IL-5 responders. Texture analysis yielded features that were superior to clinical measurements in identifying severe asthma patients that responded to anti-IL-5 therapy after 28 days. These promising results suggest that texture analysis may help predict asthmatics more likely to respond, before treatment is initiated.
Introduction
Hyperpolarized 129Xe magnetic resonance imaging (MRI) provides a way to spatially locate and quantify inhaled gas abnormalities related to airway dysfunction, inflammation and remodeling. In previous work, hyperpolarized 3He ventilation defect percent (VDP) was shown to be directly related to airway wall inflammation1 in all participants with asthma and sputum eosinophilia in patients with severe asthma.2 Currently-used segmentation tools typically binarize ventilated versus non-ventilated lung tissue, disregarding signal intensity differences and assuming all ventilated regions contribute equally to global lung function. These signal intensity differences can be quantified using gray-level run length matrices (GLRLM)3. Texture features, such as short run emphasis (SRE), long run emphasis (LRE), low gray-level run emphasis (LGRE), and gray level non-uniformity (GLN) can be extracted from GLRLM to describe ventilation heterogeneity. While SRE and LRE describe short and long runs, respectively LGRE describes low-gray levels and GLN evaluates the distribution of gray levels within an image.Benralizumab is a member of a class of biologic humanized monoclonal antibody therapies that targets interleukin 5 (IL-5). In patients with severe eosinophilic asthma who were poorly controlled with maximal guidelines-based therapy, the subcutaneous injection of 30 mg benralizumab was shown to improve the forced exhaled volume in 1 second (FEV1), quality of life (QOL), and benralizumab also significantly reduced blood eosinophil counts to normal levels.4,5 It remains difficult to predict however, who will respond to IL-5 therapy. Moreover, current measurements of anti-IL-5 therapy response are relatively insensitive to small airway function and cannot detect objective improvements within weeks of therapy when blood eosinophil counts are completely normalized.
In this regard, hyperpolarized gas MRI VDP and MRI texture analysis have been previously used to measure post- bronchodilator improvements6,7 in airway function and ventilation and to predict methacholine responsive asthmatics. Here we hypothesized that VDP and texture features including SRE, LRE, LGRE, and GLN would significantly distinguish responders from non-responders with severe eosinophilic asthma prior to treatment with benralizumab. Therefore, the objective of this work was to extract texture features from 129Xe MRI prior to therapy and use a shallow learning approach to identify features that predict response to benralizumab therapy using asthma control improvements as the gold standard.
Methods
Participants with severe eosinophilic asthma (blood eosinophils ≥300 cells/μL) provided written informed consent to an ethics board approved protocol and 129Xe MRI (400 mL inhaled), pulmonary function tests at baseline and 28-days post-benralizumab (30 mg). A small subset of patients also consented to MRI 14-days post-benralizumab.Anatomical 1H and hyperpolarized 129Xe were acquired using a 3.0 Tesla Discovery MR750 (General Electric Health Care, WI, USA). Participants were instructed to inhale 1.0 L of gas (100% N2 for anatomical scan and 400 mL hyperpolarized 129Xe mixed with 600 mL 4He) to ensure volume matched images for segmentation. MRI was acquired under breath-hold conditions. Images were segmented to measure VDP8 and the GLRLM3,6 was calculated pre- and post-salbutamol before benralizumab was administered. The GLRLM method was modified specifically for xenon texture feature analysis. From these matrices, we calculated 11 second-order texture features, including SRE, LRE, LGRE and GLN.6 Participants who reported an ACQ-6 improvement ≥ minimal clinically-important-difference 28-days post-benralizumab were stratified as benralizumab responders.5 Receiver operator characteristic (ROC) curves were generated pre-and post-bronchodilator for FEV1, lung clearance index (LCI), oscillometry-measured airway resistance (R5Hz, R5Hz-19Hz), VDP, GLRLM texture features, and the St. George’s Respiratory Questionnaire (SGRQ) using GraphPad Prism 8.0.2.
Results
Table 1 provides demographic characteristics for all 17 participants (of 30 prospectively planned for enrollment) evaluated including nine participants who reported an ACQ-6 response greater than the minimal clinically-important difference. Responders were younger, with greater baseline eosinophil values and lower baseline FEV1. Figure 2 provides 129Xe MRI centre slice ventilation images for representative benralizumab responders and non-responders. As shown in Figure 3, post-bronchodilator baseline MRI LGRE (AUC=.81, p=.03) was significantly predictive, whereas post-bronchodilator baseline VDP (AUC=.76, p=.07), GLN (AUC=.75, p=.08), and SGRQ (AUC=.76, p=.07) trended towards significance. Oscillometry, pulmonary function tests and lung clearance index values, were not significant predictors of benralizumab response.Discussion
There are currently 4 biologic therapy options for patients with severe asthma and the number will increase to six in the very near future. Unfortunately, it is difficult to predict those patients that will experience a positive response to IL-5 therapy. Moreover, current measurements of anti-IL-5 therapy response are relatively insensitive to small airway function and cannot detect objective improvements within weeks of therapy when blood eosinophil counts are completely normalized. Here, in a small group of 17 asthmatics undergoing treatment, we identified potential texture features that are predictive of IL-5 therapy response. With the completion of the study in 30 participants, we expect to identify novel MRI predictors of response.Conclusion
Post-bronchodilator baseline MRI features and VDP are potential predictors of improved asthma control in response to biologic therapy in severe asthma. This is important and clinically relevant because of the high cost of biologic therapy (~$30,000 annually) and the inability to predict or identify patients who will respond prior to therapy initiation.Acknowledgements
No acknowledgement found.References
1 Svenningsen, S. et al. Thorax 69, 63-71 (2014).
2 Svenningsen, S. et al. Am J Respir Crit Care Med 197, 876-884 (2018).
3 Haralick, R. M. et al. Ieee T Syst Man Cyb Smc3, 610-621 (1973).
4 Bleecker, E. R. et al. Lancet 388, 2115-2127 (2016).
5 FitzGerald, J. M. et al. Lancet 388, 2128-2141 (2016).
6 Zha, N. et al. Acad Radiol 23, 176-185 (2016).
7 Kirby, M. et al. Radiology 261, 283-292 (2011).
8 Kirby, M. et al. Acad Radiol 19, 141-152 (2012).
Figures
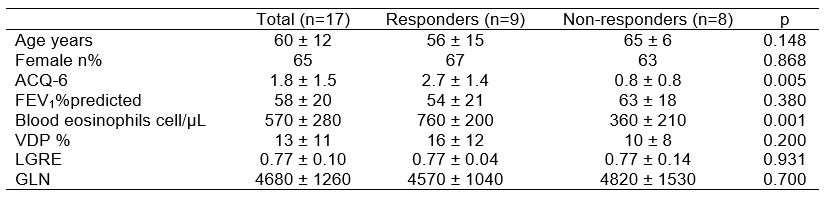
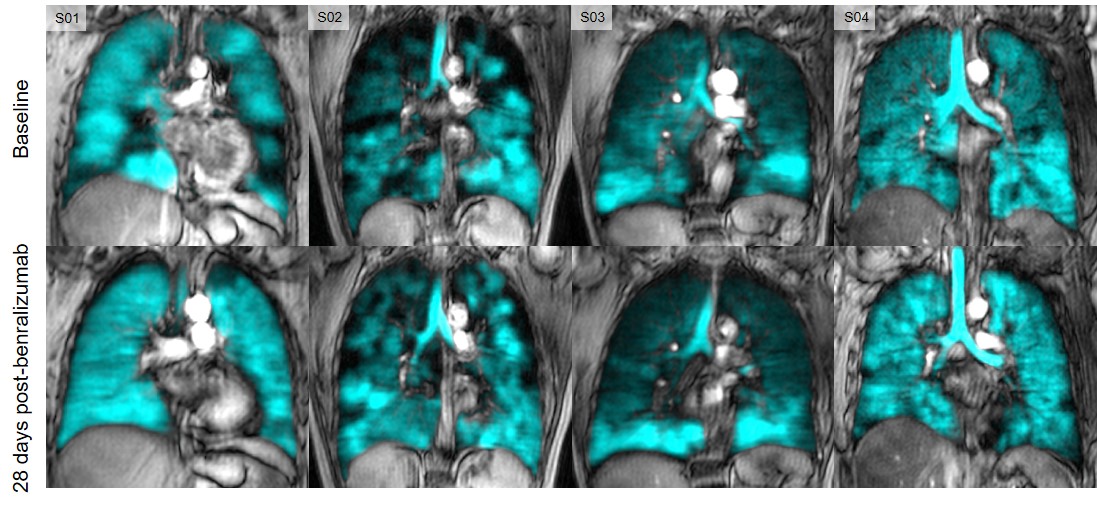
Figure 2: Qualitative results of responders (S01 and S02) vs. non-responders (S03 and S04) pre- and 28-days post-benralizumab.
At baseline, VDP of S01, S02, S03, and S04 was 11%, 20%, 8%, and 3% and 0.5%, 7%, 7%, and 3% 28-days post-benralizumab. ACQ-6 scores of S01, S02, S03, and S04 was 4.67, 1.5, 1.5, and 0.33 at baseline and 1.33, 1, 1.17, and 0.17 28-days post-benralizumab.
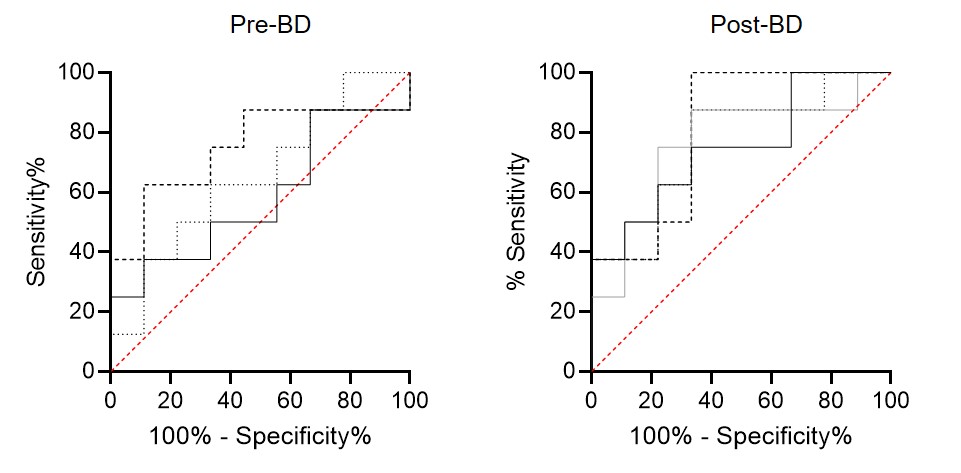
Figure 3: Receiver operator curve (ROC) results for response predictors
Post-bronchodilator LGRE (dashed line; AUC=.75, p=.08), GLN (solid line; AUC=.58, p=.56) and VDP (dotted line; AUC=.65, p=.29) and post-bronchodilator LGRE (AUC=.81, p=.03), VDP (AUC=.76, p=.07), GLN (AUC=.75, p=.08), and SGRQ (solid gray line; AUC=.76, p=.07).