0444
Longitudinal lobar analysis to access variable dynamic airflow changes in asthma with hyperpolarized helium-3 MRI1Department of Pulmonary and Critical Care, University of Virginia, Charlottesville, VA, United States, 2Department of Radiology and Medical Imaging, University of Virginia, Charlottesville, VA, United States, 3Department of Radiology, University of Missouri, Columbia, MO, United States
Synopsis
With hyperpolarized 3He MRI regional differences in airflow can be assessed. We sought to evaluate the changes in regional ventilation following bronchodilator therapy in patients with asthma. Baseline and post-treatment 3He/1H scans were co-registered, and normalized to enable serial comparison. Linear binning quantification was applied to the ventilation scan data to obtain quantitative metrics. Baseline and post-treatment scans were compared for regions of ventilation improvement or worsening. Lobar analysis was performed to identify ventilation abnormalities in each lobe. It was found that in asthmatics with bronchodilator response, ventilation improved globally, with most significant improvement in the upper and middle lobes.
Introduction
Asthma is characterized by chronic airway inflammation, variable airway hyperreactivity, and episodic exacerbations. Diagnosis and treatment remain a challenge due to its heterogeneous presentation, variable response to therapy, and frequently undiagnosed airflow limitation with spirometry. Hyperpolarized Gas MRI (HPG MRI) has been used to visualize regions of airflow obstruction in asthmatic patients. The technique has also shown global ventilation improvement in most of asthmatics after bronchodilator therapy 1,2. In this study, we sought to evaluate, in a heterogeneous population of asthmatics, the variable dynamic airflow changes at the lobar level following bronchodilator therapy.Methods
Patients with clinical diagnosis of asthma (n=37, age=25.6±5.8) and healthy controls (n=8, age=22.1±5.7) were enrolled for HP 3He MRI using a 1.5-T SIEMENS scanner. Patients were classified as asthma with bronchodilator response (Group A, n=7, ΔFEV1>200 mL or ΔFEV1%pred>12%), asthma with obstruction without bronchodilator response (Group B, n=3, FEV1/FVC<70%, FEV1%pred <80%), and asthma without obstruction or bronchodilator response (Group C, n=27) based on their pulmonary function test (PFT) results. All subjects underwent 3He ventilation MRI accompanied by a matching 1H thoracic cavity image at baseline and after bronchodilator therapy. The 3He MRI was acquired using a fast low-angle shot sequence with 1.95x1.95x10 mm3 (Coronal acquisition) or 1.64x1.64x10 mm3 (Axial acquisition) resolution. The 1H anatomy scan was acquired using a Turbo spin-echo (TSE) sequence. To evaluate therapy response, the baseline and post-treatment ventilation scans were normalized by 1) co-registering the baseline and post-treatment 3He/1H scans, 2) correcting the aligned 3He images for B1 inhomogeneity3, 3) normalizing the intensity range of the baseline and post-treatment ventilation scans using histogram matching4, and 4) normalizing the ventilation scans’ intensity histograms to a range of 0 to 1 by rescaling to the top percentile. Then, each normalized 3He ventilation scan was classified as ventilation defect percentage (VDP), low- (LVP), and high-ventilation (HPV) percentage by applying equally-spaced thresholds derived from the reference population of 8 controls5,6. Baseline and post-treatment ventilation scans were compared for regions of improvement, normal ventilation variation, and worsening. The normal ventilation variation was first determined based on the averaged therapy response in healthy controls. Regions with a therapy response greater than the normal ventilation variation were classified as ventilation improvement, while regions with responses lower than the normal ventilation variation were classified as ventilation worsening. Then, lobar analysis was performed to determine ventilation abnormalities in each lobe7. Correlation of ventilation defects by global and lobar ventilation, and response to bronchodilator therapy were also performed.Results
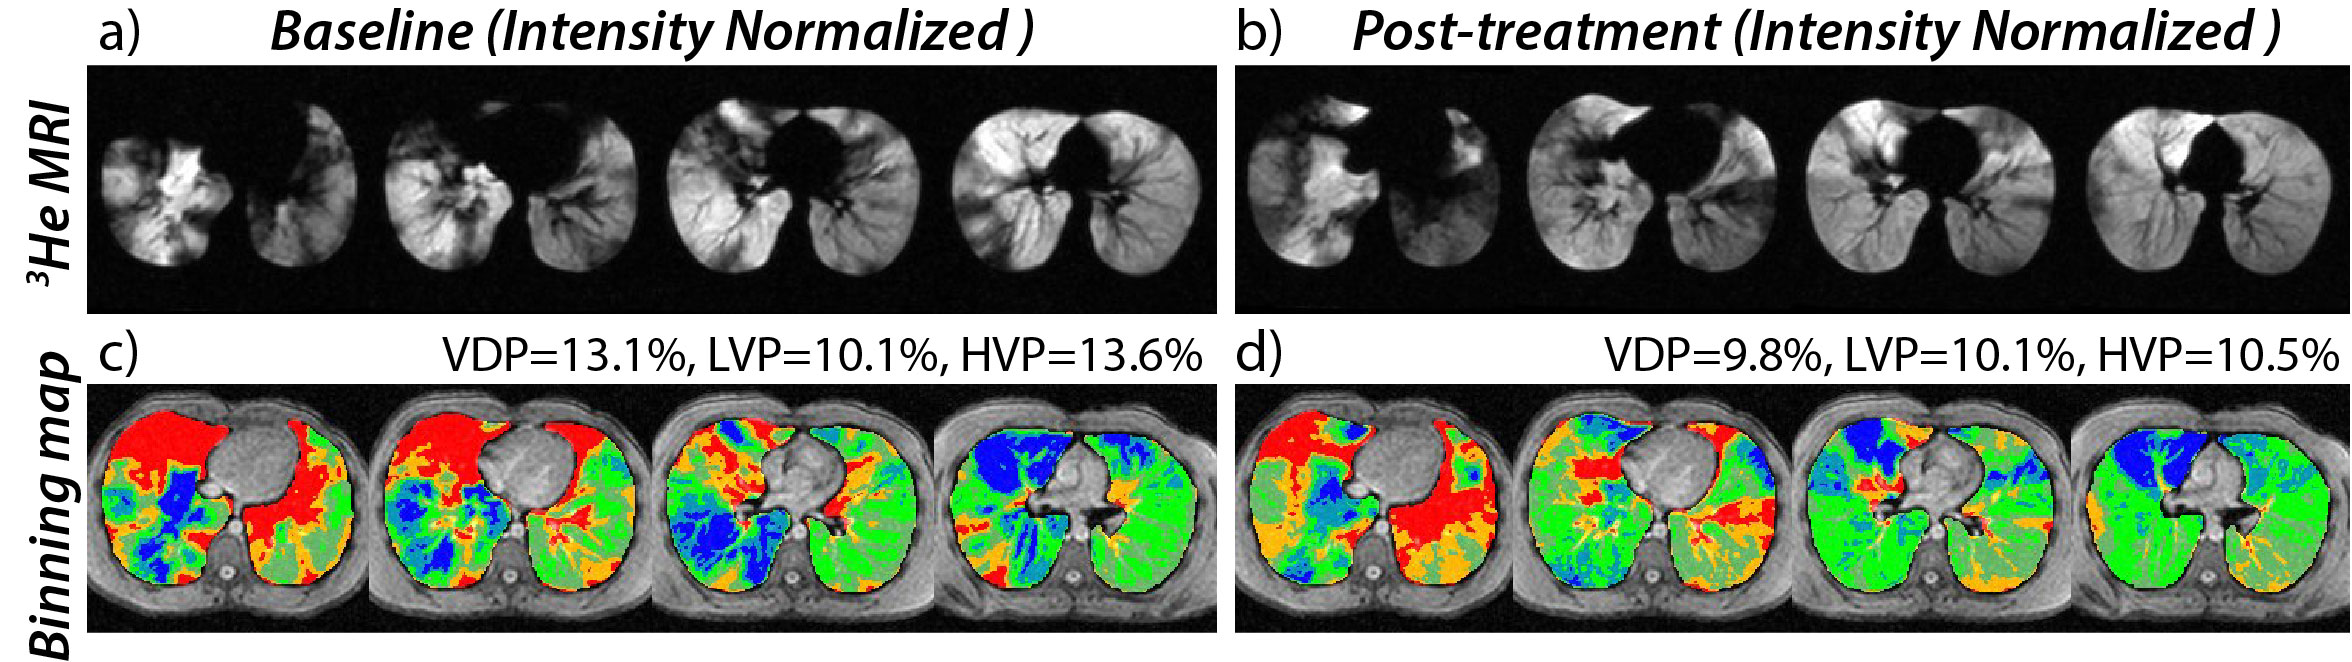
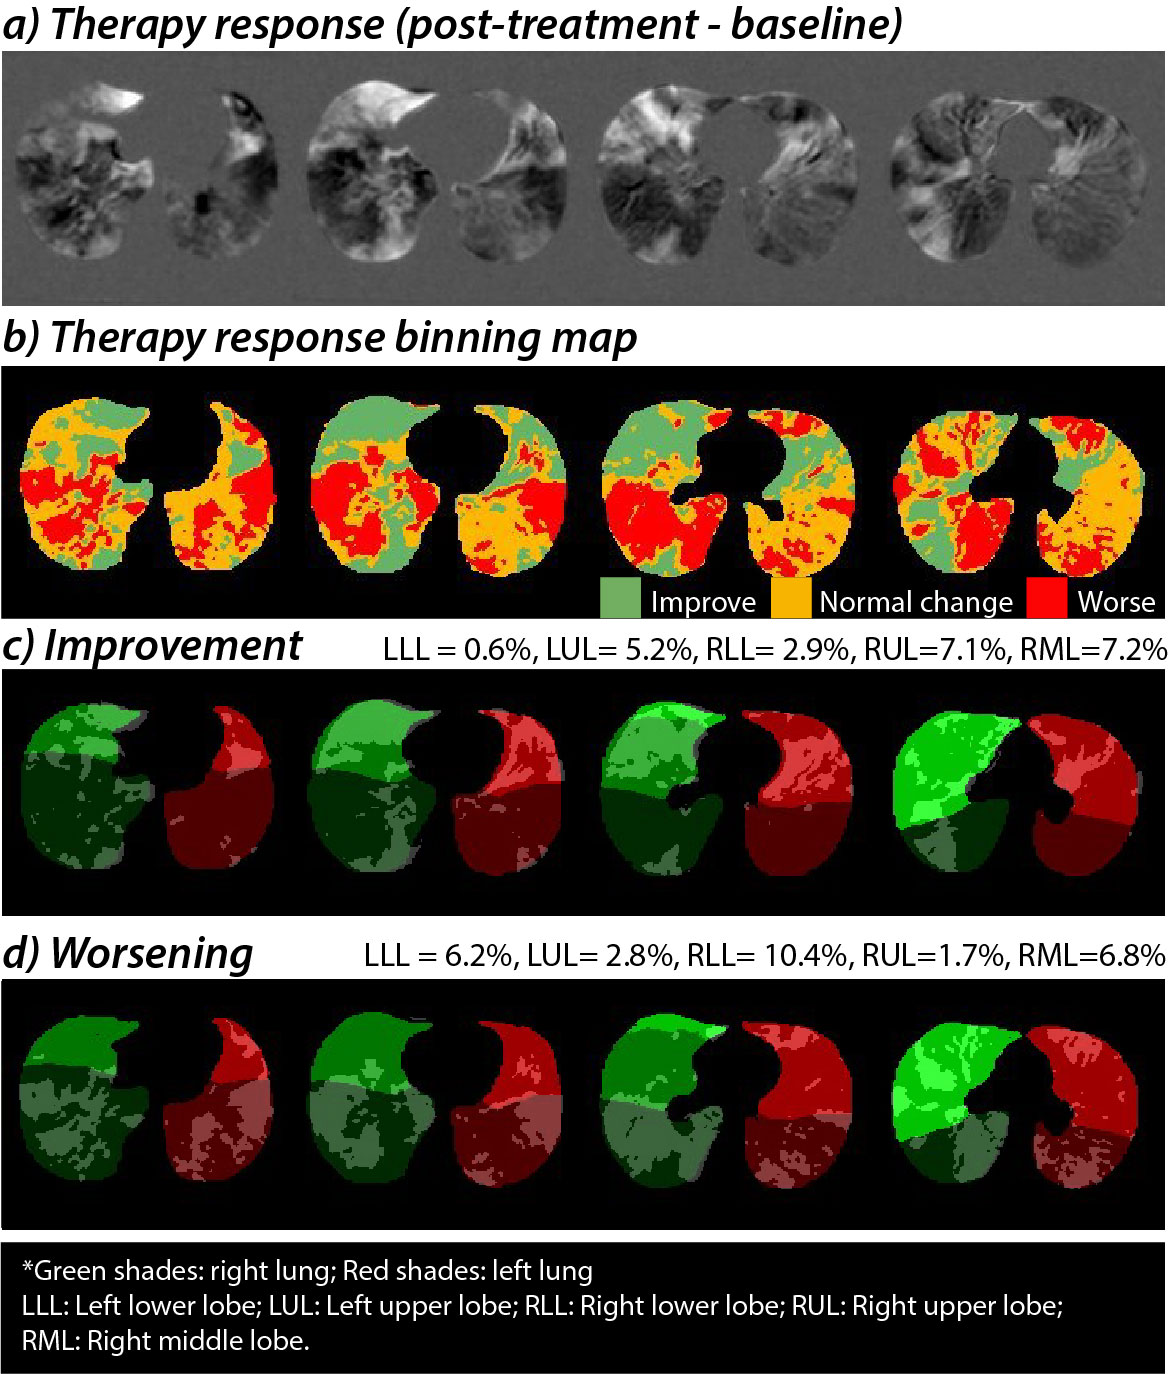
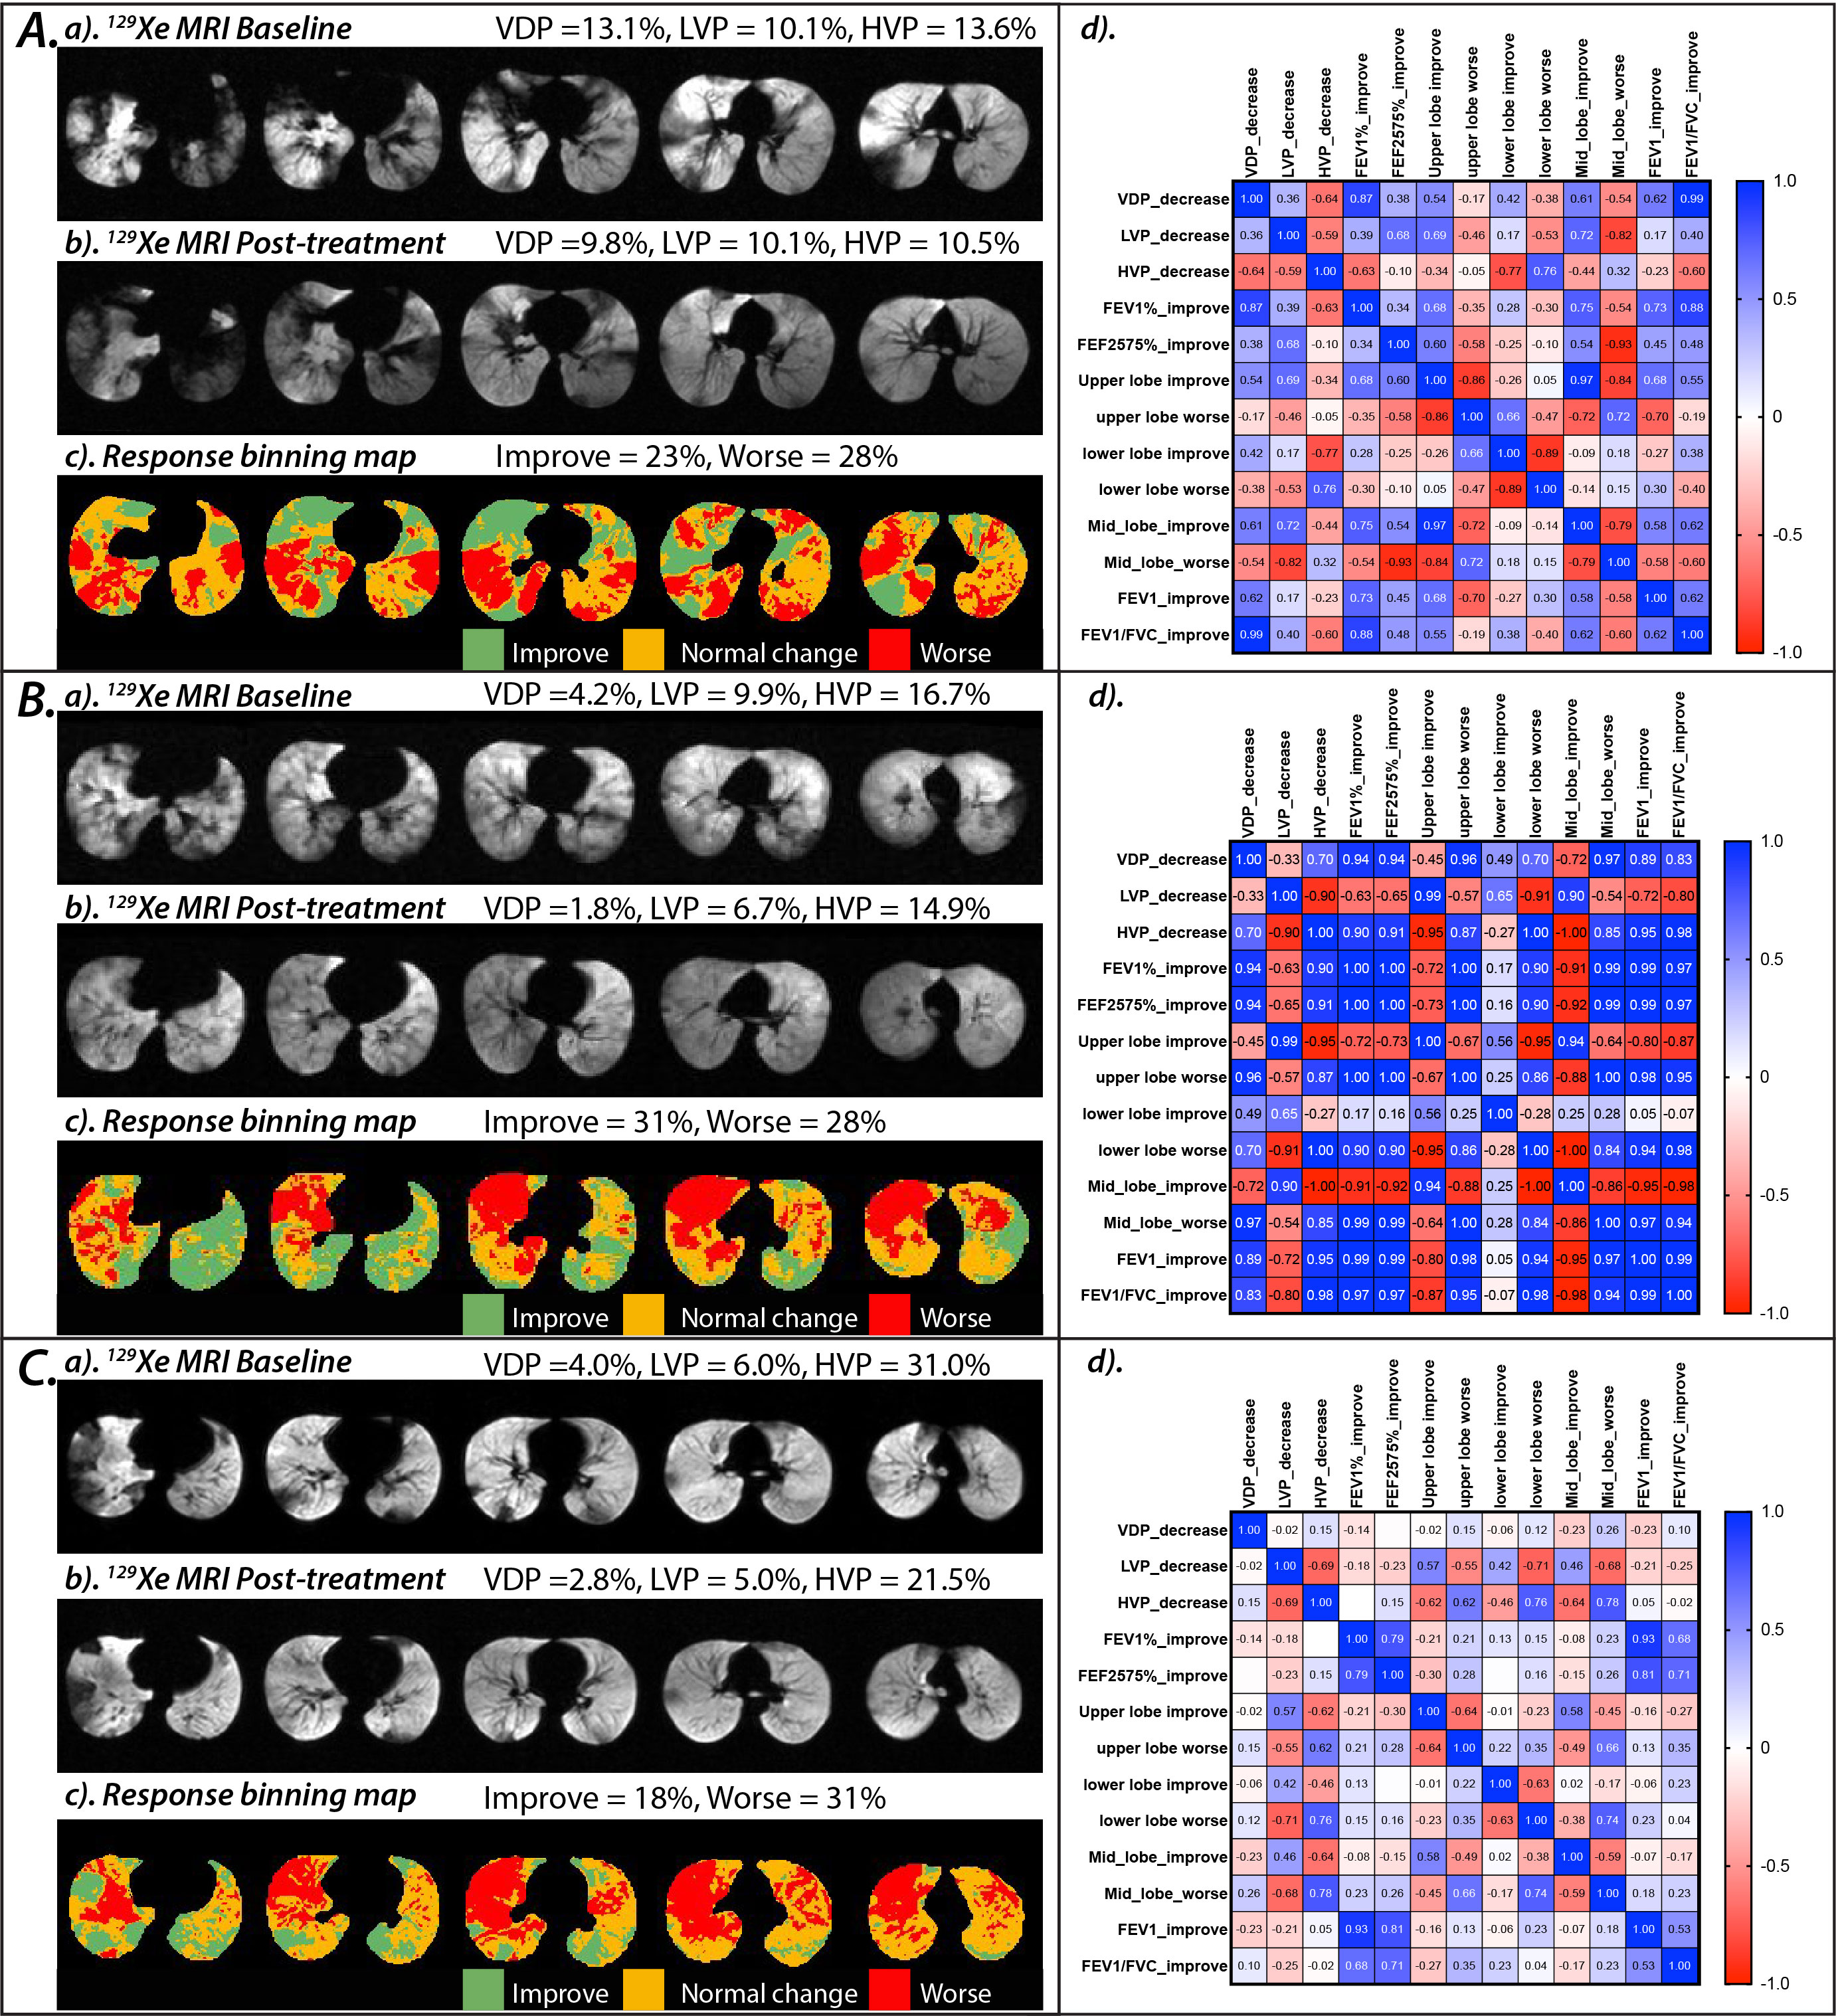
After intensity normalization, the difference in the background noise between the normalized serial scans was 0.0±0.0. The averaged intensity histogram for the healthy controls has a mean of 0.54 and a standard deviation of 0.19. The resulting thresholds for the 3He ventilation scan were then [0.16, 0.35, 0.54, 0.73, 0.92]. A representative case is shown in Figure 1 using the linear binning classification with the updated thresholds. At the baseline evaluation, this patient has VDP=13.1%, LVP=10.1%, and HVP=13.6%. After bronchodilator therapy, ventilation improved to VDP=9.8%, LVP=10.1%, and HVP= 10.5%. Over the control cohort, 95% of the averaged therapy response intensity distribution (±2SD away from zero) yielded a normal intensity variation range of -0.1 to 0.1 (colored in orange). The binning classification of the therapy response map is illustrated in Figure 2, which shows that all key dynamic features are depicted. Overall, asthmatic patients with bronchodilator response (Group A) demonstrated significant improvement in VDP (p=0.02) and LVP (p=0.03) following bronchodilator therapy. Improvement in VDP was observed in upper (FEV1: r =0.7, FEV1/FVC: r= 0.6) and middle lobes (FEV1: r =0.8, FEV1/FVC: r= 0.6), correlating with improvement in FEV1 and FEV1/FVC (Figure 3A-d). In patients without bronchodilator response (Group B), no significant improvement in FEV1 and FEV1/FVC was observed. Further, regions of low and absent ventilation worsened in response to therapy, while regions of hyperventilation increased (Figure 3B-d). Asthmatic patients without clinical obstruction or bronchodilator response (Group 3C) demonstrated a variable 3He MRI ventilation response to bronchodilator (Figure 3C-d).Conclusions and Discussion
We found that in asthmatics with clinical bronchodilator response, improved 3He ventilation was observed globally, with the most significant improvement in upper and middle lobes. These results are consistent with earlier observations of inhaled agents favoring upper lobar distribution. In asthmatics with airway remodeling and no bronchodilator response, lobar analysis suggested ventilation actually worsened in regions with baseline ventilation defects and increased in hyperventilated regions. Finally, in asthmatics without clinical obstruction or bronchodilator response, variable regional 3He airflow changes and ventilation response to bronchodilator were observed. These findings support that asthma has a heterogeneous distribution in the lung; further investigation is needed to better define the various endotypes in asthma. HP 3He MRI is a valuable tool for characterizing the physiologic changes within the lung following bronchodilator treatment.Acknowledgements
This work supported by National Heart, Lung, and Blood Institute of the National Institutes of Health (grant no. RO1 HL66479)References
1. He, M., Driehuys, B., Que, L. & Huang, Y.-C. T. Using Hyperpolarized 129Xe MRI to Quantify the Pulmonary Ventilation Distribution. Acad Radiol (2016).
2. Svenningsen, S. et al. Hyperpolarized He-3 and Xe-129 MRI: Differences in Asthma Before Bronchodilation. J Magn Reson Imaging 38, 1521-1530 (2013).
3. Tustison, N. J. et al. N4ITK: improved N3 bias correction. IEEE Trans Med Imaging 29, 1310-1320, doi:10.1109/TMI.2010.2046908 (2010).
4. Nyul, L. G. & Udupa, J. K. On standardizing the MR image intensity scale. Magnetic resonance in medicine : official journal of the Society of Magnetic Resonance in Medicine / Society of Magnetic Resonance in Medicine 42, 1072-1081, doi:10.1002/(sici)1522-2594(199912)42:6<1072::aid-mrm11>3.0.co;2-m (1999).
5. He, M., Driehuys, B., Que, L. G. & Huang, Y.-C. T. Using hyperpolarized 129Xe MRI to quantify the pulmonary ventilation distribution. Academic radiology 23, 1521-1531 (2016).
6. He, M. et al. Extending semiautomatic ventilation defect analysis for hyperpolarized (129)Xe ventilation MRI. Acad Radiol 21, 1530-1541, doi:10.1016/j.acra.2014.07.017 (2014).
7. Tustison, N. J., Qing, K., Wang, C., Altes, T. A. & Mugler, J. P., 3rd. Atlas-based estimation of lung and lobar anatomy in proton MRI. Magn Reson Med 76, 315-320, doi:10.1002/mrm.25824 (2016).
Figures