0443
A Model for Interpreting Hyperpolarized 129Xe Gas Exchange MRI1Duke University, Durham, NC, United States, 2Mayo Clinic, Rochester, MN, United States
Synopsis
Hyperpolarized 129Xe gas exchange (GX) MR imaging of pulmonary ventilation, barrier uptake and red blood cell (RBC) transfer has shown sensitivity to a wide range of pathology. However, the physiological interpretation of regional RBC transfer defects is not yet fully established and its connection to conventional measures has yet to be studied in a broad range of pathology. Here we evaluate the extent to which 129Xe RBC transfer reflects local perfusion, by testing its spatial correlation to 99mTc scintigraphy and propose a generalized model connecting 129Xe gas exchange metrics to the membrane and capillary blood volume components of DLCO.
Introduction
Hyperpolarized 129Xe MRI has emerged as a powerful means to image pulmonary gas exchange (GX), with its ability to provide 3D non-invasive mapping of ventilation, barrier uptake and red blood cell (RBC) transfer1. Prior work has shown 129Xe RBC transfer to be sensitive to a broad range of pathology2. Initial application to healthy and IPF subjects suggested the ratio of RBC:barrier correlates strongly with the clinical measure of gas exchange — DLCO3. However, the physiological interpretation of regional RBC transfer remains to be established. Moreover, the simple RBC-barrier ratio does not account for factors such as emphysematous loss of membrane conductance or accessible alveolar volume VA. Thus, we sought to develop a comprehensive means to interpret 129Xe MRI across a broad range of pathology. First, we evaluate the extent to which 129Xe RBC transfer imaging reflects local perfusion by testing its spatial correlation to 99mTc scintigraphy. Second, we propose a generalized model that uses 129Xe GX MRI to reveal both the membrane and capillary blood volume conductance contributions to the transfer coefficient KCO. We then use the ventilation images to estimate accessible alveolar volume VA, and thereby calculate the diffusing capacity DLCO.Methods
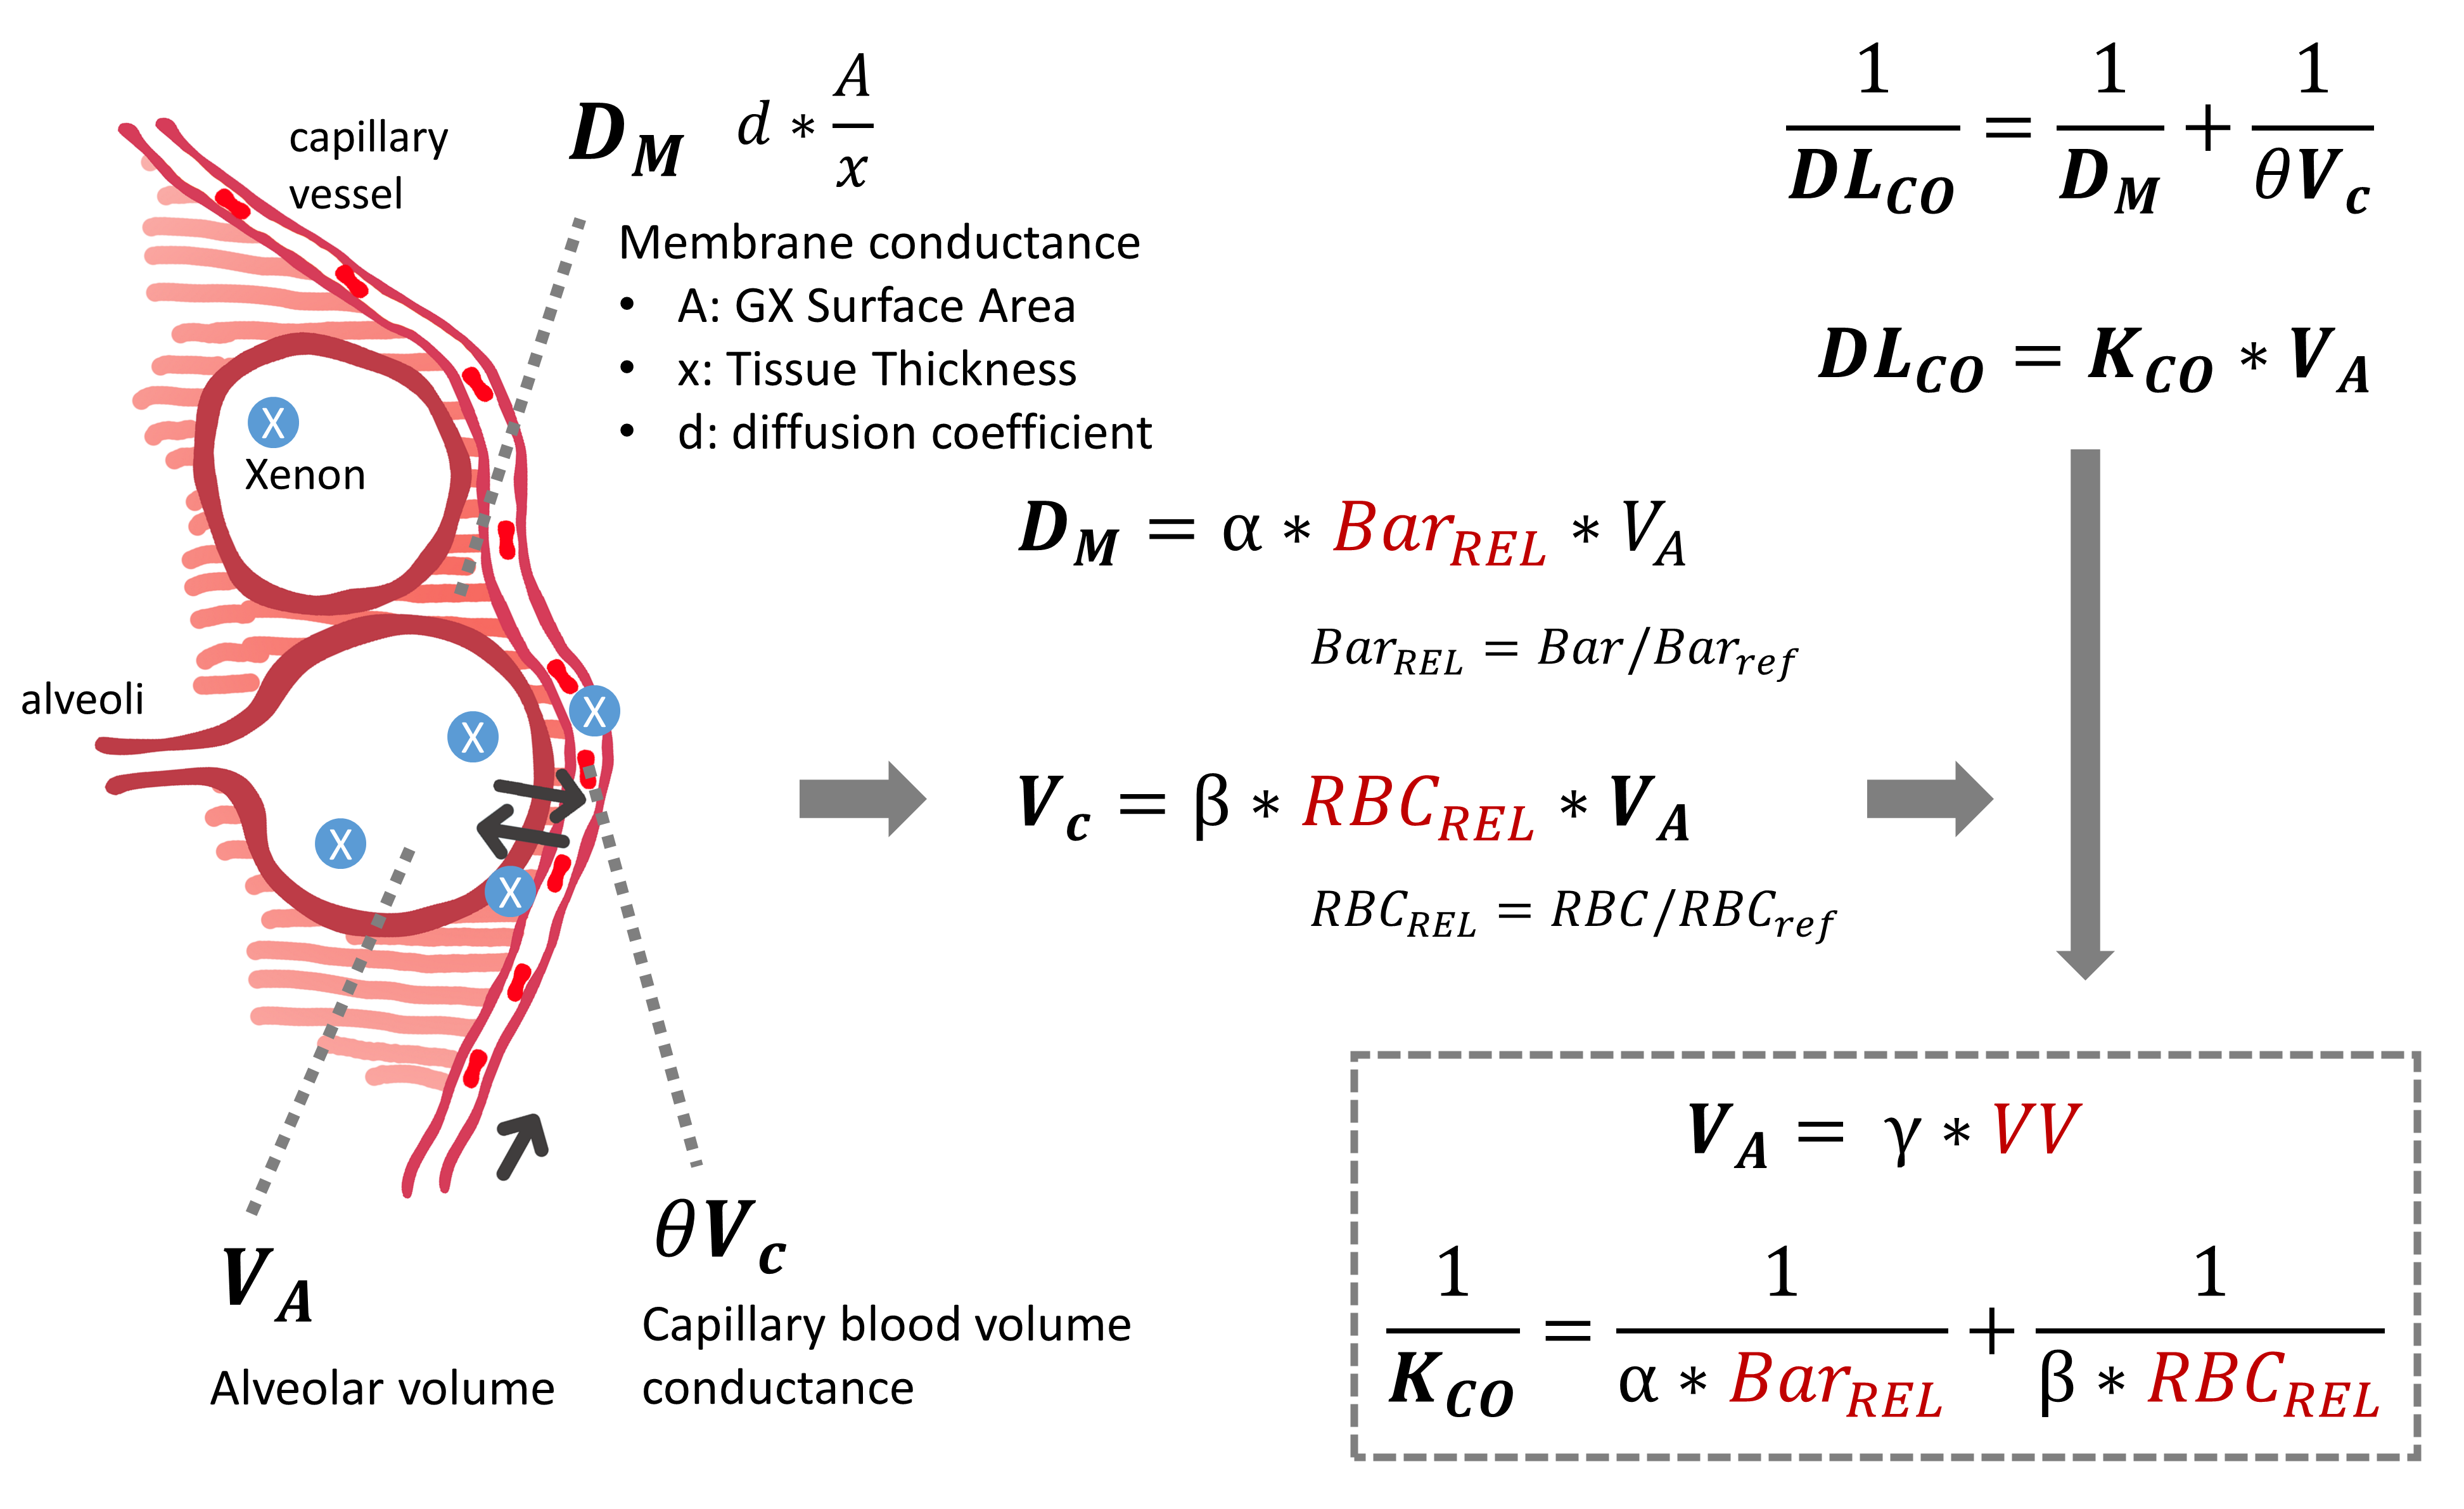
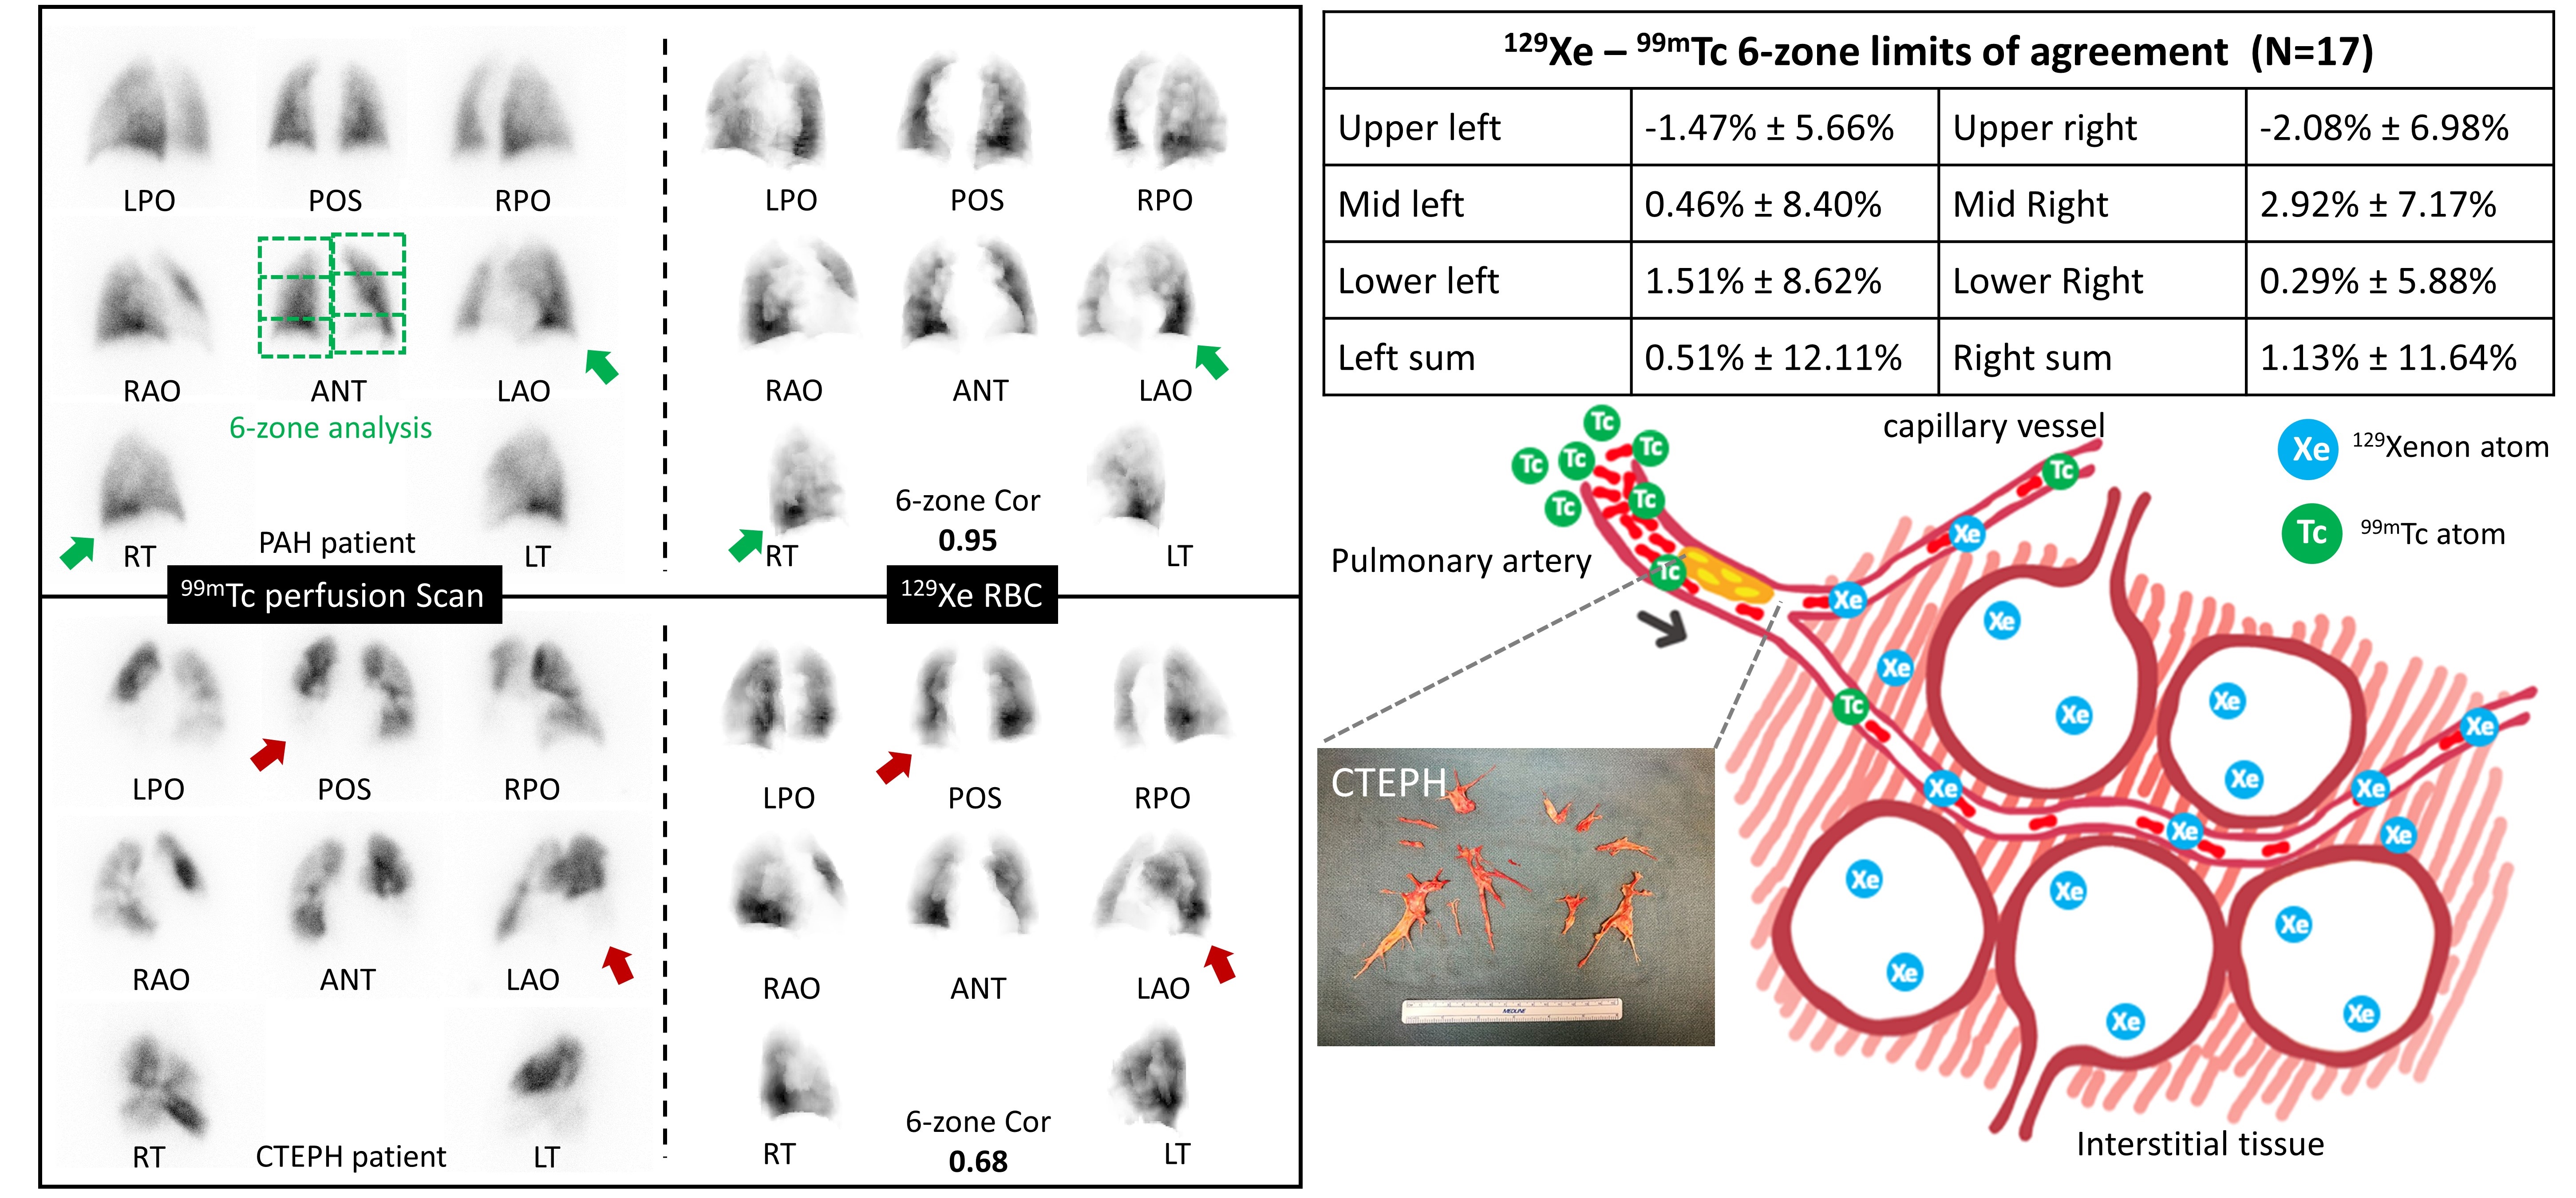
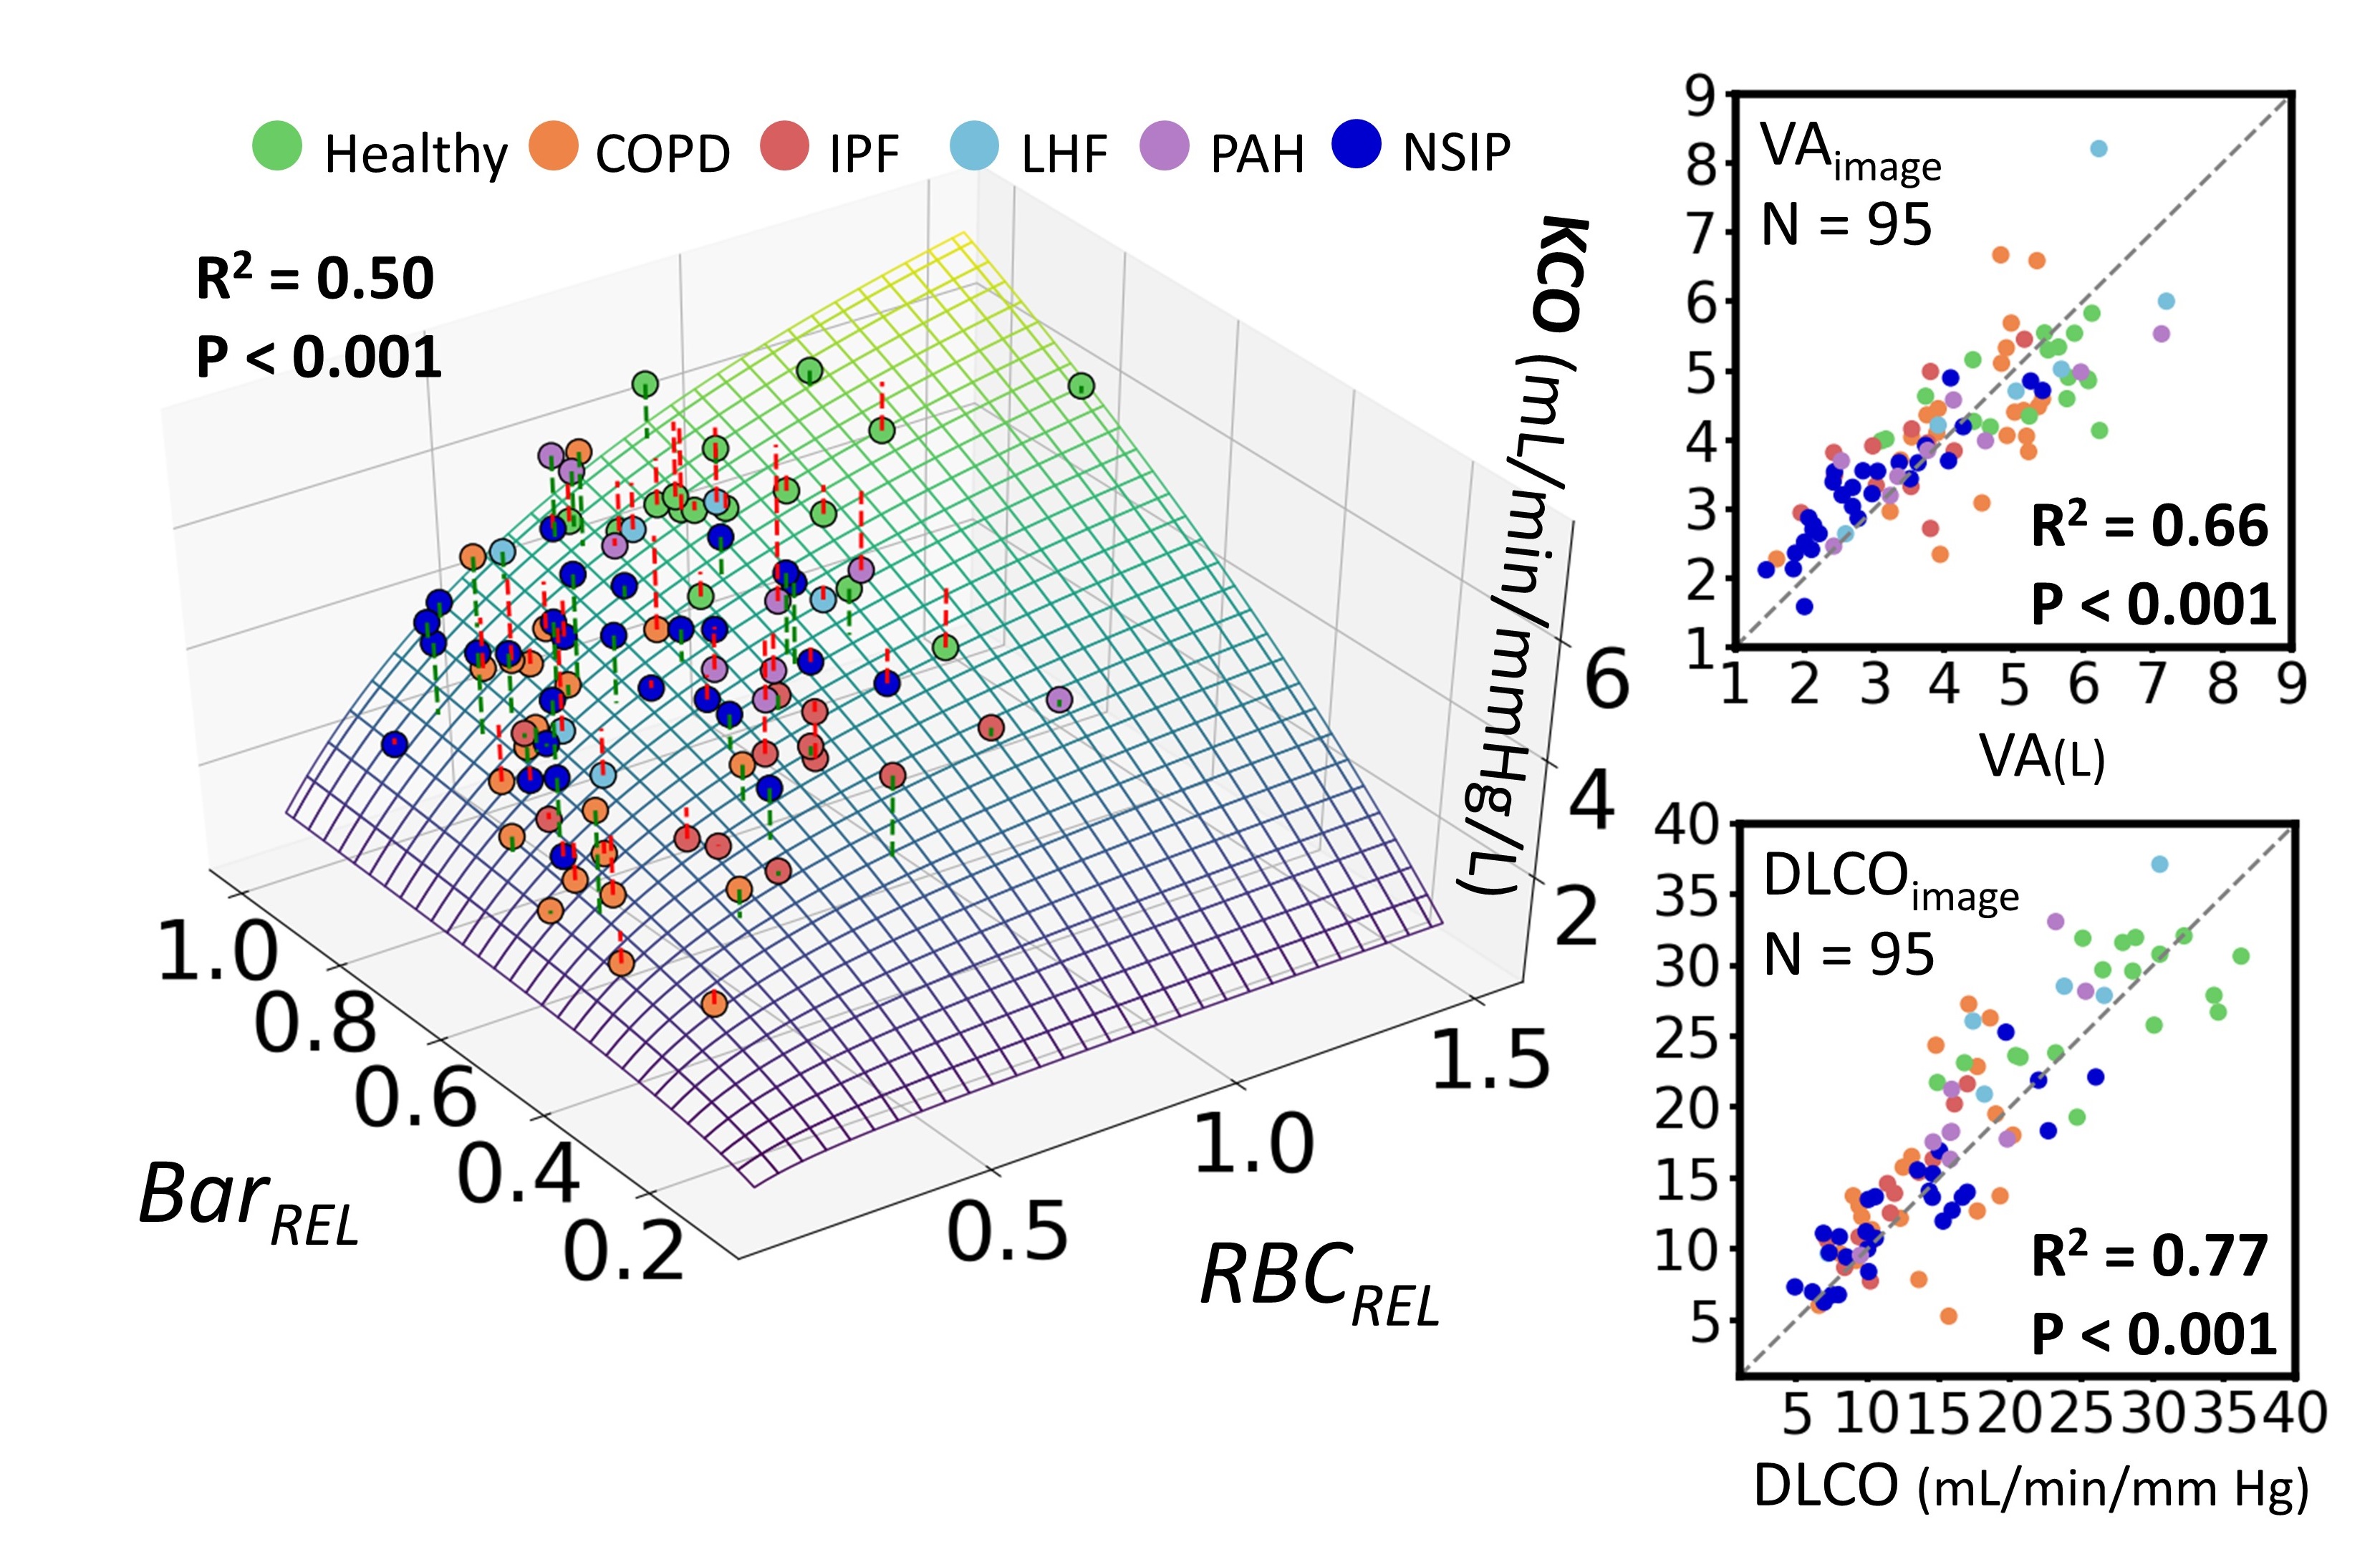
We analyzed 17 patients who had 99mTc scintigraphy within 9 months of 129Xe MRI: 2 with chronic obstructive pulmonary disease (COPD), 6 chronic thromboembolic pulmonary hypertension (CTEPH), 5 pulmonary arterial hypertension (PAH), 1 left heart failure (LHF) and 3 with unknown dyspnea. 129Xe MRI produced 3D maps of ventilation, barrier uptake and RBC transfer. RBC images were rendered into conventional planar projections used for 99mTc perfusion, by applying attenuation from lung parenchyma and body tissues. The averaged coronal RBC projection was quantitatively compared to the geometric means of the anterior and posterior 99mTc scans using 6-zone analysis. This framework reports the functional contributions of each zone and allows calculation of a Pearson correlation coefficient (R2) between modalities as well as Bland-Altman plots to evaluate the limits of agreement (95% confidence intervals) for each zone.A generalized model to estimate DLCO from 129Xe MRI was developed based on 95 subjects who had DLCO testing and high-quality 129Xe MRI available. This included: 17 healthy, 21 COPD, 13 IPF, 29 nonspecific interstitial pneumonia (NSIP), 6 LHF, and 9 PAH. Using the framework of Roughton and Forster4 (Figure 1), we propose that image-derived mean values of 129Xe barrier uptake and RBC transfer reflect the membrane conductance DM and capillary blood volume Vc respectively. Therefore, KCO can be represented as KCO = (α*BarREL-1+β*RBCREL-1)-1 , where α and β are coefficients. BarREL and RBCREL are calculated by dividing the patient’s mean value by that of the healthy reference cohort. Specifically, the inverse of BarREL is used when it exceeds unity, as in patients with interstitial lung diease3, allowing it to convey both alveolar surface area and membrane thickness aspects of DM. Image-derived DLCO is then calculated with VA estimated from the ventilation volume VV using VA = γ*VV.
Results
Figure 2 (left) shows 99mTc and 129Xe-RBC projections in a PAH patient and a CTEPH patient. The two modalities agreed well in the PAH patient. In contrast, the CTEPH patient showed absent lobes on the perfusion scintigraphy, that nonetheless exhibit signal on 129Xe projections. Over the entire cohort, the two modalities demonstrated strong correlation (R2=0.84±0.14), while individual zones exhibited negligible bias between modalities (within 3%), and limits of agreement within 10%.The DLCO model was fit across the entire cohort (N=95) to determine the coefficients: α=11.2, β=14.6 mL/min/mmHg/L, and γ=1.43. Figure 3 shows a 3D surface of the image-estimated KCO as a function of BarREL and RBCREL, compared to the clinically measured values. The associated graphs show that image estimated VA correlates well with the measured value (R2=0.66, p<0.001). Combining these to generate image estimated DLCO shows a good correlation (R2=0.77, p<0.001) with the clinical measurements.
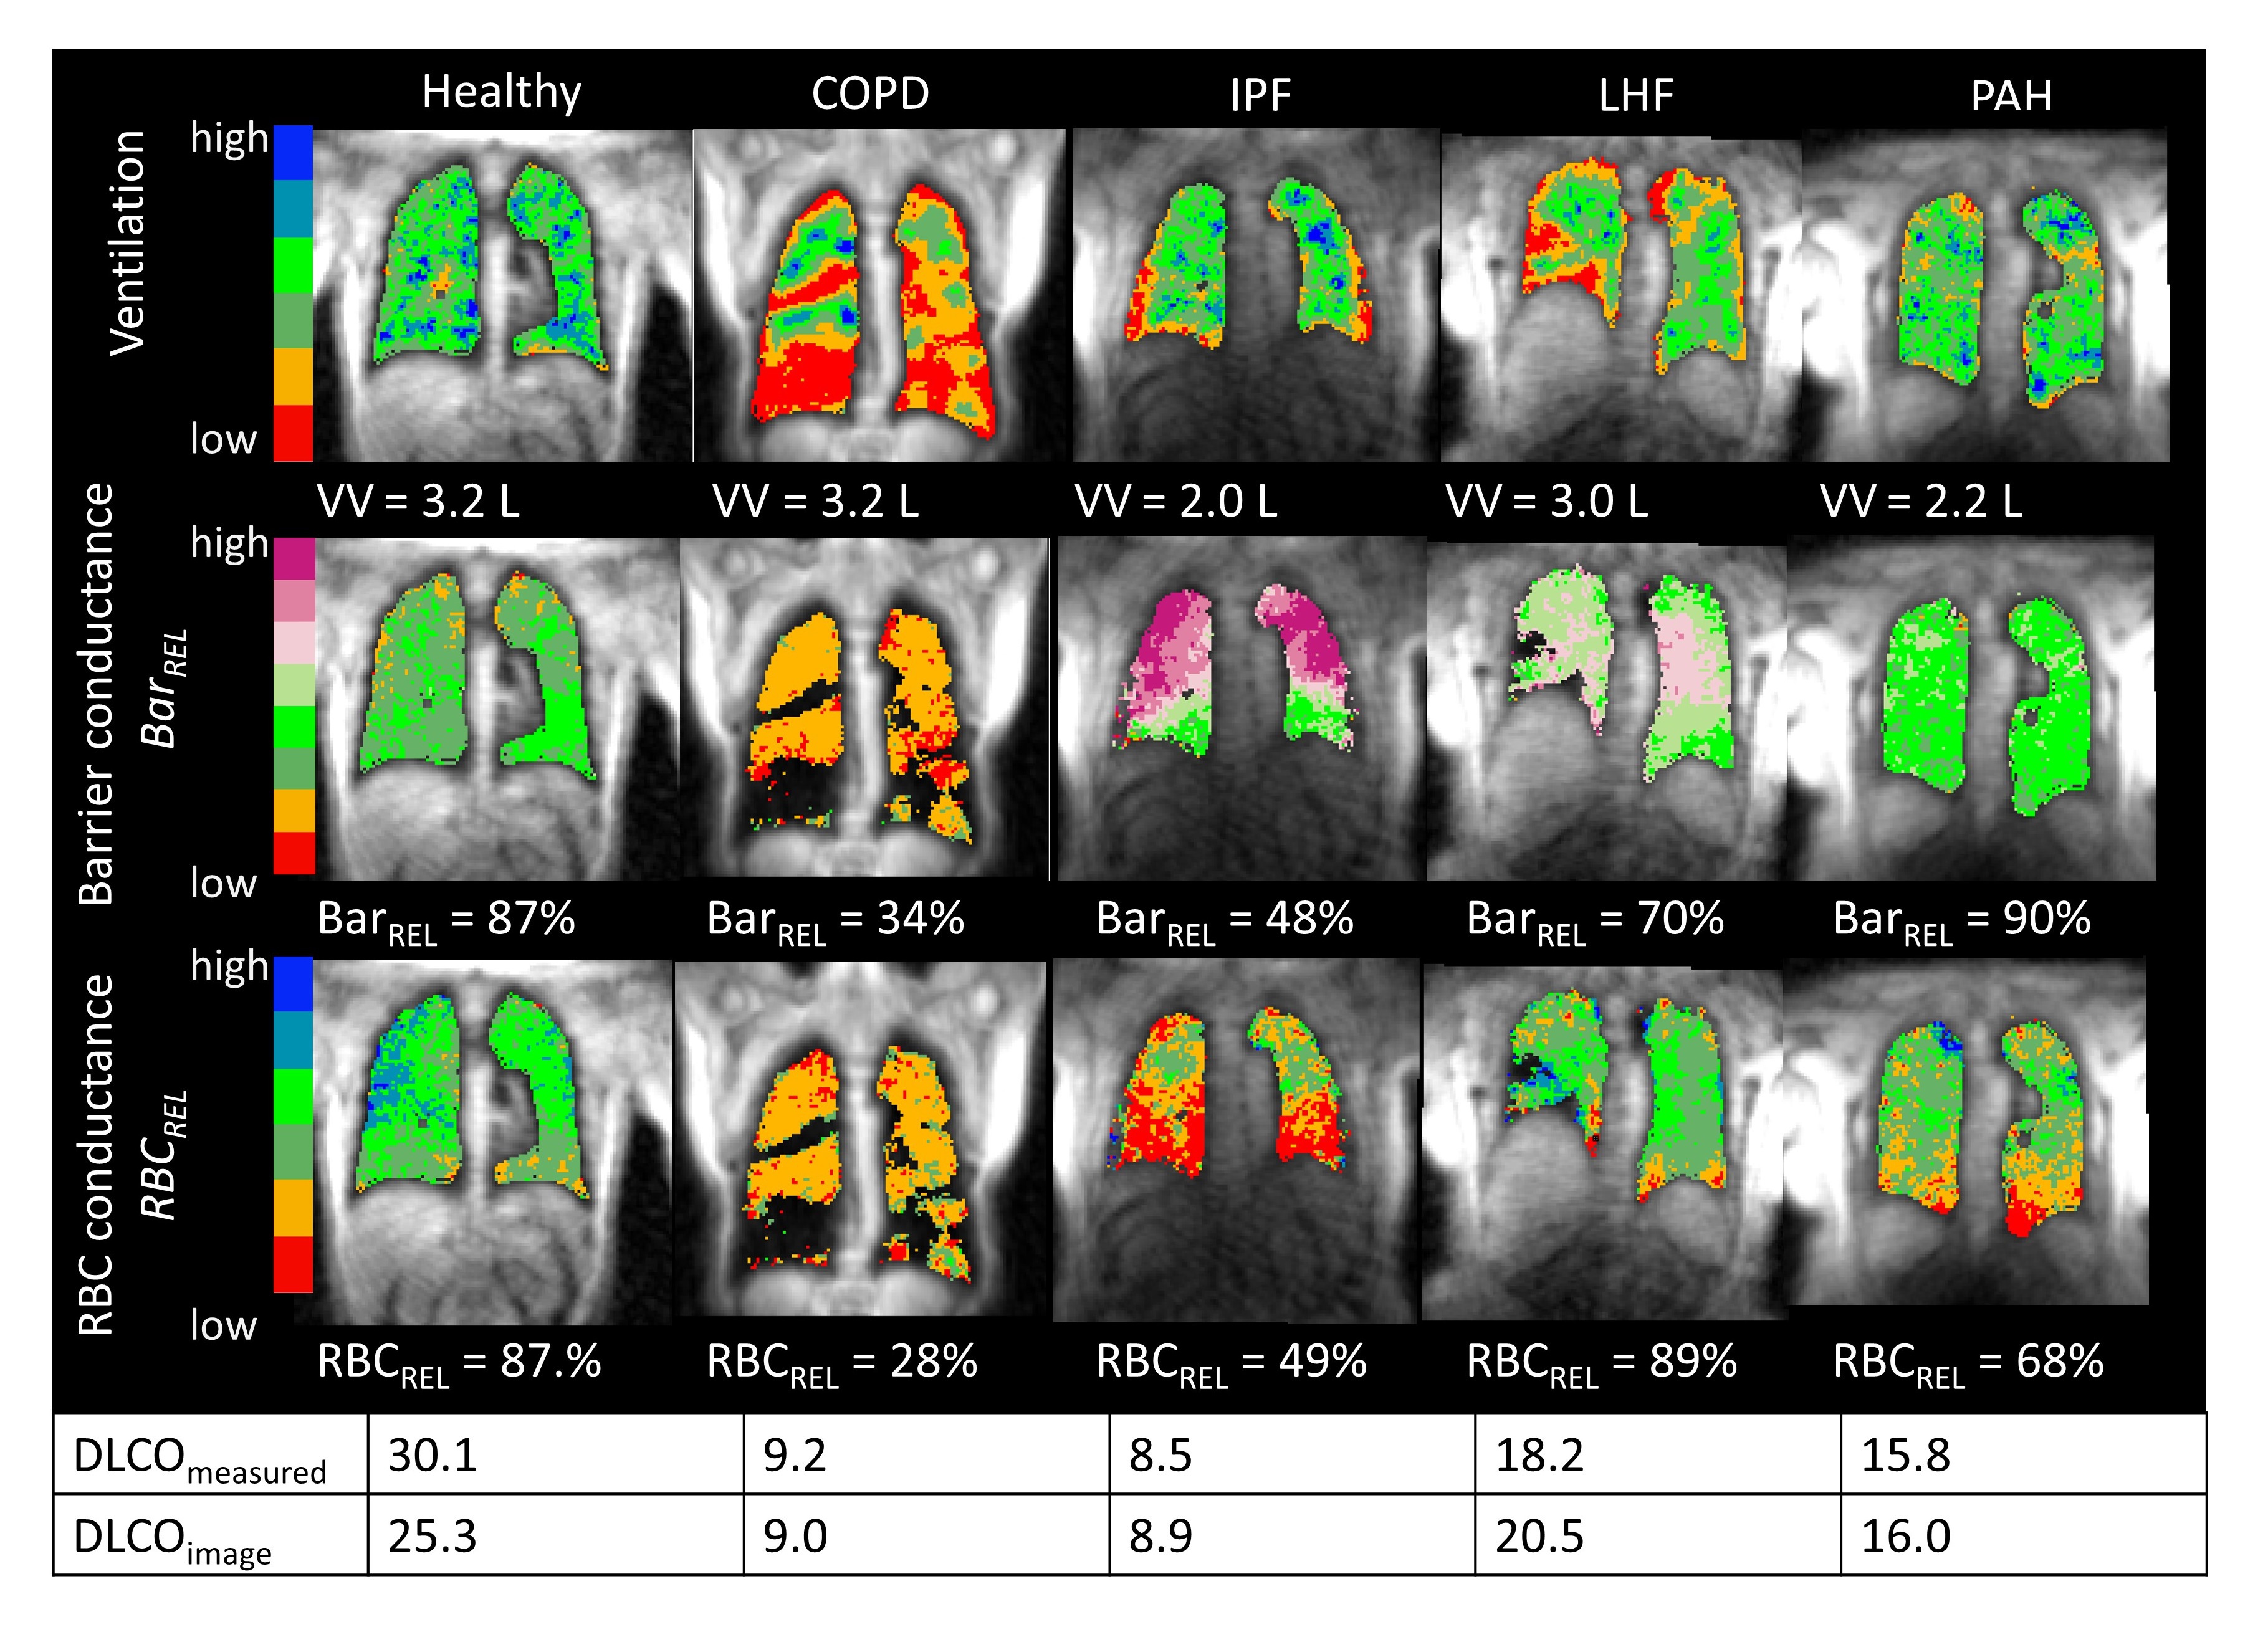
Figure 4 shows the application of this model to images of representative subjects. Compared to the healthy subject, all patients exhibit diminished DLCO resulting from different combination of reduced VA (IPF, LHF, PAH), decreased barrier uptake due to emphysema, increased barrier uptake (IPF, LHF), and diminished RBC transfer.
Discussion and Conclusion
While 99mTc and 129Xe-RBC agree well in most cases, an explanation for the poor agreement in CTEPH patients is proposed (Figure 2). In these patients, occlusion of the larger pulmonary arteries reduces flow, and therefore limits delivery of 99mTc to the capillary bed. However, if the capillary bed remains viable, it will remain filled with blood and thereby allow 129Xe RBC transfer through interstitial diffusion5. Thus, while well-perfused regions will show good RBC transfer, and destruction of capillary bed will decrease both, partial occlusion of large vessels can lead to significant mismatch between 99mTc and 129Xe-RBC imaging. (It is notable that DLCO can be normal in CTEPH patients5).This interpretation is further supported by our DLCO model, which connects to all aspects of 129Xe MR imaging. Importantly, it suggests that 129Xe imaging permits decomposing both the membrane conductance and capillary blood volume aspects of gas exchange, as well as resolving it 3-dimensionally.
This effort towards establishing a framework for interpreting 129Xe RBC transfer imaging will benefit from further verification using well-controlled animal studies.
Acknowledgements
This work was supported by the NIH (R01-HL-105643, R01-HL-126771 and HHSN268201700001C).References
1. Kaushik, S. S.; Robertson, S. H.; Freeman, M. S.; He, M.; Kelly, K. T.; Roos, J. E.; Rackley, C. R.; Foster, W. M.; McAdams, H. P.; Driehuys, B., Single-Breath Clinical Imaging of Hyperpolarized (129)Xe in the Airspaces, Barrier, and Red Blood Cells Using an Interleaved 3d Radial 1-Point Dixon Acquisition. Magn Reson Med 2016, 75, 1434-43.
2. Wang, Z.; Bier, E. A.; Swaminathan, A.; Parikh, K.; Nouls, J.; He, M.; Mammarappallil, J. G.; Luo, S.; Driehuys, B.; Rajagopal, S., Diverse Cardiopulmonary Diseases Are Associated with Distinct Xenon Mri Signatures. Eur Respir J 2019.
3. Wang, J. M., et al., Using Hyperpolarized (129)Xe Mri to Quantify Regional Gas Transfer in Idiopathic Pulmonary Fibrosis. Thorax 2018, 73, 21-28.
4. Roughton, F. J.; Forster, R. E., Relative Importance of Diffusion and Chemical Reaction Rates in Determining Rate of Exchange of Gases in the Human Lung, with Special Reference to True Diffusing Capacity of Pulmonary Membrane and Volume of Blood in the Lung Capillaries. J Appl Physiol 1957, 11, 290-302.
5. Zoia, M. C.; D'Armini, A. M.; Beccaria, M.; Corsico, A.; Fulgoni, P.; Klersy, C.; Piovella, F.; Vigano, M.; Cerveri, I.; Pavia Thromboendarterectomy, G., Mid Term Effects of Pulmonary Thromboendarterectomy on Clinical and Cardiopulmonary Function Status. Thorax 2002, 57, 608-12.
Figures