0442
Binning method for treatment response mapping with hyperpolarized gas lung MRI: application in subjects with asthma1Department of Infection, Immunity & Cardiovascular Disease, University of Sheffield, Sheffield, United Kingdom
Synopsis
This work applies a clustering method developed for image analysis of hyperpolarised gas lung ventilation MRI to a cohort of patients referred from a severe asthma clinic for investigation of breathlessness. Patients underwent spirometry tests and imaging at baseline and after inhalation of Salbutamol to assess reversibility. In a subset of patients, images pre and post bronchodilator were registered and a novel treatment response mapping method was applied. Results show significant correlations at baseline between imaging markers and FEV1% and between their percentage changes and the reversibility testing. The treatment response mapping method offers additional robust additional insights.
Introduction
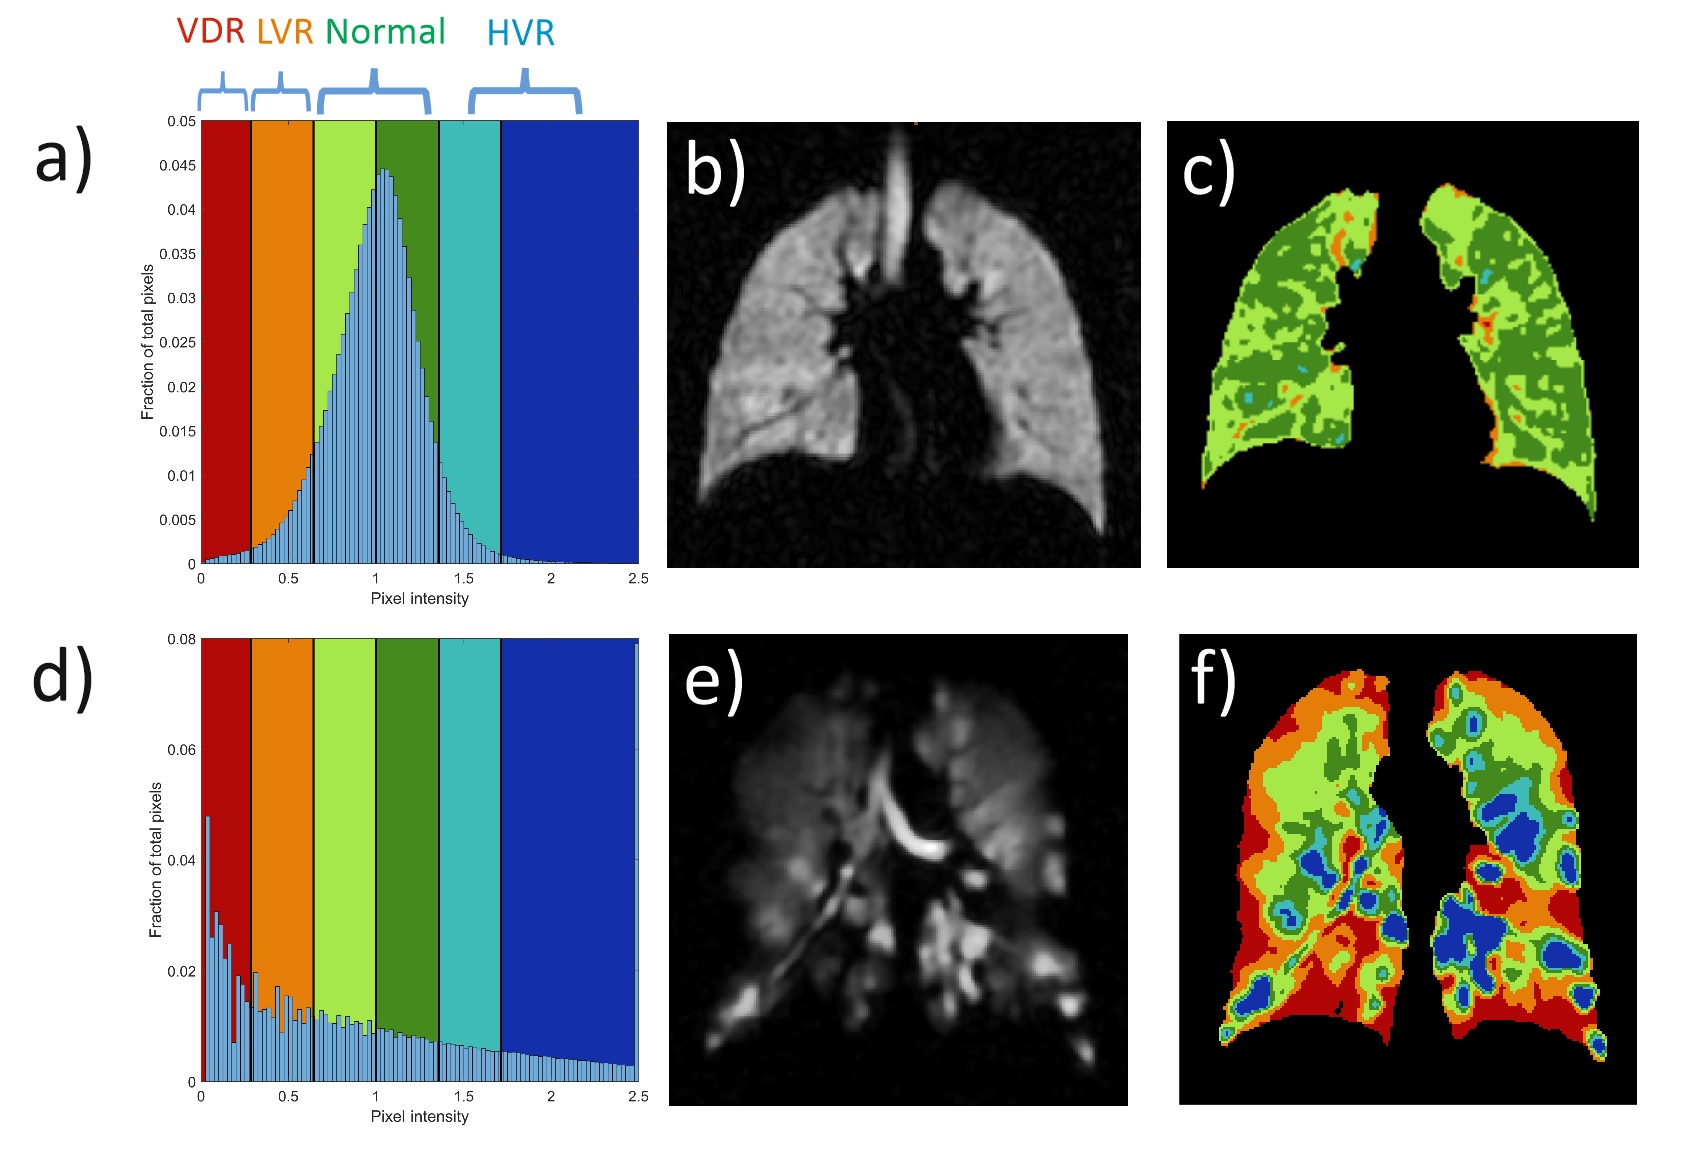
Pulmonary MR imaging with hyperpolarized (HP) 3He and 129Xe enables the direct visualization of gas distribution in the lungs and has been used to study the heterogeneity of regional ventilation and response to therapy in patients with asthma1,2. In an effort to quantify the ventilation distribution in its entirety, a clustering method producing linear binning maps has been proposed3,4. This method offers the advantage of defining not only ventilation defect regions (VDR: regions with no gas signal) but also regions of low ventilation (LVR), normal ventilation (NVR) and hyper ventilation (HVR). An alternative normalization method has been proposed that increases the reproducibility of ventilation categorization5. A treatment response mapping (TRM) method for HP gas imaging had been previously developed6, based on a strictly arithmetic approach, to study changes pre and post bronchodilator (BD) in patients with asthma. To overcome the difficulty in interpreting changes involving hyperventilated regions, this study proposes a novel TRM method that analyses the transitions between binning categories. It is applied to reversibility testing in patients with asthma.Methods
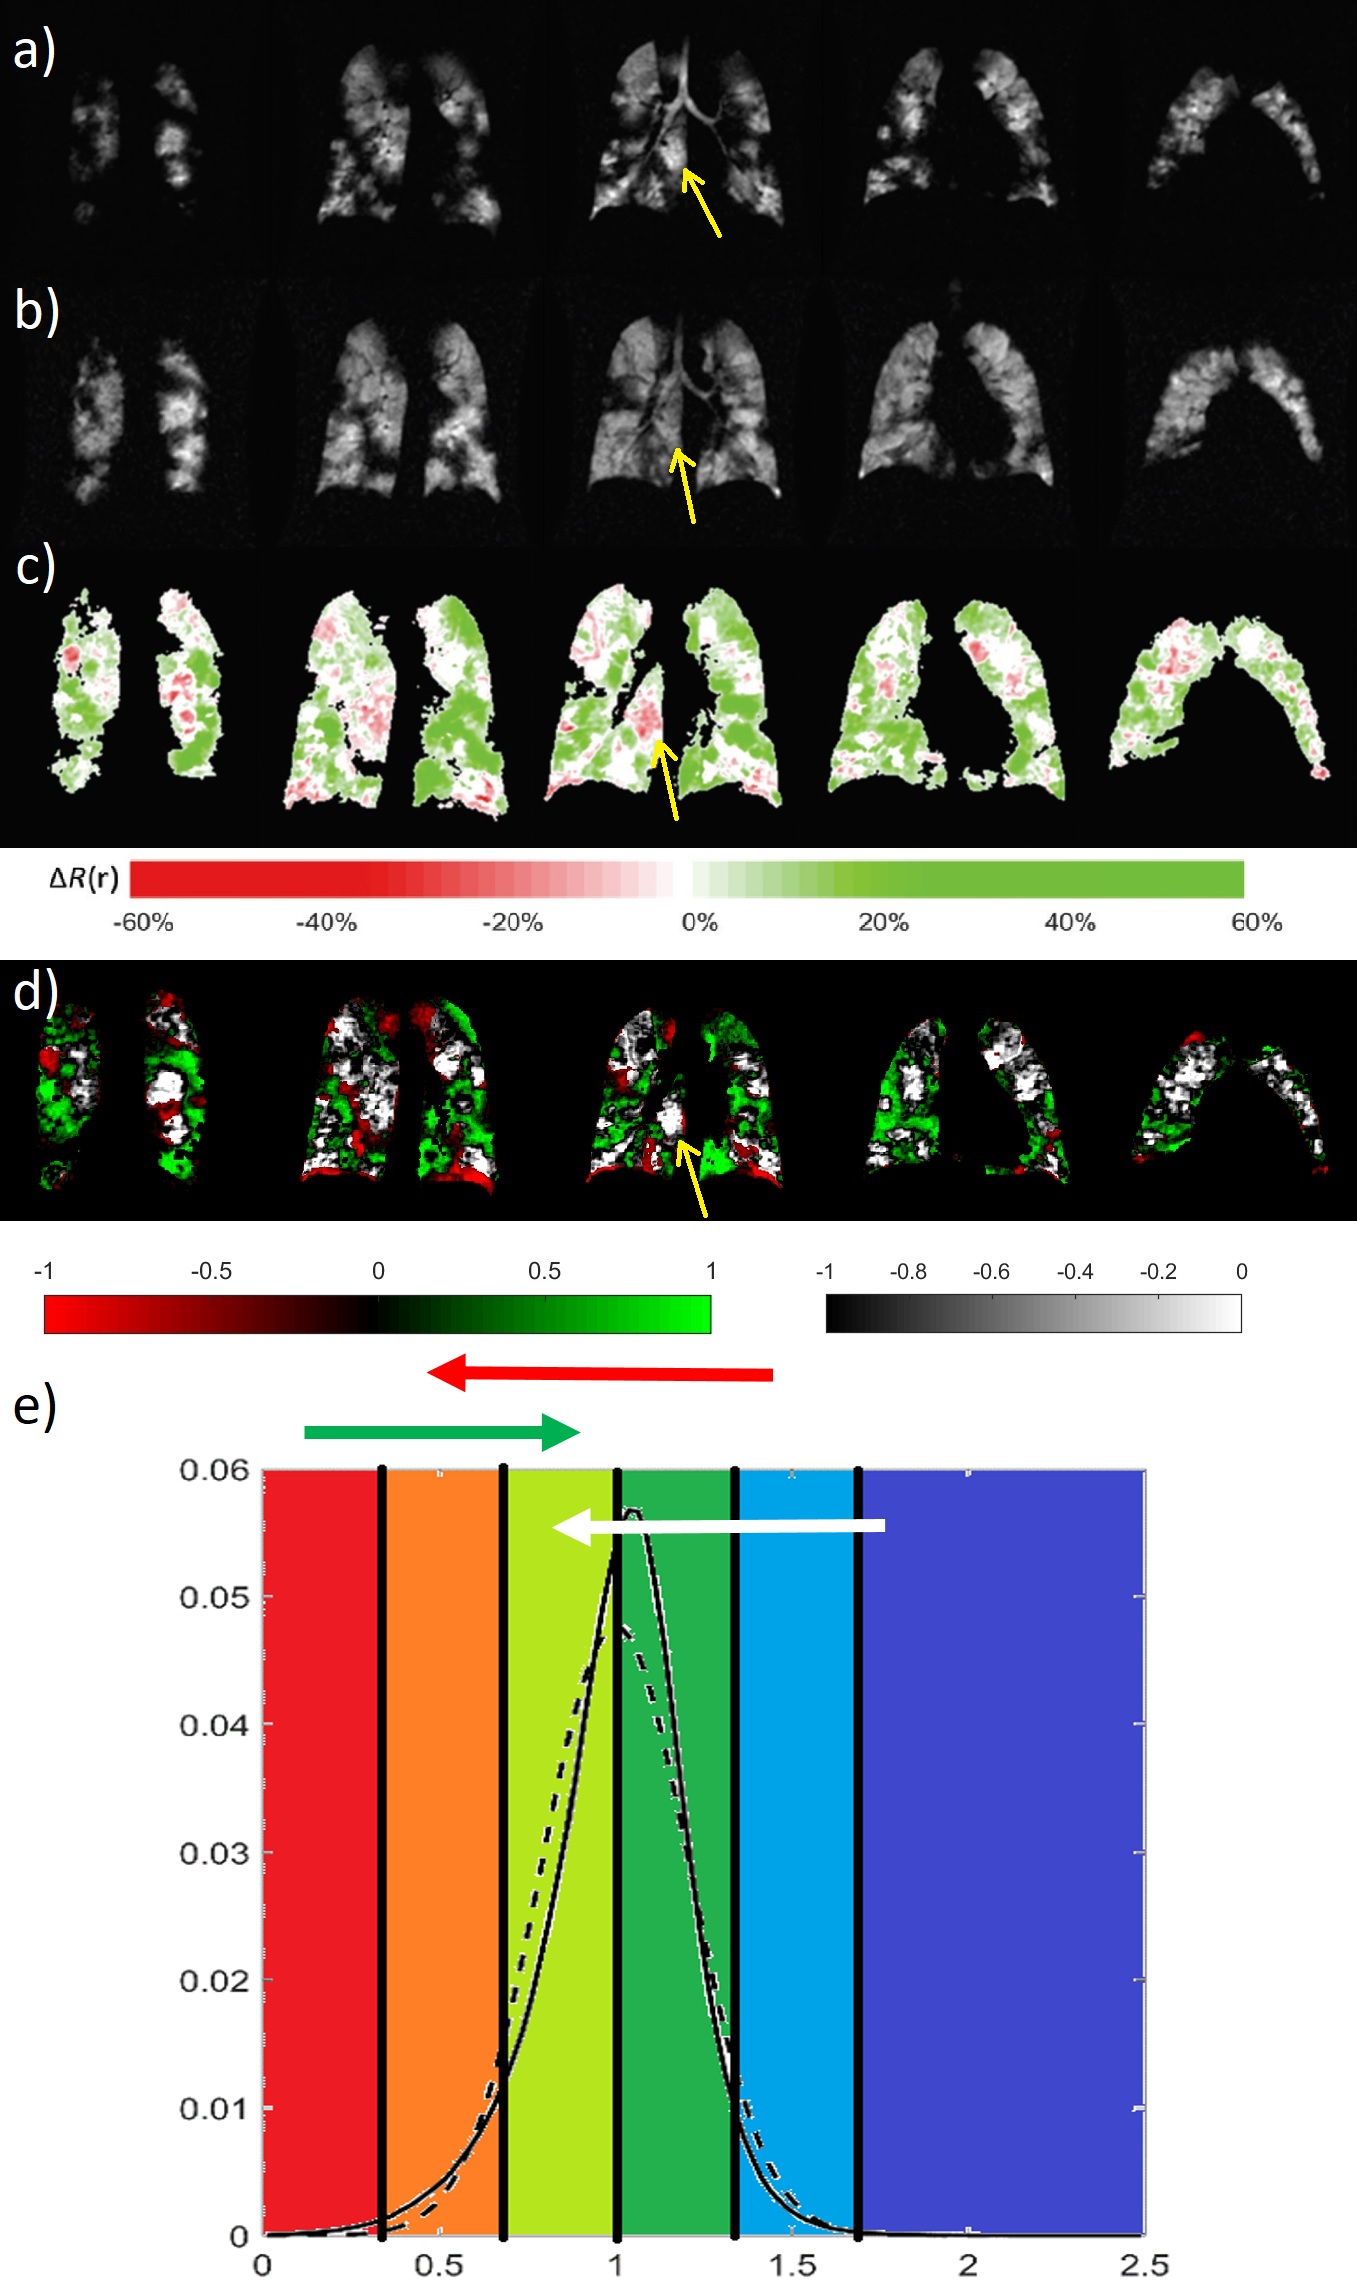
24 subjects referred from a severe asthma clinic for investigation of breathlessness were assessed with HP 129Xe MRI and spirometry at baseline and approximately 20 minutes after inhalation of 400μg of salbutamol. Prior to testing, patients were advised to withhold all inhalers on the morning of the scan. All imaging protocols were performed on a 1.5T GE HDx MR scanner. A dose of approximately 500mL of HP 129Xe at ~ 30% polarisation mixed with N2 up to 1L was used for ventilation imaging (3D steady state free precession 129Xe7 and spatially-matched 1H anatomical images). The binning method implemented has been described by Collier et al5. Briefly, the images are first corrected for bias field and normalized by the average 129Xe signal in the thoracic cavity. Threshold values previously optimised in cohorts of healthy volunteers are used to define different regions of ventilation (Fig. 1). Binning maps and histogram distribution of signal intensity were produced for each image. Percentage ventilation in the different bins and a global coefficient of variation (CV) of ventilation were derived. In a subset of 8 patients, an additional registration8 between baseline and post bronchodilator images was performed. Using a defined set of rules (Fig. 4.e), the intensity changes for each pixel were displayed in an outcome treatment response map as improvement, deterioration or irrelevant change. By summing the pertinent changes over the entire lung, a treatment response parameter TR expressed in mL of lung ventilation improvement was derived. TR was also expressed as a percentage of total thoracic cavity volume TR%. Spearman correlations at baseline between imaging parameters and FEV1% and correlations between percentage changes in FEV1 and imaging parameters were computed.Results
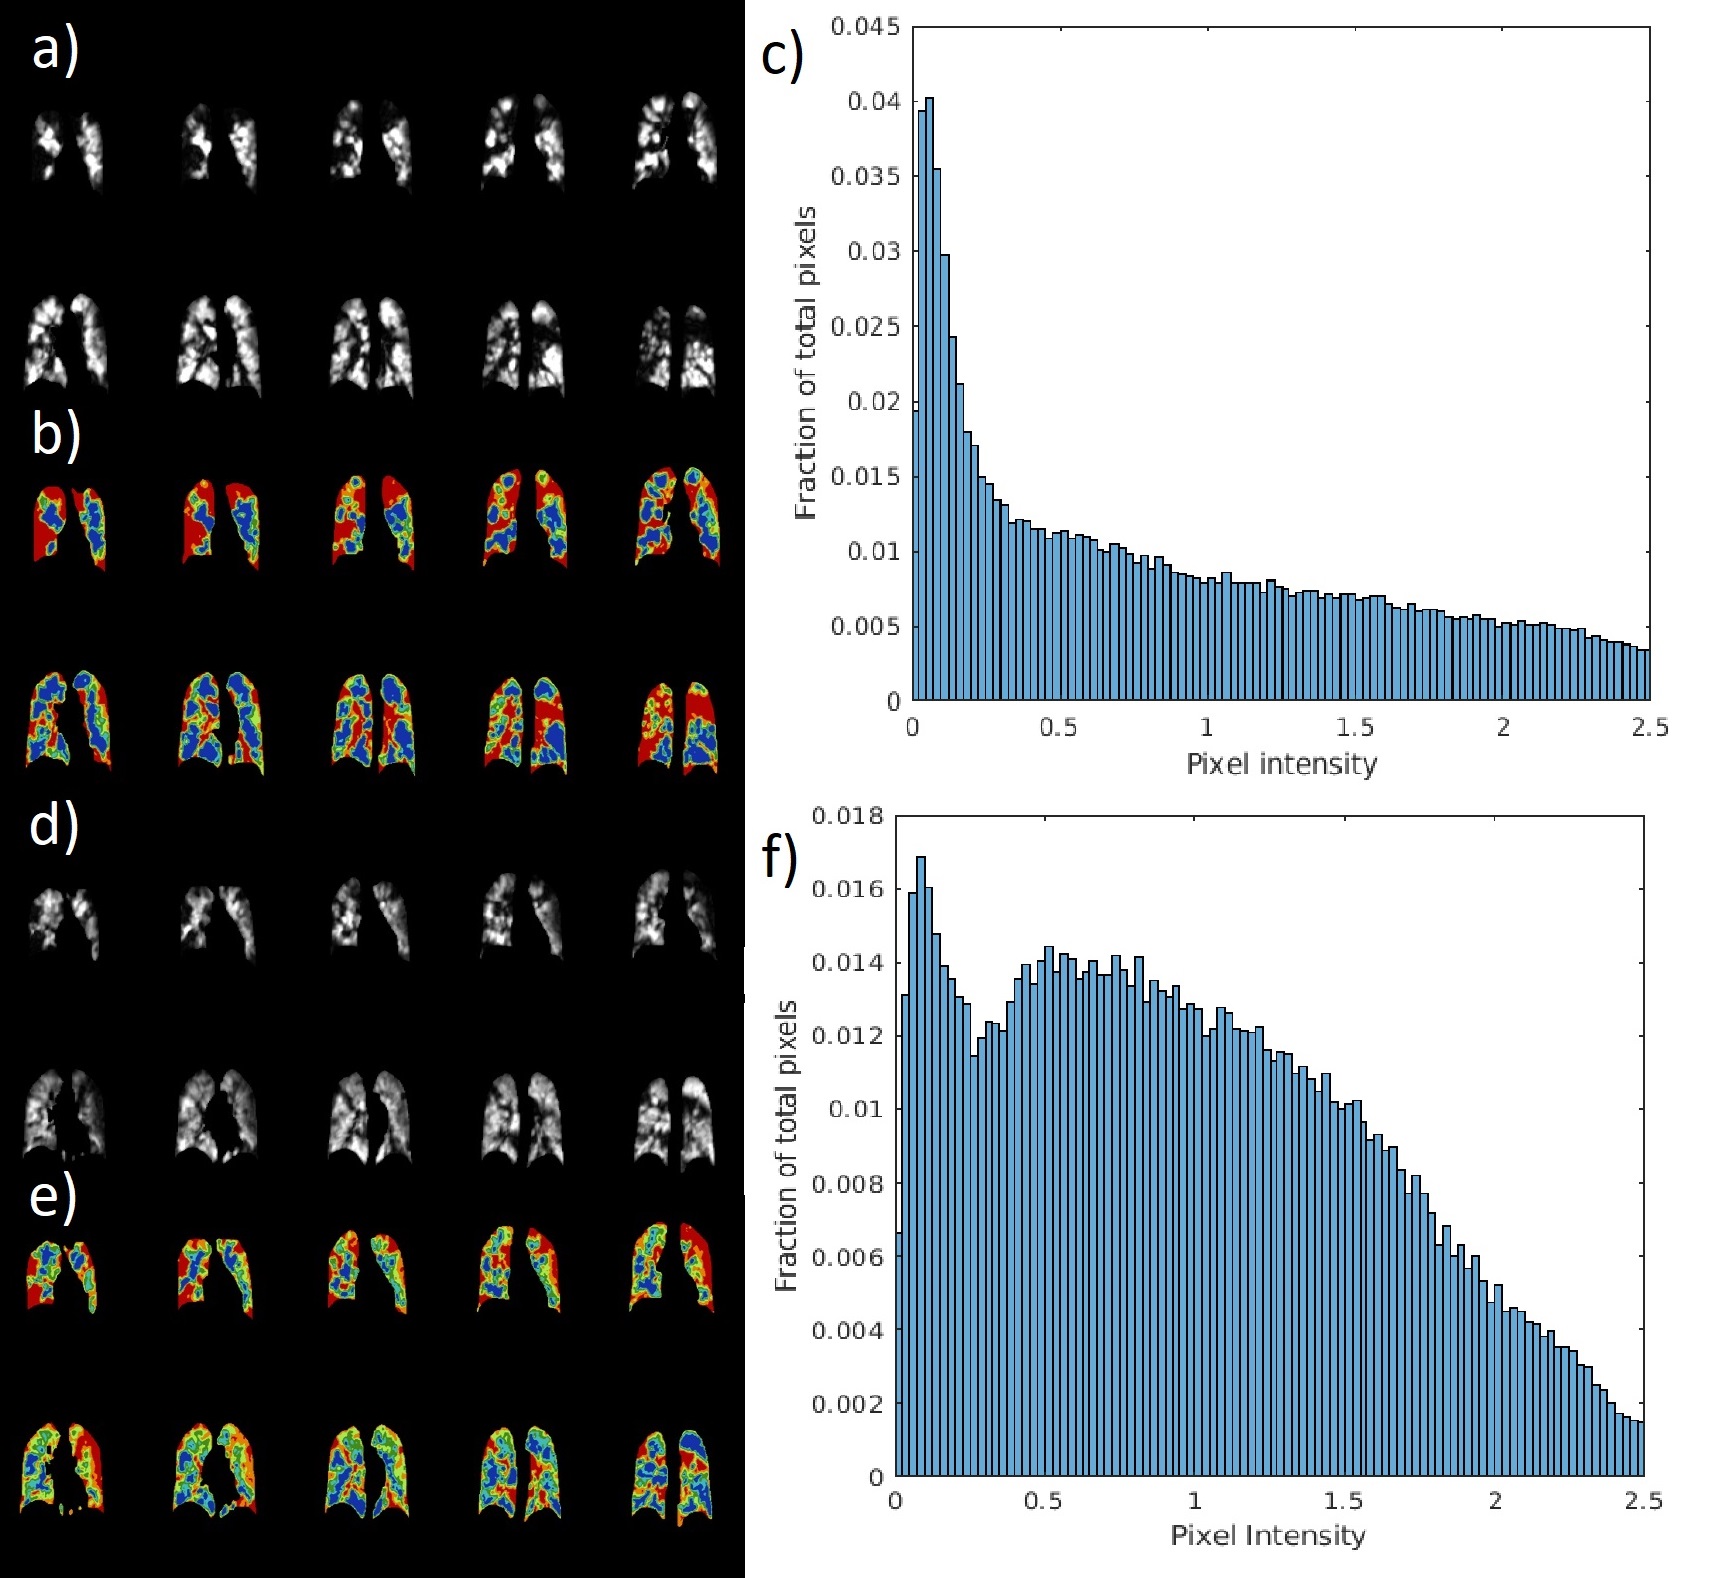
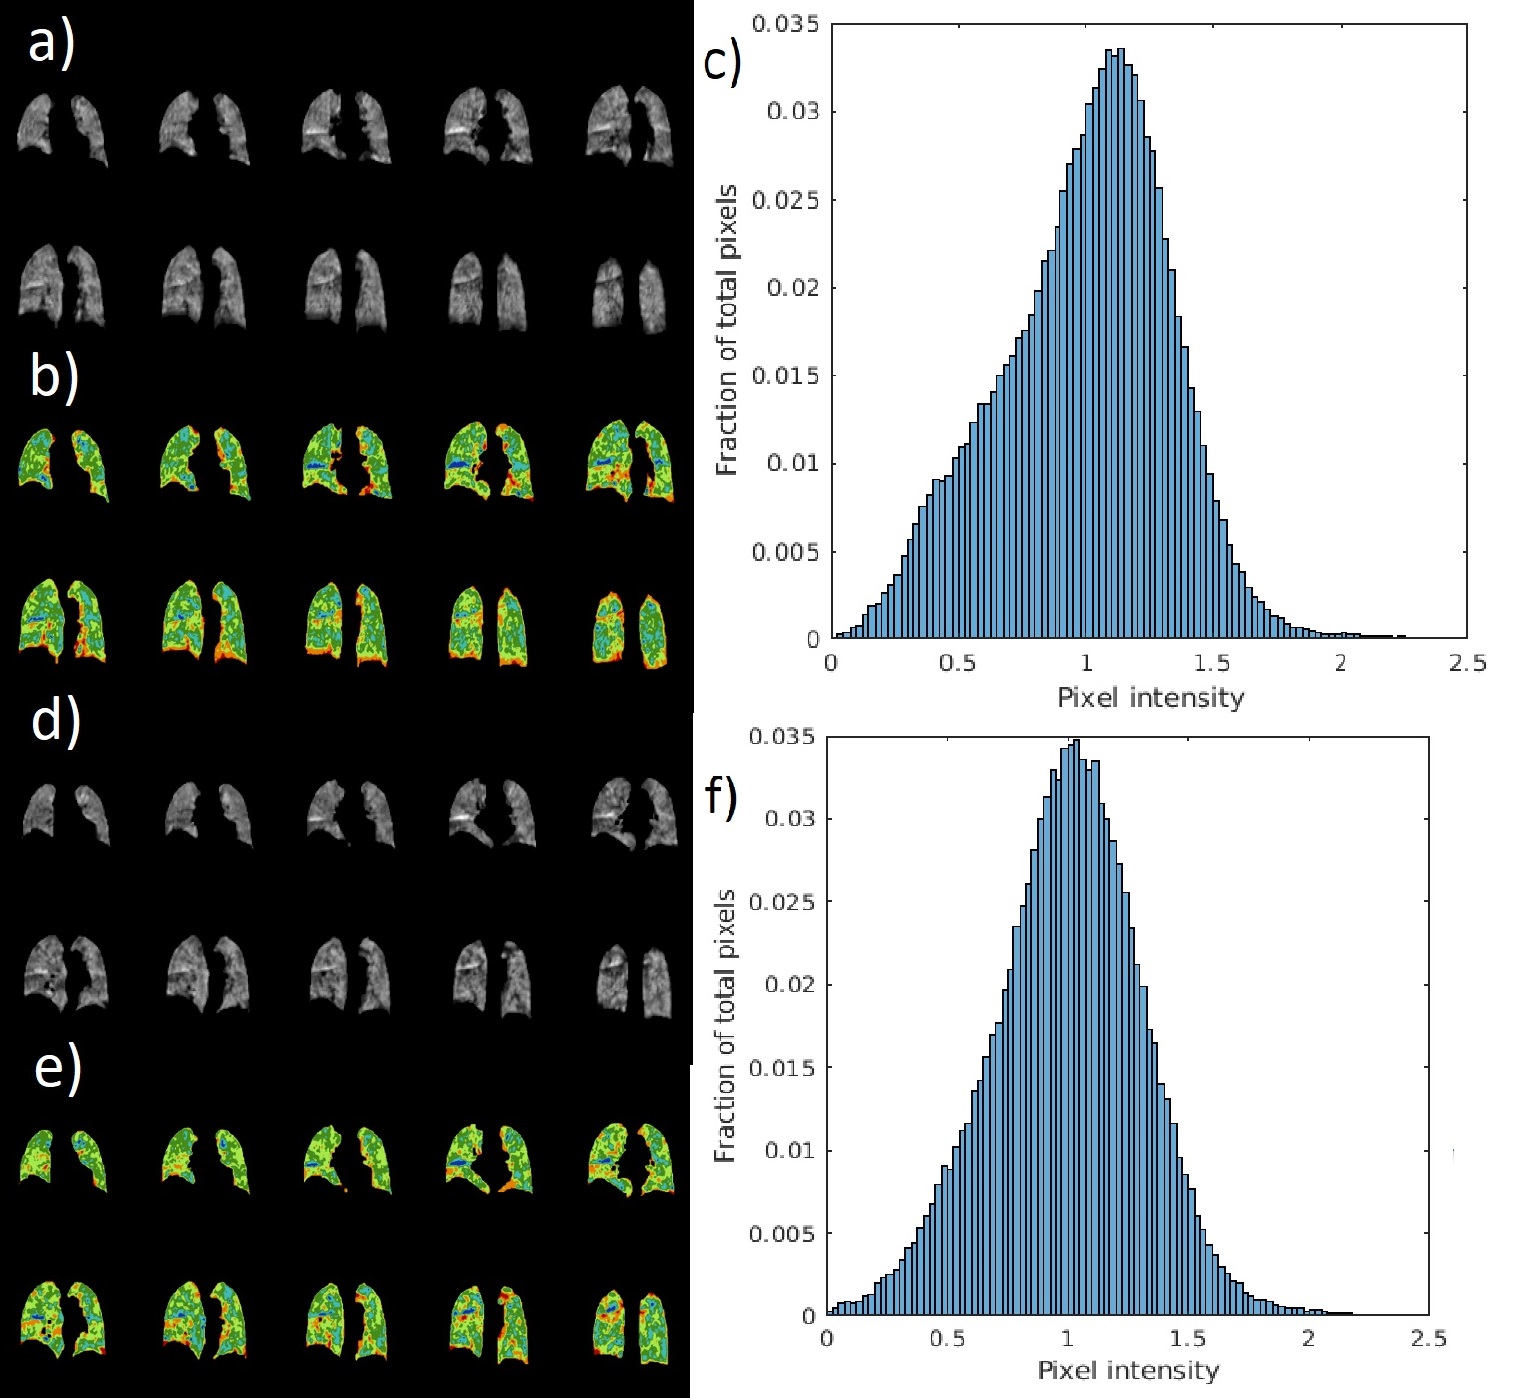
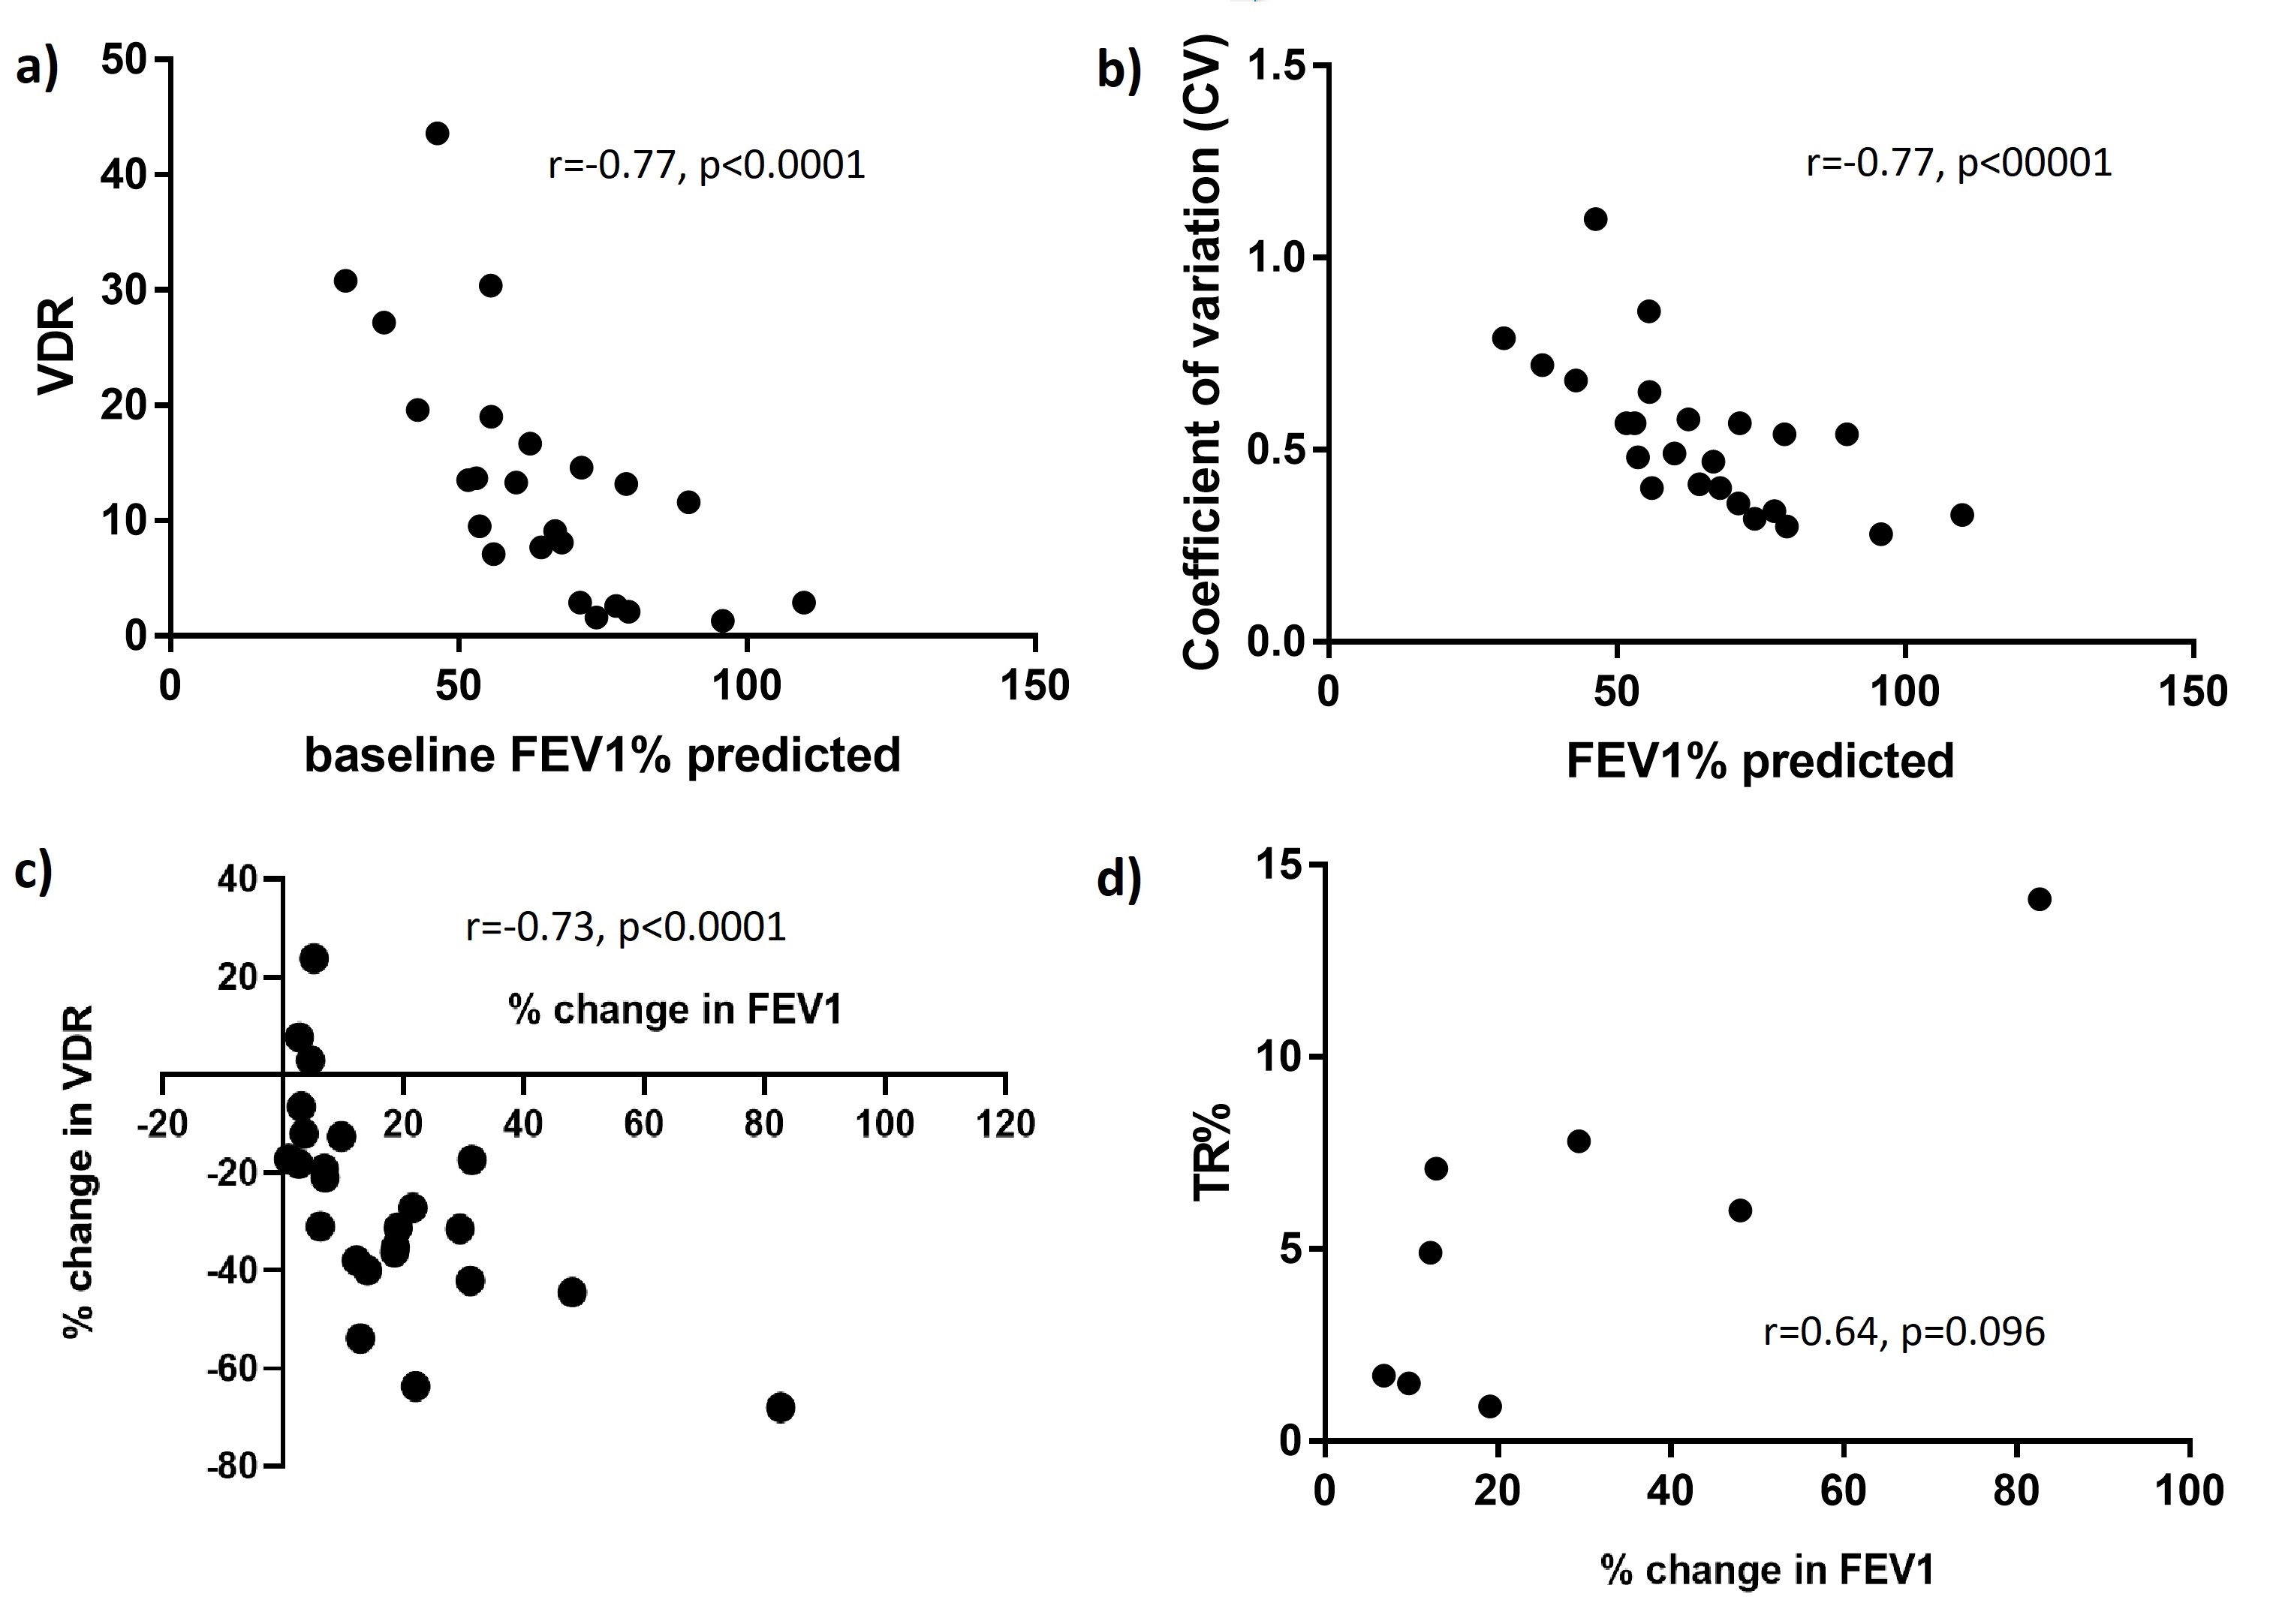
Of the 24 patients assessed, there was a significant (p<0.001) increase in the % change in FEV1 (median difference (MD)=7.1%) and decrease in the % change in VDR (MD=-29.1%) post salbutamol. According to BTS SIGN asthma guidelines9, 13/24 patients had a clinically significant change in FEV1. In these 13 patients, the MD in FEV1=21.6% and the MD in VDR=-38%. This change in FEV1 and VDR was significantly larger (p<0.001) when compared to those who did not meet BTS SIGN guidelines (11 patients). In these 11 patients, the MD for VDR=-12.6%, when compared to 4.6% for FEV1. On average the relative change in VDR is approximately double the relative change in FEV1. Example images, binning maps and histograms for a responder and a non-responder are displayed on figures 2 and 3 respectively. At baseline, there was a good correlation between FEV1% predicted, VDR and CV (Fig. 5.a & 5.b). The % change in FEV1 was significantly correlated with % change in VDR (Fig. 5.c) and ΔCV (r=-0.64, p=0.0008). In the subgroup of 8 subjects however, no significant correlation was found for both VDR or TR% (Fig. 5.d). Example TRM and comparison with previous TRM method is displayed on figure 4.Discussion
The yellow arrows in Fig. 4 highlight the main advantage of this novel method. By defining a normal or sufficient range of ventilation as opposed to abnormal (VDR/LVR), areas where signal intensity decreases from HVR to NVR that were previously6 negatively contributing toward a global ventilation change parameter can now be discarded from the TR calculation in the proposed method and displayed with a different colour map. Although the % change in FEV1 did not significantly correlate with TR%, it also did not correlate with the % change in VDR in these 8 subjects whereas the correlation was strong when considering the 24 patients. Future work will focus on applying the TRM method to all subjects. FEV1 measurement has also some limitations and in the 11 patients without a significant change in FEV1, changes in ventilation were visible for some patients post Salbutamol.Conclusions
VDR, CV and their relative changes calculated using the binning method show strong correlation with the clinical metric of FEV1 in patients with asthma. The novel binning-based TRM proposed method provides additional regional information that may help the clinicians to determine which patients have a significant response to bronchodilators and aid in the diagnosis of asthma.Acknowledgements
This work was supported by NIHR grant NIHR-RP-R3-12-027 and MRC grant MR/M008894/1. The views expressed in this work are those of the author(s) and not necessarily those of the NHS, the National Institute for Health Research or the Department of Health.References
[1] Altes, T. et al. Hyperpolarized 3He MR lung ventilation imaging in asthmatics: preliminary findings. J Magn Reson Imaging. 2001;13(3):378–84.
[2] Svenningsen, S. et al. Hyperpolarized 3He and 129Xe MRI: Differences in asthma before bronchodilation. J Magn Reson Imaging. 2013;38(6):1521–30.
[3] He, M. et al. Extending semiautomatic ventilation defect analysis for hyperpolarized (129)Xe ventilation MRI. Acad Radiol 21, 1530-1541, doi:10.1016/j.acra.2014.07.017 (2014).
[4] He, M. et al. Using Hyperpolarized 129Xe MRI to Quantify the Pulmonary Ventilation Distribution. Acad Radiol 23, 1521-1531 (2016).
[5] Collier, G. et al. ISMRM abstract 4482, 2018.
[6] Horn, F. et al. Regional Ventilation Changes in the Lung: Treatment Response Mapping by Using Hyperpolarized Gas MR Imaging as a Quantitative Biomarker. Radiology. 2017;284(3):854-861
[7] Stewart, N. et al. Feasibility of human lung ventilation imaging using highly polarized naturally abundant xenon and optimized three‐dimensional steady‐state free precession. Magn Reson Med. 2015;74:346-352.
[8] Barber, D. et al. Automatic segmentation of medical images using image registration: diagnostic and simulation applications. J Med Eng Technol. 2005;29(2):5363.
[9] BTS/SIGN British Guideline on the Management of Asthma. 2019. Available from: https://www.brit-thoracic.org.uk/quality-improvement/guidelines/asthma/
Figures