0441
Novel MRI-based Clusters of Asthma: Pulmonary Functional MRI and CT1Robarts Research Institute, London, ON, Canada, 2Department of Medical Biophysics, Western University, London, ON, Canada, 3Division of Respirology, Department of Medicine, Western University, London, ON, Canada
Synopsis
Pulmonary functional MRI measurements have never been evaluated for the generation of imaging-based asthma patient clusters, although computed tomography (CT)-based clusters have been determined. Here we investigated hyperpolarized inhaled gas MRI ventilation in combination with CT airway measurements in 60 patients with asthma and identified 6 pulmonary structure-function imaging-based clusters using MRI ventilation defect percent (VDP) and CT airway measurements. These clusters reflect proximal and distal airway abnormalities in asthma and may be used to stratify patients for treatment decisions.
Introduction
Hyperpolarized noble-gas MRI provides a way to sensitively quantify inhaled gas distribution heterogeneity that is believed to result from abnormalities in both the proximal1 and distal2 airways. Quantitative imaging biomarkers provide novel ways to generate imaging-based phenotyping or clustering of patients with respiratory disease. In asthma, the Severe Asthma Research Program revealed computed tomography (CT)-based clusters using measurements of proximal airway structure, tissue biomechanics and gas trapping.3 Static ventilation hyperpolarized 3He MRI has recently been used to show that ventilation defects predict longitudinal loss of reversibility4 in asthmatics and are related to age, disease severity and airway measurements.1 Pulmonary functional MRI measurements have never been evaluated independently or in combination with CT for the generation of imaging-based asthma patient clusters. Accordingly, our objective was to investigate hyperpolarized inhaled gas MRI ventilation in combination with CT airway measurements to generate pulmonary structure-function imaging-based asthma patient clusters.Methods
Participants and Data Acquisition: Participants with asthma provided written informed consent to an ethics-board-approved protocol (NCT02351141) and underwent MRI and CT during a single two-hour visit. 1H and 3He MRI were performed within five minutes of each other using a whole-body 3.0T Discovery MR750 system (General Electric Healthcare, USA) with broadband imaging capabilities as previously described.5 Subjects were instructed to inhale a gas mixture from a 1.0L Tedlar bag from functional residual capacity and image acquisition was performed under breath-hold conditions. Anatomical 1H MRI was performed before 3He after inhalation of 100% N2 using the whole-body radiofrequency coil and 1H fast-spoiled, gradient-recalled echo (FGRE) sequence with a partial echo (10s total acquisition time, repetition time (TR)/echo time (TE)/flip angle=4.7ms/1.2ms/30°, field-of-view (FOV)=40x40cm, matrix=128x80, 15-17 slices, 15mm slice thickness, zero gap). 3He static ventilation images were acquired after inhalation of 25% 3He diluted to 1.0L with N2 using a linear birdcage transmit/receive chest coil and fast-gradient echo method with a partial echo (11s total acquisition time, TR/TE/flip angle=4.3ms/1.4ms/7°, FOV=40x40cm, matrix=128x80, 15-17 slices, 15mm slice thickness, zero gap). CT was acquired using a 64-slice Lightspeed VCT system (GEHC) within ten minutes after MRI, under breath-hold conditions after inhalation of 1.0L N2 to volume-match to MRI.Data Analysis: Static ventilation images were segmented to generate ventilation defect percent (VDP) as previously described.6 VDP was defined as the ventilation defect volume normalized to the thoracic cavity volume. Airways were segmented from CT using Pulmonary Workstation 2.0 (VIDA Diagnostics Inc., USA); total airway count (TAC) was quantified as the sum of airways in the segmented airway tree,7 and airways were measured for airway wall area percent (WA%), wall thickness (WT), lumen area (LA) for the third to fifth generation airway segments in five anatomically equivalent paths (RB1, RB4, RB10, LB1 and LB10), as well as the square root of the airway wall area of a theoretical airway with 10mm internal perimeter (Pi10). Univariate relationships between MRI VDP and CT airway measurements were assessed using Spearman correlation coefficients. Multivariable models to explain VDP using CT measurements were generated based on statistically significant univariate relationships, with participant age, sex and body mass index (BMI) included as covariates. We applied k-means clustering using MATLAB R2018a (Mathworks, USA) to generate groups or clusters of participants based on univariate and multivariate relationships. The optimal number of clusters was determined using Dunn’s coefficient; a larger Dunn coefficient indicates improved clustering.
Results
We evaluated 60 participants with asthma, including 16 with mild-moderate (46±13-years, 9 males/7 females) and 44 with severe asthma (49±12 years, 16 males/28 females). VDP was significantly correlated with TAC (ρ=0.32, p=0.01) and Pi10 (ρ=0.29, p=0.02), but not WA% (ρ=0.13, p=0.3), WT (ρ=-0.19, p=0.1), or LA (ρ=-0.08, p=0.5). In a multivariable model for VDP (R2=0.20, p=0.006), Pi10 significantly predicted VDP (β=0.27 p=0.04) and age was a significant covariate (p=0.03) whereas TAC did not significantly contribute to the model (β=-0.12, p=0.4). K-means clustering was evaluated for 3-6 clusters using VDP, TAC and Pi10 as well as age and BMI, because age was a significant covariate in the multivariable model and BMI impacts CT image quality and airway measurements. Dunn’s coefficients were 0.05, 0.11, 0.16, and 0.18 for 3, 4, 5 and 6 clusters, respectively. The k-means 6-clusters are qualitatively described in Figure 1, with corresponding variables for each cluster; VDP, TAC and Pi10 were significantly different between clusters. Figure 1 also shows centre slice MRI static ventilation and 3D CT airway tree for a representative participant in each cluster.Discussion
We used MRI VDP, CT TAC and Pi10 to drive imaging-based clusters in a relatively small group of patients with asthma. Age and BMI were not significantly different between clusters, likely owing to the small number of participants in clusters 5 and 6. MRI VDP is sensitive to distal and proximal airways,1,2 whereas TAC reflects the architecture of the entire airway tree7 and Pi10 reflects a standardized airway wall thickness for small distal airways,8 therefore these clusters may represent both proximal and distal airway abnormalities in patients with asthma.Conclusion
Six imaging-based clusters were identified in patients with asthma based on MRI VDP and CT TAC and Pi10 to reflect proximal and distal airway abnormalities, and may be used to stratify patients for treatment decisions.Acknowledgements
No acknowledgement found.References
1. Svenningsen, S. et al. What are ventilation defects in asthma? Thorax 69, 63-71, doi:10.1136/thoraxjnl-2013-203711 (2014).
2. Fain, S. B. et al. Evaluation of structure-function relationships in asthma using multidetector CT and hyperpolarized He-3 MRI. Academic radiology 15, 753-762, doi:10.1016/j.acra.2007.10.019 (2008).
3. Choi, S. et al. Quantitative computed tomographic imaging-based clustering differentiates asthmatic subgroups with distinctive clinical phenotypes. The Journal of allergy and clinical immunology, doi:10.1016/j.jaci.2016.11.053 (2017).
4. Eddy, R. L., Svenningsen, S., Licskai, C., McCormack, D. G. & Parraga, G. Hyperpolarized Helium 3 MRI in Mild-to-Moderate Asthma: Prediction of Postbronchodilator Reversibility. Radiology 293, 212-220, doi:10.1148/radiol.2019190420 (2019).
5. Parraga, G. et al. Hyperpolarized 3He ventilation defects and apparent diffusion coefficients in chronic obstructive pulmonary disease: preliminary results at 3.0 Tesla. Investigative radiology 42, 384-391, doi:10.1097/01.rli.0000262571.81771.66 (2007).
6. Kirby, M. et al. Hyperpolarized 3He magnetic resonance functional imaging semiautomated segmentation. Academic radiology 19, 141-152, doi:10.1016/j.acra.2011.10.007 (2012).
7. Kirby, M. et al. Total Airway Count on Computed Tomography and the Risk of Chronic Obstructive Pulmonary Disease Progression. Findings from a Population-based Study. American journal of respiratory and critical care medicine 197, 56-65, doi:10.1164/rccm.201704-0692OC (2018).
8. Nakano, Y. et al. The prediction of small airway dimensions using computed tomography. American journal of respiratory and critical care medicine 171, 142-146, doi:10.1164/rccm.200407-874OC (2005).
Figures
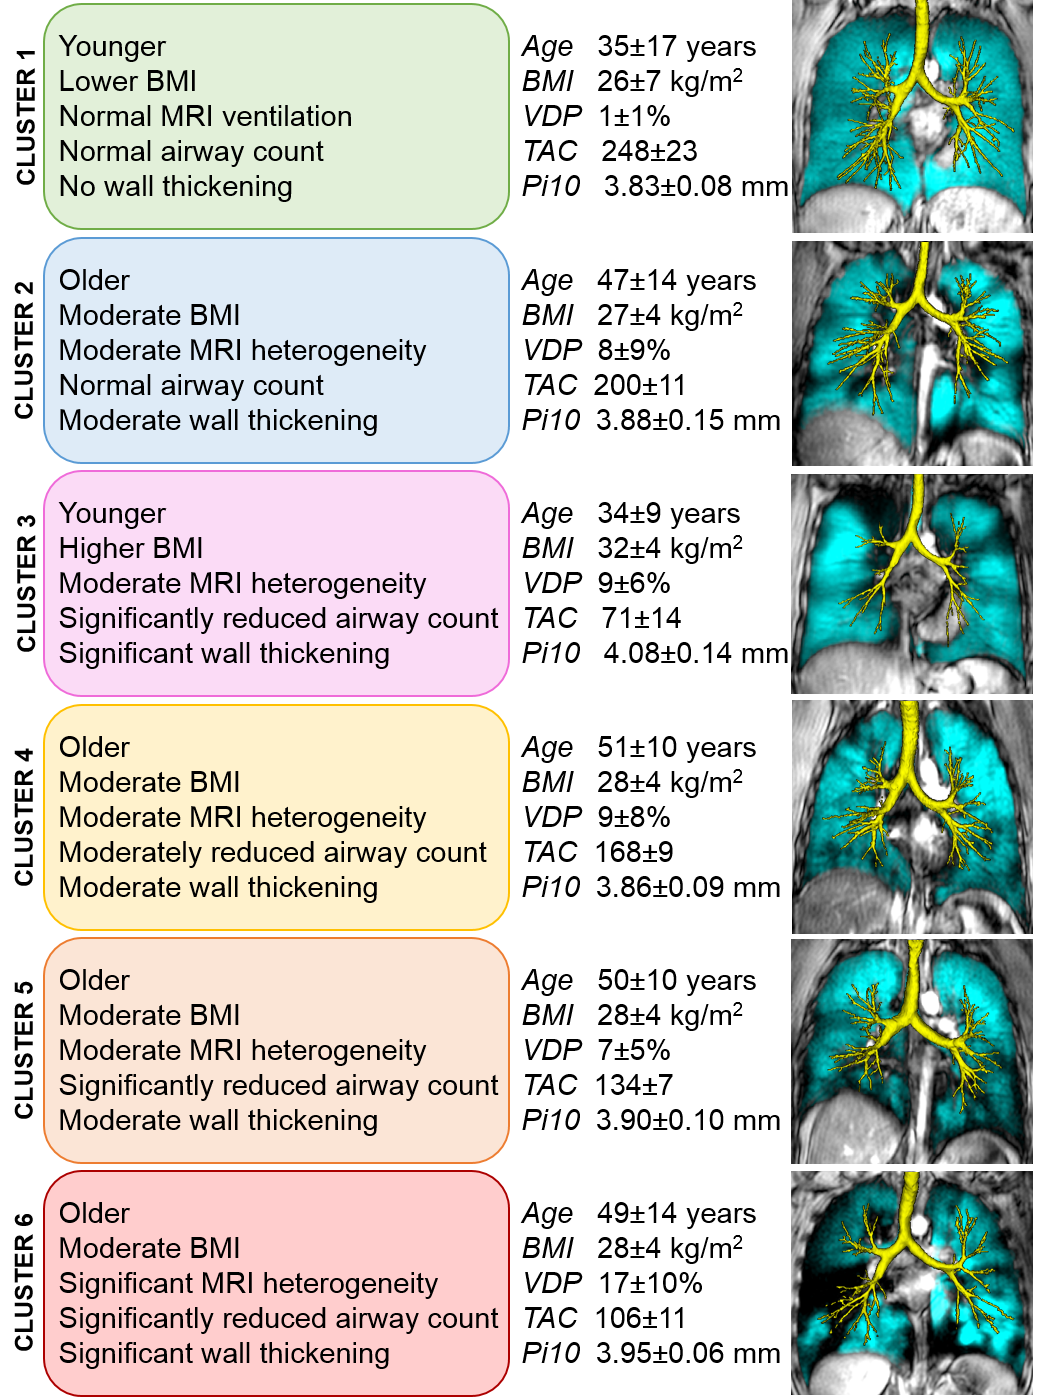
Figure 1. Description of 6 imaging-based clusters.
Description of 6 imaging-based clusters with values for each variable included in clustering, and centre slice 3He MRI static ventilation (cyan) co-registered to anatomical 1H (grey-scale) with 3D airway tree (yellow) for representative participants in each cluster.