0439
3D-SBCSI Xenon-129 lung MRI: Comparison of Healthy, CF, IPF, and COPD Subjects1Radiology & Medical Imaging, University of Virginia, Charlottesville, VA, United States, 2Medicine, University of Virginia, Charlottesville, VA, United States, 3Radiology, University of Missouri, Columbia, MO, United States, 4University of Florida, Gainesville, FL, United States, 5Public Health, University of Virginia, Charlottesville, VA, United States
Synopsis
The results of this study indicated that hyperpolarized Xe-129 MR 3D-SBCSI is sensitive to physiology of lung diseases and can therefore be used to differentiate lung disease and monitor disease progression on regional level and characterizing disease phenotypes and co-morbidities in the future.
Introduction
Current state-of-the-art clinical tools for monitoring disease progression in COPD, CF, and IPF are invasive and involve radiation or have a large error associated with their measurements. 3D Single Breath-hold Chemical Shift Imaging (3D-SBCSI)1,2 is an MR-spectroscopic imaging modality with high-sensitivity that helps differentiate multiple lung diseases by probing physiological and anatomical characteristics non-invasively and without radiation. This technique outshines current standard of care and may help early disease detection and treatment efficacy.
Methods
Twenty-nine subjects with lung disease IPF (N=11),
CF (N=13), COPD (N=5), and 16 healthy subjects were imaged in a 1.5T MR scanner
(Avanto, Siemens).
For MR imaging, subjects laid supine on the scanner
table, inhaled a volume (1/3 FVC) of enriched Xe-129 up to 1000mL and the
remainder (if any) N2, and held their breath throughout a 7-second
acquisition (3D-SBCSI) and a separate 6-second acquisition [spiral-GRE ventilation
and spiral-GRE 1H chest anatomy]. A vest-shaped RF coil tuned to the Xe-129
frequency (Clinical MR Solutions) was used. Xe-129 was polarized to ~30-40%
using a commercial polarizer (Xe9820, Polarean). The resulting Xe-129 ventilation, Xe-129
3D-SBCSI, and proton images were post-processed3. The percentage of ventilation defects was
calculated from the Xe-129 ventilation and corresponding proton images, and,
from the 3D-SBCSI acquisition, three peaks in the Xe-129 spectrum were identified,
corresponding to alveolar gas, tissue, and red blood cells
Results
Table 1 (Figure 2), summarizes the results for healthy
subjects and the three pulmonary diseases.
CF and COPD subjects had significantly more
ventilation defects than IPF and healthy subjects (p<0.001), which
correlated well with FEV1 predicted (R=-0.74). FEV1 %predicted also correlated
well with RBC/Gas ratio (R=0.67). IPF
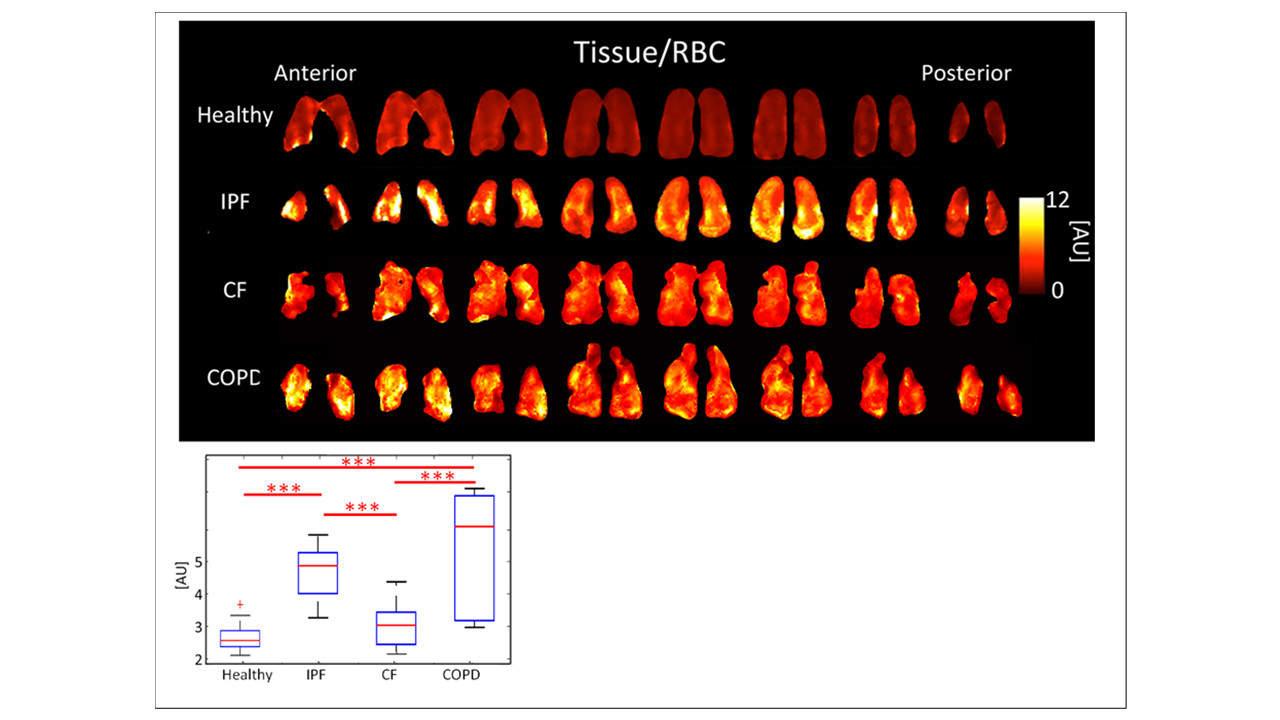
and COPD had the highest Tissue/RBC peak ratios, 4.71±0.807AU and 5.30±2.040AU,
respectively (p<0.001), longer RBC T2* relaxation times (p<0.05), and
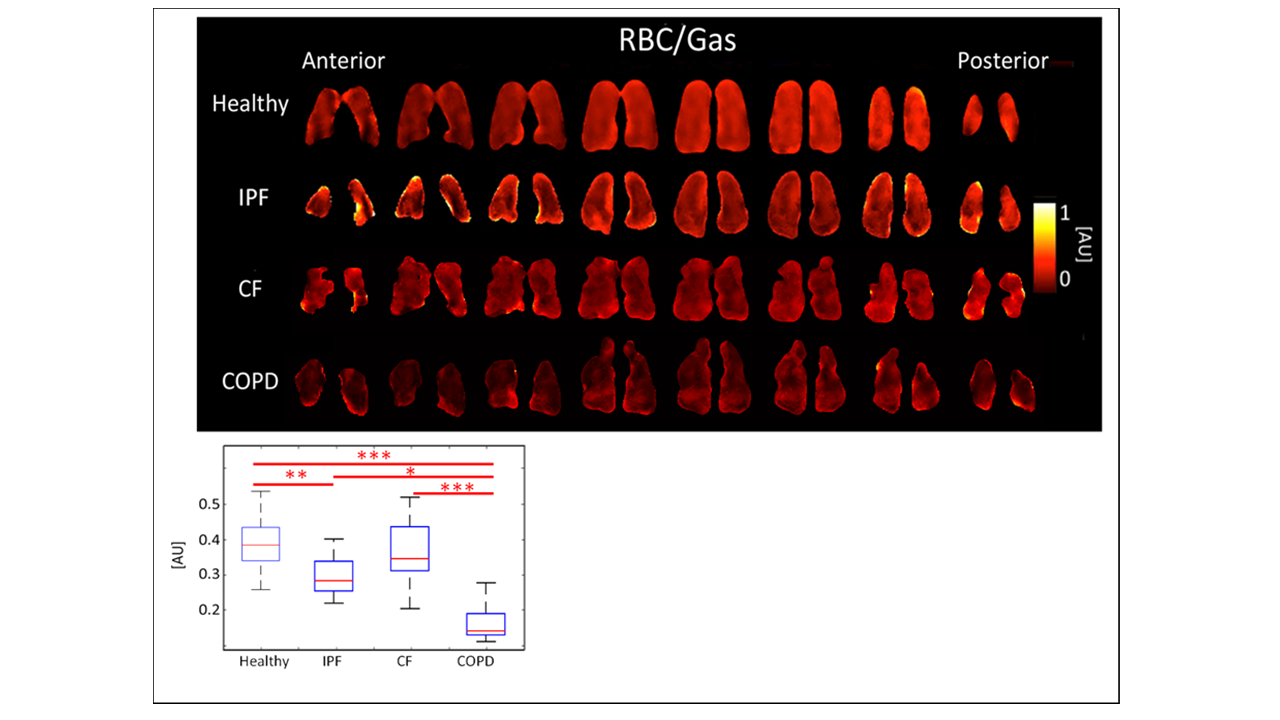
greater RBC chemical shifts (p<0.001). COPD subjects had the lowest RBC/gas ratio,
0.15±0.068AU. The RBC/Gas ratio for CF was 0.35±0.094AU, IPF was 0.28±0.061AU,
and healthy was 0.39±0.079AU (p<0.001). The differences between healthy and
COPD, and CF and COPD subjects were most significant (p<0.001), and the
difference between healthy and IPF was also significant (p<0.01). (Figures 3-5,
Table 1).
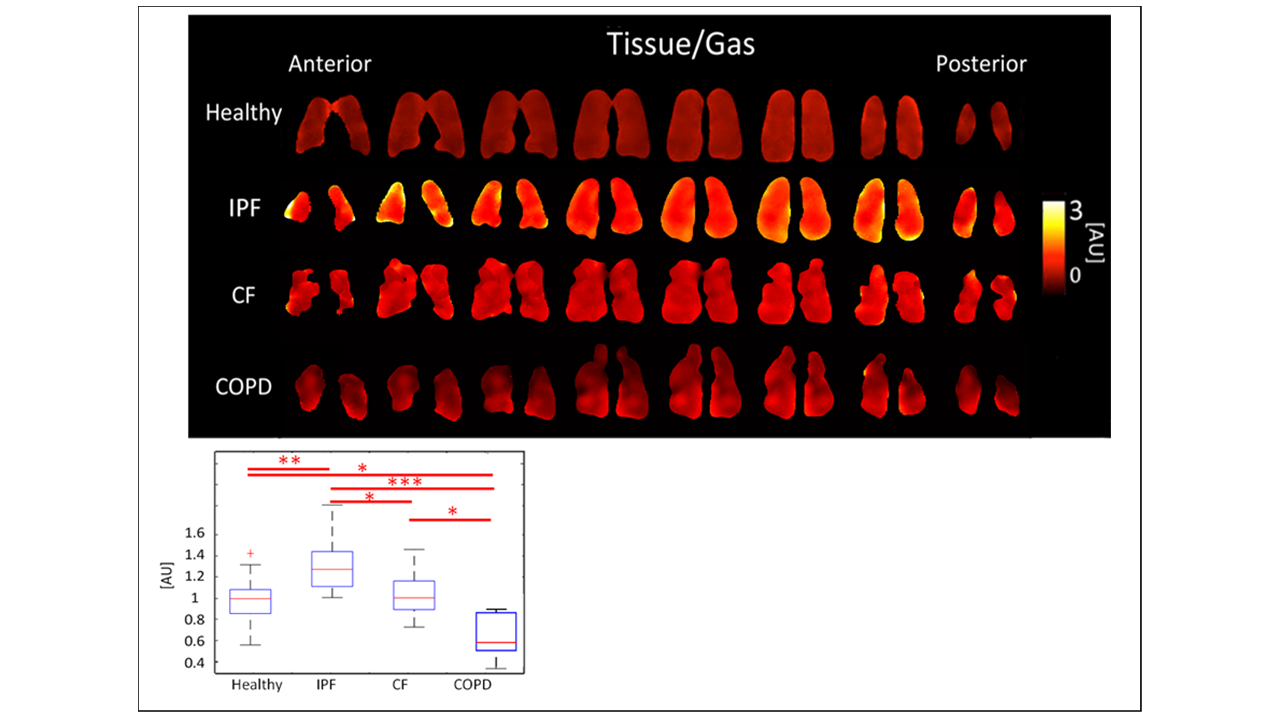
IPF subjects had the highest tissue/gas ratio,
1.31±0.259AU, and COPD subjects had the lowest, 0.66±0.220AU, while healthy and
CF had similar ratios of 0.99±0.196AU and 1.02±0.196, respectively
(p<0.001). The differences between healthy and IPF (p<0.01), and CF and
COPD (p<0.001) were significant. (Figures 3-5, Table 1). CF had a Tissue/RBC ratio of 3.06±0.640AU,
and healthy subjects had a Tissue/RBC ratio of 2.66±0.448AU (p<0.001).
Multiple correlations among diseases and healthy subjects were statistically
significant (Figures 3-5, Table 1). Severe CF subjects had more ventilation
defects than mild CF or healthy subjects (p<0.05, p<0.01), elevated
Tissue/RBC ratio, shorter Tissue T2* relaxation, and greater RBC chemical
shift.
Discussion
IPF and COPD subjects had significantly different
Tissue/Gas ratios compared to healthy subjects. Since IPF is characterized by a
thicker, fibrotic parenchyma5, more Xe-129 would dissolve into lung
tissue resulting in a higher Tissue/Gas ratio. COPD is characterized by the
destruction of parenchyma, so as expected little Xe-129 would dissolve in
tissue. These results are consistent with findings by Wang et. al.6.
IPF and COPD subjects had lower RBC/Gas ratios
than healthy and CF subjects. This was expected because IPF and COPD subjects
have impaired gas transfer between parenchymal tissue and RBCs. COPD subjects
had even lower RBC/Gas ratios than IPF subjects did, because not only was
transfer impaired, but there was less tissue and blood vessels to transfer gas
to RBC. The RBC/Gas ratio in CF subjects was expected to be the same or
slightly lower than in healthy subjects because tissue is generally healthy in this
population, aside from mucus plugs, so gas transfer to RBC is relatively
unrestricted.
Conclusion
The results of this study indicated that 3D-SBCSI is sensitive to physiology of lung diseases and can therefore be used to help differentiate among healthy, IPF, CF, and COPD lung disease types. This method may be useful for monitoring disease progression on regional level and characterizing disease phenotypes and co-morbidities in the future.Acknowledgements
This work was funded by NIH grants R01-CA172595 and S10-OD018079.References
[1] Mata J. ISMRM; 2010; Stockholm. [2] Mata J. ISMRM; 2009; Honolulu. [3] Tustison N, et al. J Mag Res Imag 2011;34(4):831-41 [4] Qing K, et al. J Mag Res Imag. 2014;39(2):346-59. [5] Wallis A, Spinks K. BMJ. 2015;350. [6] Wang JM, et al. Thorax. 2017.
Figures
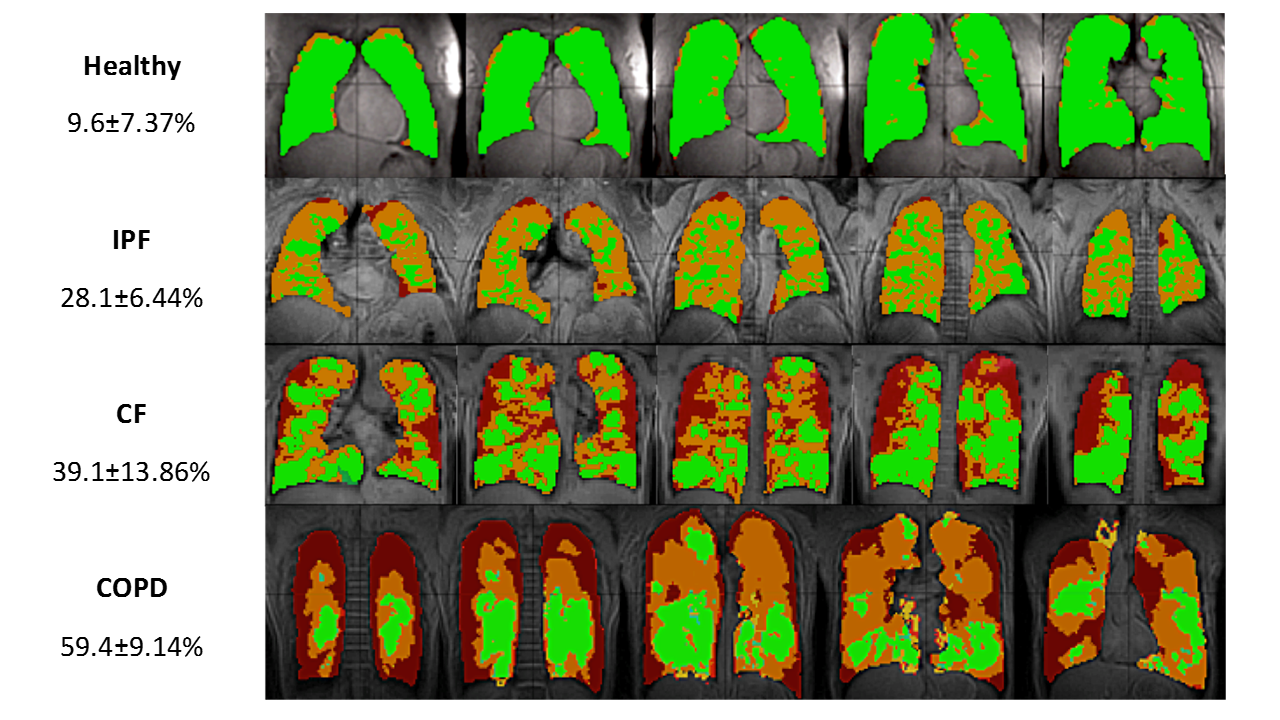
Figure 1:
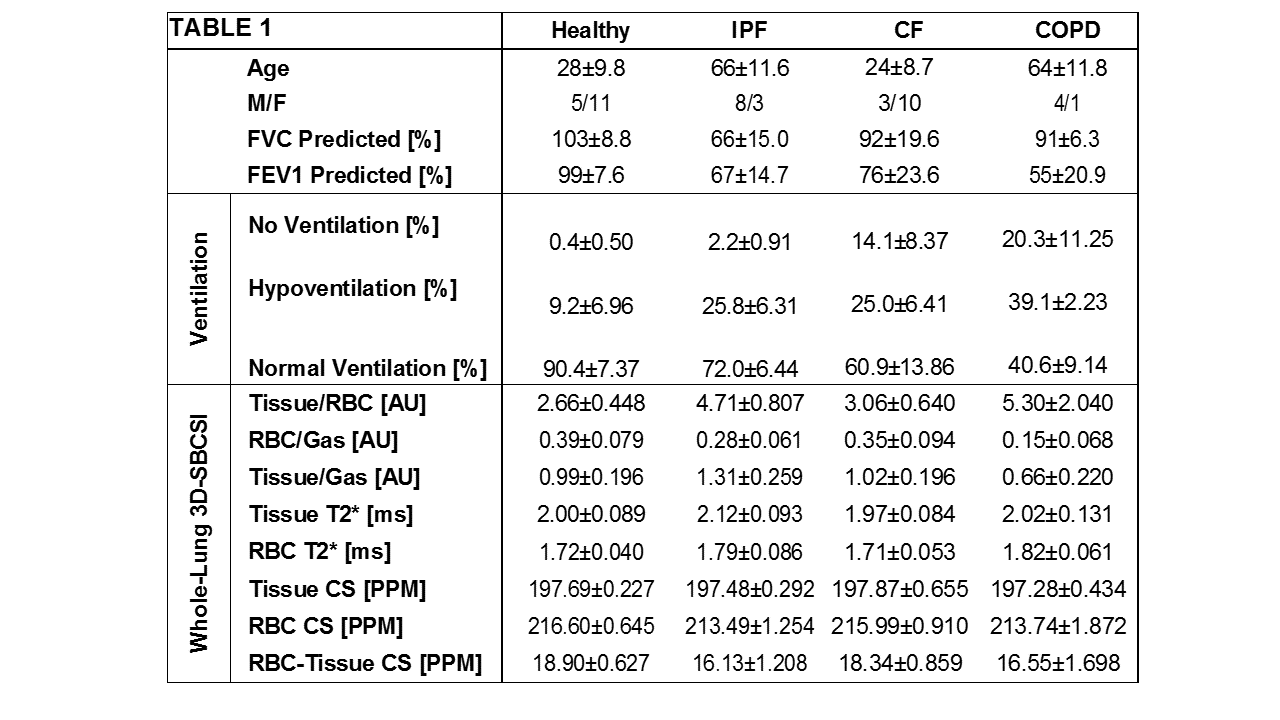
Figure 2: Averages and standard deviations of subject
information and computed parameters for each disease type. (CS = chemical
shift).