0436
Volume-controlled 19F MR imaging of fluorinated gas wash-in
Arnd Jonathan Obert1,2, Marcel Gutberlet1,2, Agilo Luitger Kern1,2, Frank Wacker1,2, and Jens Vogel-Claussen1,2
1Institute of Diagnostic and Interventional Radiology, Hannover Medical School, Hannover, Germany, 2Biomedical Research in Endstage and Obstructive Lung Disease Hannover (BREATH), German Center for Lung Research (DZL), Hannover, Germany
1Institute of Diagnostic and Interventional Radiology, Hannover Medical School, Hannover, Germany, 2Biomedical Research in Endstage and Obstructive Lung Disease Hannover (BREATH), German Center for Lung Research (DZL), Hannover, Germany
Synopsis
Since Perfluoropropane is highly inert, and can be mixed with oxygen, patients can inhale up to 30 liters of gas during one examination without a significant physiological impact. This enables detailed measurements of gas wash-in dynamics using 19F magnetic resonance imaging. In this work, an experimental setup for volume-controlled imaging of multiple breath-holds is realized using a pneumotachometer and pneumatic valves as well as MR triggering. In three healthy volunteers, the stability of the breathing volumes and the positions of the diaphragm, as well as the standard deviation of wash-in times, were analyzed comparing volume-controlled to non-controlled scans.
Introduction
Due to the low spin density of gaseous Perfluoropropane (PFP) and the limited acquisition time of one breath-hold in pulmonary imaging, 19F magnetic resonance (MR) lung imaging naturally lacks high signal-to-noise ratio (SNR). However, since PFP is highly inert, has a low solubility in blood and water, and can be mixed with oxygen without degrading the 19F MR signal, patients can inhale up to 30 liters of gas during one examination1. This enables detailed measurements of gas wash-in dynamics in consecutive breath-holds2,3.Previous work on the experimental setup focused on the patient’s safety monitoring, automated gas delivery and the assessment of the inhaled gas volume4. However, to improve inter- and intra-patient comparability, the patient’s breathing volume must be controlled over the whole exam, ensuring a fixed value proportional to the patient’s forced vital capacity (FVC)5. Furthermore, fitting algorithms describing the voxel-wise wash-in dynamics benefit from a constant position of the diaphragm. Therefore, the purpose of this work was to develop an experimental setup for volume-controlled fluorinated gas wash-in measurements using 19F MRI.
Methods
In this preliminary study, three healthy volunteers were examined on a 1.5 T scanner (MAGNETOM Avanto, Siemens Healthcare, Erlangen, Germany). The study participants inhaled a mixture of 79% fluorinated gas (PFP) and 21% oxygen while being monitored by a physician. During eight consecutive inspiratory breath-holds (duration of 6 seconds each), 19F pulmonary gas MR imaging was performed using a transmit and 16 channel receive coil dedicated to the 19F frequency (RAPID Biomedical, Rimpar, Germany) and a custom-made 3D gradient echo pulse sequence with a golden-angle stack-of-stars k-space encoding. Imaging parameters are shown in Table 1.The breathing volume was fixed to 1/8 FVC using a pneumotachometer and a pneumatic valve integrated into the gas tubing. MR scans were triggered exactly when the desired gas volume was inhaled using a real-time assessment of the inhaled gas flow. Figure 1 shows a schematic representation of the experimental setup. The whole procedure was repeated without volume control for comparison. Lung function testing was performed prior to the MR scan to determine the FVC.
A generalized parallel imaging and compressed sensing (PICS) reconstruction from the BART toolbox6, minimizing the total variation in the spatial (λs = 0.0001) and the temporal domain (λt = 0.01), is used to reconstruct images from all breath-holds jointly. The position of the diaphragm in each breath-hold was measured as the vertical difference compared to the last breath-hold in a central slice. Wash-in time (TW) maps were computed by fitting the signal intensity of the time points for each voxel inside the lung to a monoexponential model:
$$I(t) \propto 1- \exp\left(-t/T_W\right)$$
Here, the sum of squared residuals of the fit and the standard deviation of TW over the whole lung were measured.
Results
All participants underwent the MR imaging examinations without any adverse effects, discomfort or stress. The volume control and the trigger for the sequence worked reliably. The mean SNR for the first breath-hold in all participants was 6.0 with volume control and 5.9 without and for the 8th breath-hold 10.3 with volume control and 10.0 without. SNR was calculated using Kellman’s method7.The breathing volume and the position of the diaphragm were more stable when using the volume control. Figure 2 shows the comparison of integrated inspiratory flow for one subject and Figure 4(a) shows the mean difference in the vertical position of the diaphragm for all subjects. Figure 3 shows TW maps for one subject achieved with volume control (a) and without (b). The standard deviation of TW and the sum of squared residuals were lower in volume-controlled scans. Figure 4(b) and (c) shows the comparison of the standard deviation and the sum of squared residuals for all subjects.
Discussion and Conclusion
The comparison of the breathing volume and position of the diaphragm indicates, that the given method could align the breathing volumes in multiple breath-holds. The reduction of the standard deviation of TW and the sum of squared residuals in the wash-in fit may suggest, that the monoexponential model fits better with the data when the breathing volume is controlled.The presented experimental setup enables potentially reproducible and comparable measurements of pulmonary gas wash-in dynamics with 19F MRI.
Acknowledgements
This work was funded by the German Center for Lung Research (DZL). Furthermore, the authors thank Robert Grimm for support in sequence programming, as well as Lea Behrendt, Christoph Czerner, Tawfik Moher Alsady, Melanie Pfeifer and Frank Schröder for experimental assistance.References
1. Charles HC, Moon RE, MacIntyre NR, et al. Cardio-respiratory tolerability of perfluoropropane-enhanced MRI of pulmonary ventilation. In: American Thoracic Society International Conference. ; 2015:A3509.2. Schreiber WG, Eberle B, Laukemper‐Ostendorf S, et al. Dynamic 19F‐MRI of pulmonary ventilation using sulfur hexafluoride (SF6) gas. Magn Reson Med An Off J Int Soc Magn Reson Med. 2001;45(4):605-613.
3. Gutberlet M, Kaireit TF, Voskrebenzev A, et al. Free-breathing Dynamic 19F Gas MR Imaging for Mapping of Regional Lung Ventilation in Patients with COPD. Radiology. 2018;286(3):1040-1051. doi:10.1148/radiol.2017170591
4. Halaweish AF, Charles HC. Physiorack: an integrated MRI safe/conditional, gas delivery, respiratory gating, and subject monitoring solution for structural and functional assessments of pulmonary function. J Magn Reson Imaging. 2014;39(3):735-741. doi:10.1002/jmri.24219
5. Hamedani H, Clapp JT, Kadlecek SJ, et al. Regional fractional ventilation by using multibreath wash-in 3He MR imaging. Radiology. 2016;279(3):917-924.
6. Uecker M, Ong F, Tamir JI, et al. Berkeley advanced reconstruction toolbox. Proc Intl Soc Mag Reson Med. 2015;23:2486. doi:10.1002/mrm.25176
7. Kellman P, McVeigh ER. Image reconstruction in SNR units: A general method for SNR measurement. Magn Reson Med. 2005;54(6):1439-1447. doi:10.1002/mrm.20713
Figures
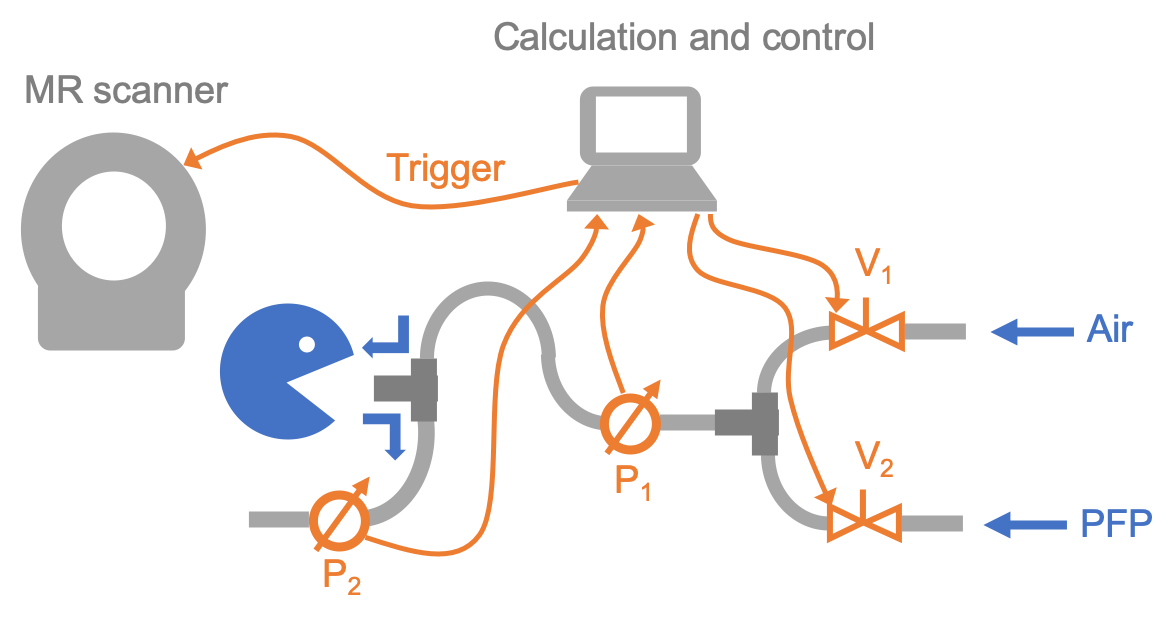
Figure 1: Schematic representation of
the experimental setup showing pneumotachometers P1 and P2
and pneumatic valves V1 and V2.
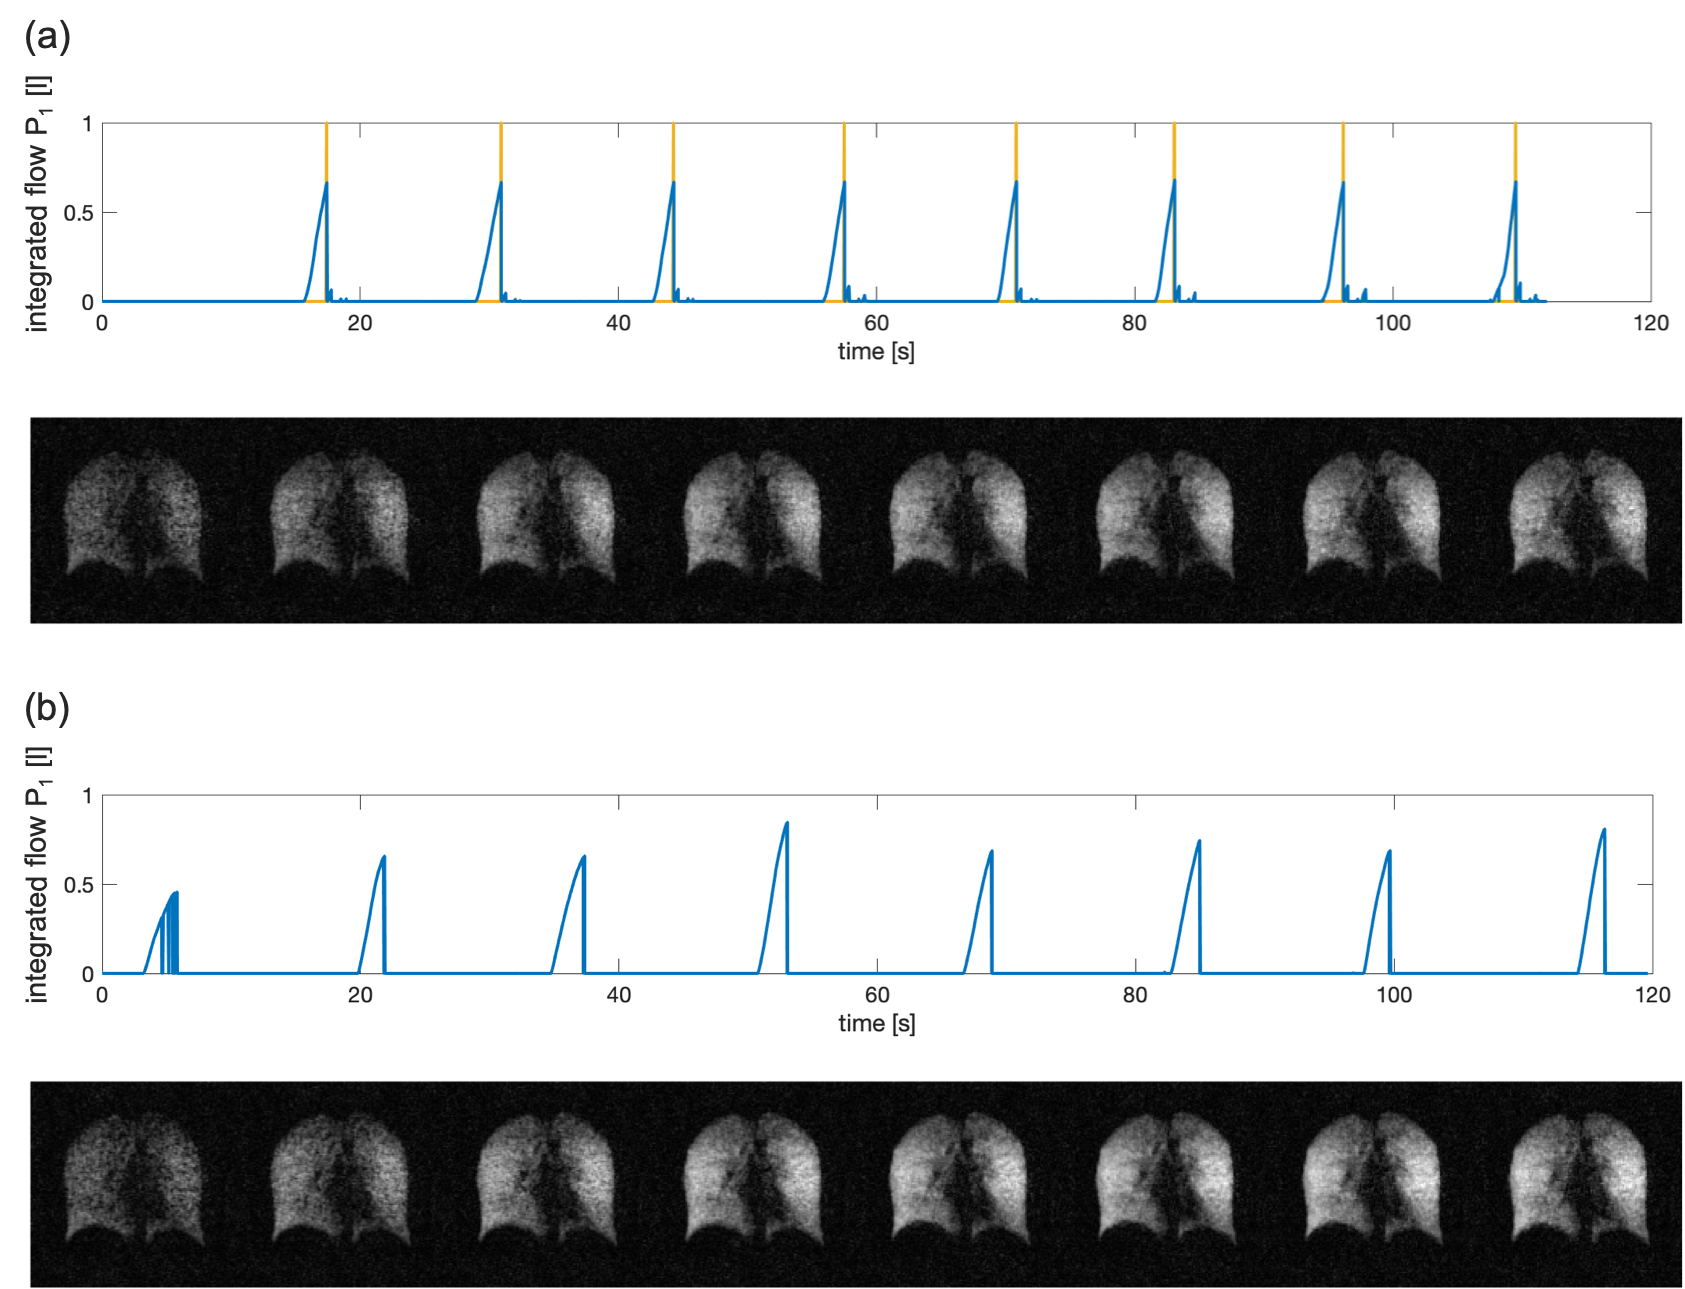
Figure 2: Integrated flow measured with the pneumotachometer in the
inspiratory tubing (P1) and ventilation images of a central slice
for a healthy subject with (a) and without volume control (b). The yellow lines
in (a) show the signals for MR sequence triggering.
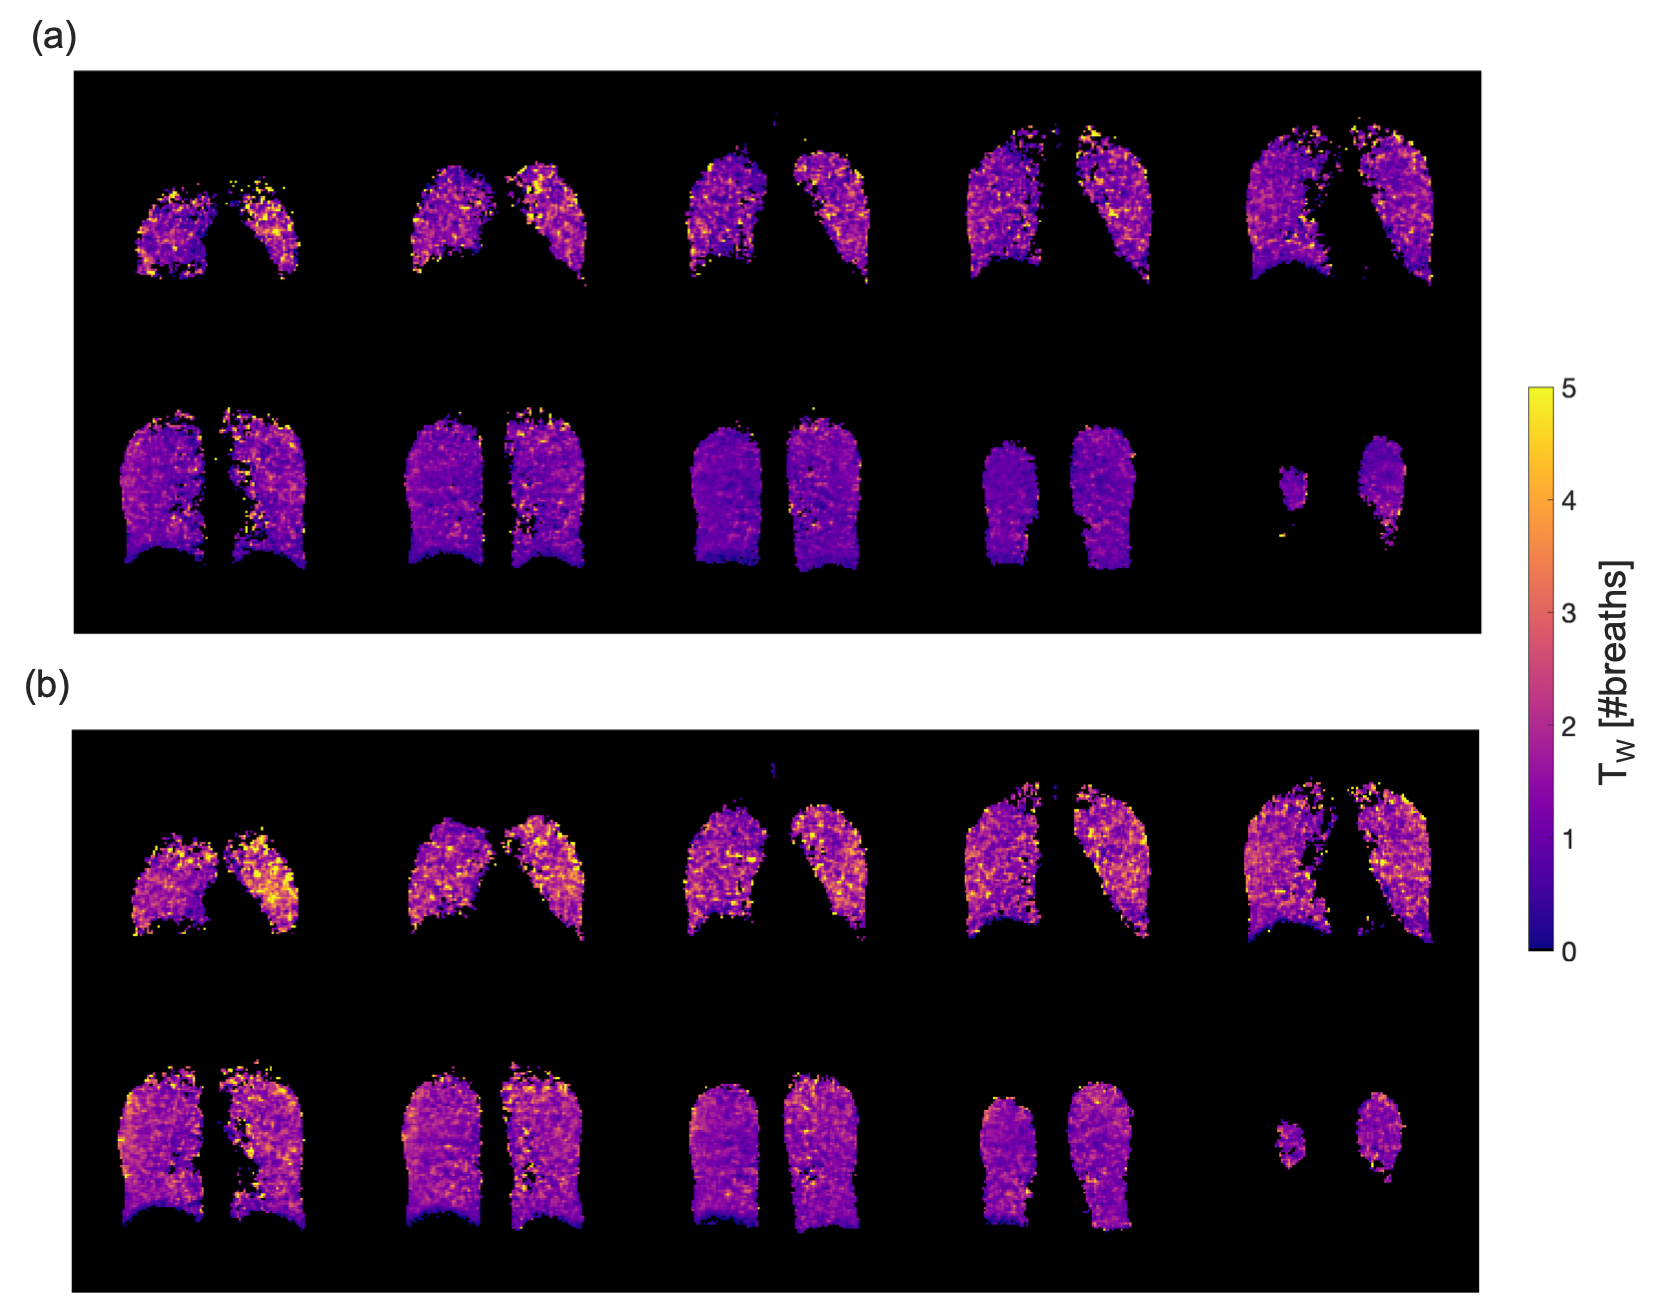
Figure 3: TW maps for a healthy
volunteer with (a) and without (b) volume control. When using the
volume-controlled setup, wash-in times are generally lower and more homogeneous
compared to the non-controlled scan.
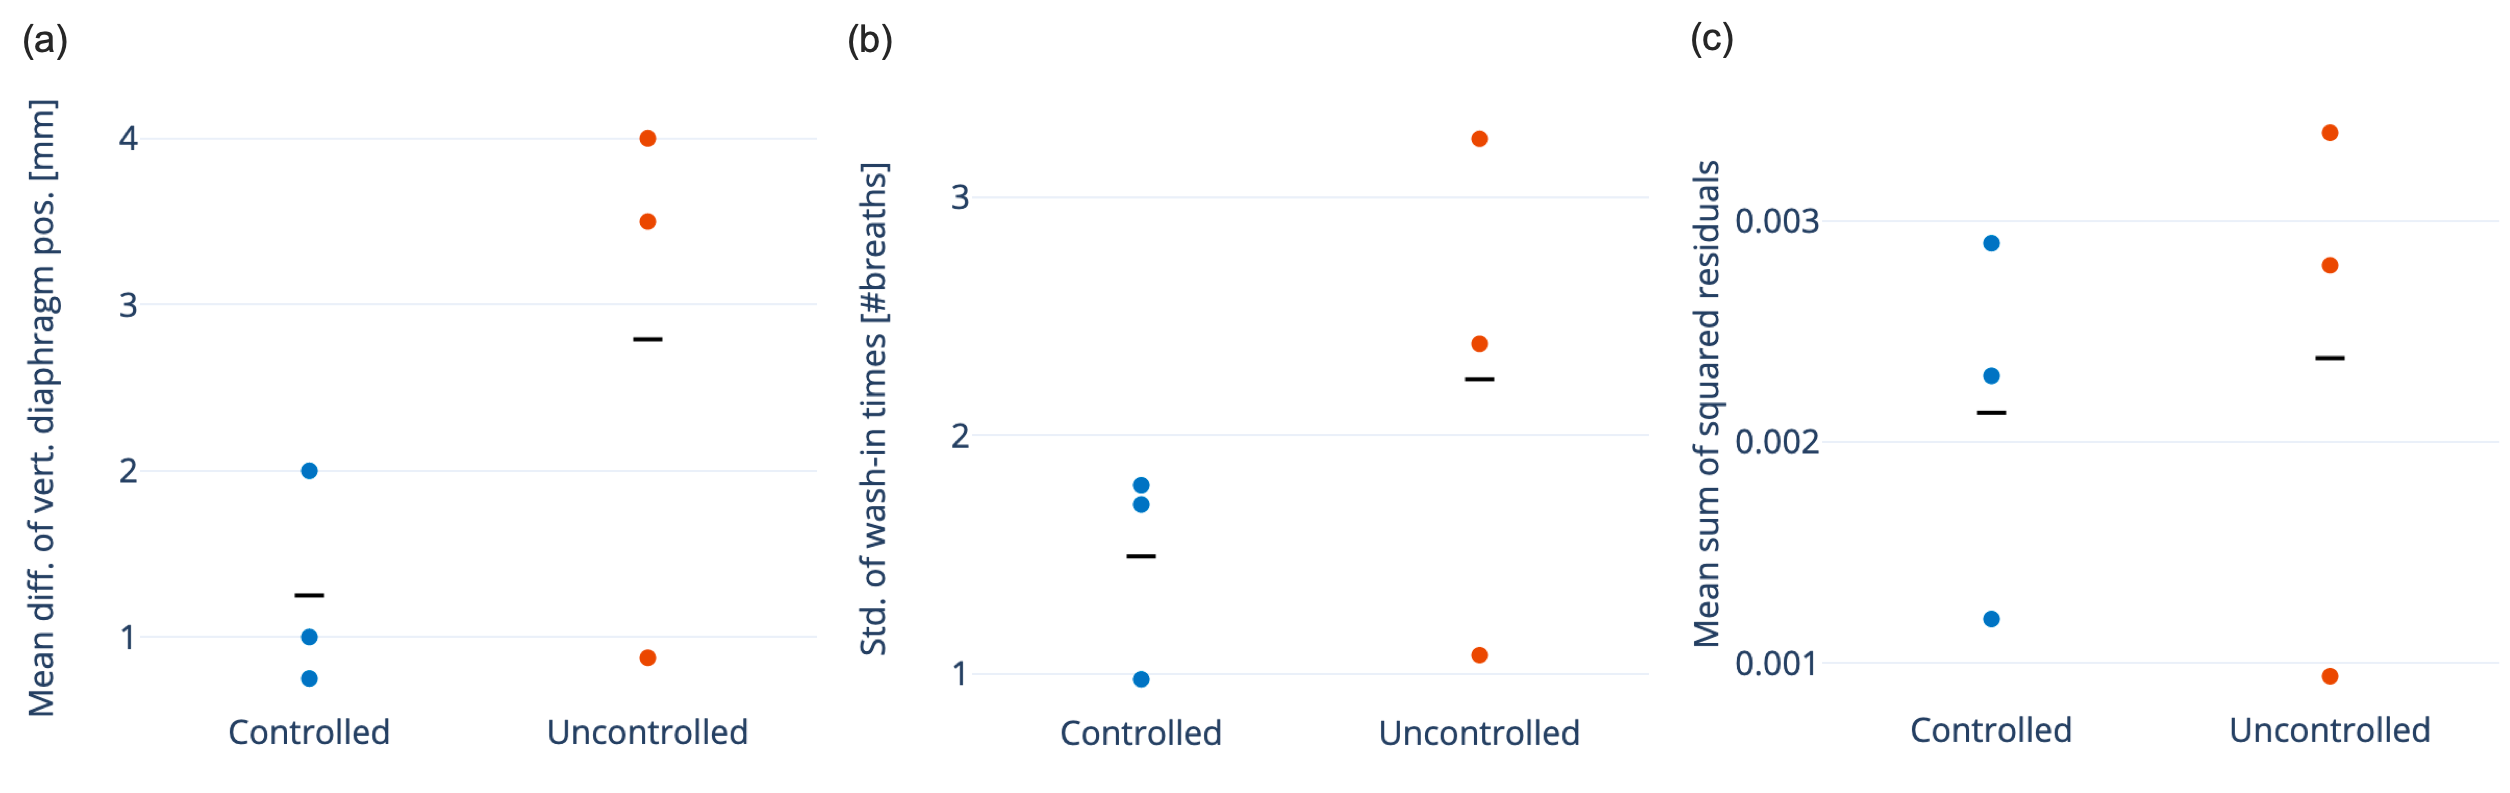
Figure 4: Comparison of volume-controlled (blue) and uncontrolled
examinations (red) in three healthy volunteers. (a) Mean difference of vertical
diaphragm position for all breath-holds compared to the last breath-hold in a
central slice, (b) standard deviation of TW in number of breaths
over the whole lung, (c) mean sum of squared residuals for the wash-in fit. The graphs indicate
that the position of the diaphragm is more stable, the standard deviation of TW is lower, and the model for TW fits the data better when comparing
volume-controlled to non-controlled scans.
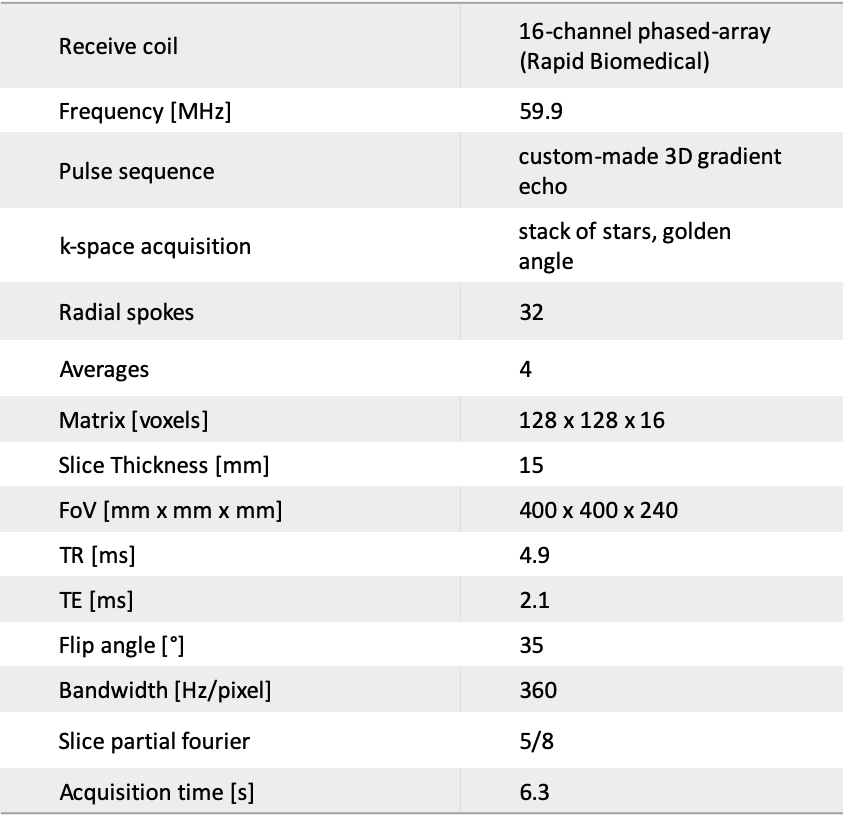
Table 1: Scanning parameters for 19F MR imaging.