0434
Noninvasive Assessment of Electrical Conductivity of Lung and Mediastinal Mass Lesions: Feasibility and Potential Clinical Value
Khin Khin Tha1,2, Ulrich Katscher3, Eiki Kikuchi4, Yasuka Kikuchi1, Yuki Yoshino1, Kinya Ishizaka5, Noriko Manabe1,2, Kohsuke Kudo1,2, and Hiroki Shirato2
1Department of Diagnostic and Interventional Radiology, Hokkaido University Hospital, Sapporo, Japan, 2Global Station for Quantum Medical Science and Engineering, Hokkaido University, Sapporo, Japan, 3Philips Research Laboratories, Hamburg, Germany, 4First Department of Medicine, Hokkaido University Hospital, Sapporo, Japan, 5Department of Radiological Technology, Hokkaido University Hospital, Sapporo, Japan
1Department of Diagnostic and Interventional Radiology, Hokkaido University Hospital, Sapporo, Japan, 2Global Station for Quantum Medical Science and Engineering, Hokkaido University, Sapporo, Japan, 3Philips Research Laboratories, Hamburg, Germany, 4First Department of Medicine, Hokkaido University Hospital, Sapporo, Japan, 5Department of Radiological Technology, Hokkaido University Hospital, Sapporo, Japan
Synopsis
We evaluated the feasibility of σ measurable by EPT in evaluating lung and mediastinal mass lesions. EPT was performed in 21 patients with lung or mediastinal mass lesions. The lesion σ distribution, its relationship with histological findings, lesion size, location and the number of successful scans were evaluated. The malignant tumors had larger maximum σ and intralesional standard deviation and contrast. The larger the lesions, the greater were the intralesional contrast and entropy. The number of possible dynamic scans for reconstruction appeared to be larger in the upper lobe tumors, but the findings need to be confirmed with larger samples.
Introduction
Electric Properties Tomography (EPT) is an MRI technique that noninvasively estimates electrical conductivity (σ) of tissues in vivo1. Studies on brain2, breast3, and hepatic4 tumors have suggested the potential clinical usefulness of σ values measurable by EPT in tumor grading and differentiation between malignant and benign tumors or tumor and normal tissue. The clinical applicability of EPT in lung and mediastinal lesions is not yet known. EPT of the lung and mediastinum can be challenging due to too low proton content in the adjacent lung tissue, abrupt magnetic susceptibility changes at tissue interfaces, and cardiothoracic motion.This study was aimed to determine the feasibility of σ measurable by EPT in evaluating lung and mediastinal mass lesions.
Methods
This prospective study was approved by the institutional review board, and written informed consent was obtained from the participants. Twenty-one patients with lung (N=19) or mediastinal (N=2) mass lesions who had not yet undergone treatment and consented for the study were included. MRI was performed using a 3T scanner (Achieva TX, Philips Healthcare, Best, the Netherlands). EPT was performed using a 2D-steady state free precession (SSFP) sequence. A total of ten dynamic sagittal scans were obtained under single breath-hold (TR/TE = 16/4 ms, FA = 30°, NSA = 2, voxel size = 2 x 2 x 5 mm3, number of slices = 1). The phase of scans with successful breath-holding (mutual correlation above 99%) was used to calculate σ by using the formula $$$σ=∇^2 φ^+/μ_0 ω $$$, where φ+ = the phase of H+ (the positive circularized component of the magnetic field H+ = (Hx+ iHy/2), μ0 = magnetic vacuum permeability, and ω = Larmor frequency. The σ distribution (mean, median, maximum, mode, standard deviation, contrast, correlation, entropy) in each lesion and its relationship with histological findings, lesion size, location, and the number of successful dynamic scans were evaluated, by using two-sample t-tests or Pearson's product-moment correlation analyses. Statistical significance was set as P<0.05. Correction for multiple comparisons was not made.Results
There were altogether 22 lesions (20 lung and 2 mediastinal lesions), which included 15 adenocarcinomas, 1 adenosquamous carcinoma, 3 squamous cell carcinoma, 1 schwannoma, 1 bronchial cyst, and 1 leiomyoma. Of these, image reconstruction was not possible in 4 adenocarcinomas and 1 squamous cell carcinoma, due to too small lesion size and prominent cardiothoracic motion across all dynamic scans. This gave 17 lesions (15 lung and 2 mediastinal lesions, 14 malignant tumors and 3 benign lesions) available for the σ evaluation. The σ mapping was done from 3 to 9 dynamic scans showing sufficient mutual correlation.The σ distribution of the 17 lesions is given in Figure 1. The malignant tumors had a significantly larger maximum (P=0.026, two-sample t-tests), standard deviation (P=0.025, two-sample t-tests) and contrast (P=0.014, two-sample t-tests) than the benign lesions. The σ maps, along with the magnitude images of the 2D-SSFP sequence, of two representative cases are given in Figures 2-3.
The lesion size ranged from 4 to 1951 mm2 (median=151 mm2) in malignant tumors and 23 to 73 mm2 (median=23 mm2) in benign lesions. The malignant tumors tended to have larger lesion size (P=0.067, two-sample t-tests). The larger the lesions, the greater were intralesional contrast and entropy (P<0.001, Pearson's product-moment correlation analyses) (Figure 4). These correlations survived even after controlling for histological findings.
Of 14 lung cancers, 11 tumors were located in the upper lobe and 3 in the middle or lower lobe. The upper lobe tumors appeared to have a larger number of successful dynamic scans for reconstruction (3-5 scans for the upper lobe and 3 scans for the middle or lower lobe).
No significant relationship between the lesion σ distribution and the number of successful dynamic scans was observed.
Discussion
The higher maximum σ of malignant lesions than the benign counterpart is thought to be due to higher sodium ion concentration and/ or mobility within these tumors. This finding is in agreement with previous reports about higher σ in malignant tumors2,3. Larger intralesional standard deviation and contrast of σ in malignant lesions are thought to indicate intratumor heterogeneity. Intratumor heterogeneity is a characteristic of malignant tumors and is probably due to genomic and biological variations within the tumor gained by tumor cell evolution under diverse microenvironments linked to different etiologies5.Larger intralesional contrast and entropy in larger lesions are also reflective of intralesional heterogeneity in larger lesions. These findings are considered plausible since larger tumors tend to suffer from hypoxia, necrosis and cystic degeneration6.
The larger number of possible dynamic scans in the upper lobe lung cancers may indicate that respiratory motion affects EPT scans. Respiratory motion is usually more pronounced in the lower lobes7. However, this observation needs to be confirmed with a larger sample size because the number of the middle or lower lobe cancers in this study was too small.
Conclusions
This study evaluated the feasibility of noninvasive σ measurement in evaluating lung and mediastinal mass lesions. Malignant and large tumors appear to be characterized by higher σ and larger intratumor heterogeneity. EPT probably suffers from respiratory motion. The development of EPT robust against respiratory motion is desired.Acknowledgements
This study was supported by the grants-in-aid for scientific research by the Japan Society for Promotion of Science (17K10390 and FY2017 JSPS Invitation Fellowship for Research in Japan) and the Global Institution for Collaborative Research and Education, Hokkaido University.References
- Katscher U, Kim DH, Seo JK. Recent progress and future challenges in MR electric properties tomography. Comput Math Methods Med. 2013; 2013: 546562.
- Tha KK, Katscher U, Yamaguchi S, et al. Noninvasive electrical conductivity measurement by MRI: a test of its validity and the electrical conductivity characteristics of glioma. Eur Radiol. 2018; 28: 348-355.
- Kim SY, Shin J, Kim DH, et al. Correlation between conductivity and prognostic factors in invasive breast cancer using magnetic resonance electric properties tomography (MREPT). Eur Radiol 2016; 26:2317‐2326.
- Tha KK, Katscher U, Ishizaka K, et al. Noninvasive Assessment of Electrical Conductivity Characteristics of Normal and Diseased Liver Using Electric Properties Tomography. Proc Intl Soc Mag Reson Med 2018; 26: 5085.
- Liu J, Dang H, Wang X. The significance of intertumor and intratumor heterogeneity in liver cancer. Exp Mol Med 2018; 50: e416.
- De Jaeger K, Merlo FM, Kavanagh MC, Fyles AW, Hedley D, Hill RP. Heterogeneity of tumor oxygenation: relationship to tumor necrosis, tumor size, and metastasis. Int J Radiat Oncol Biol Phys 1998; 42:717-721.
- Chen A, Pastis N, Furukawa B, Silvestri GA. The effect of respiratory motion on pulmonary nodule location during electromagnetic navigation bronchoscopy.Chest 2015; 147: 1275-1281.
Figures
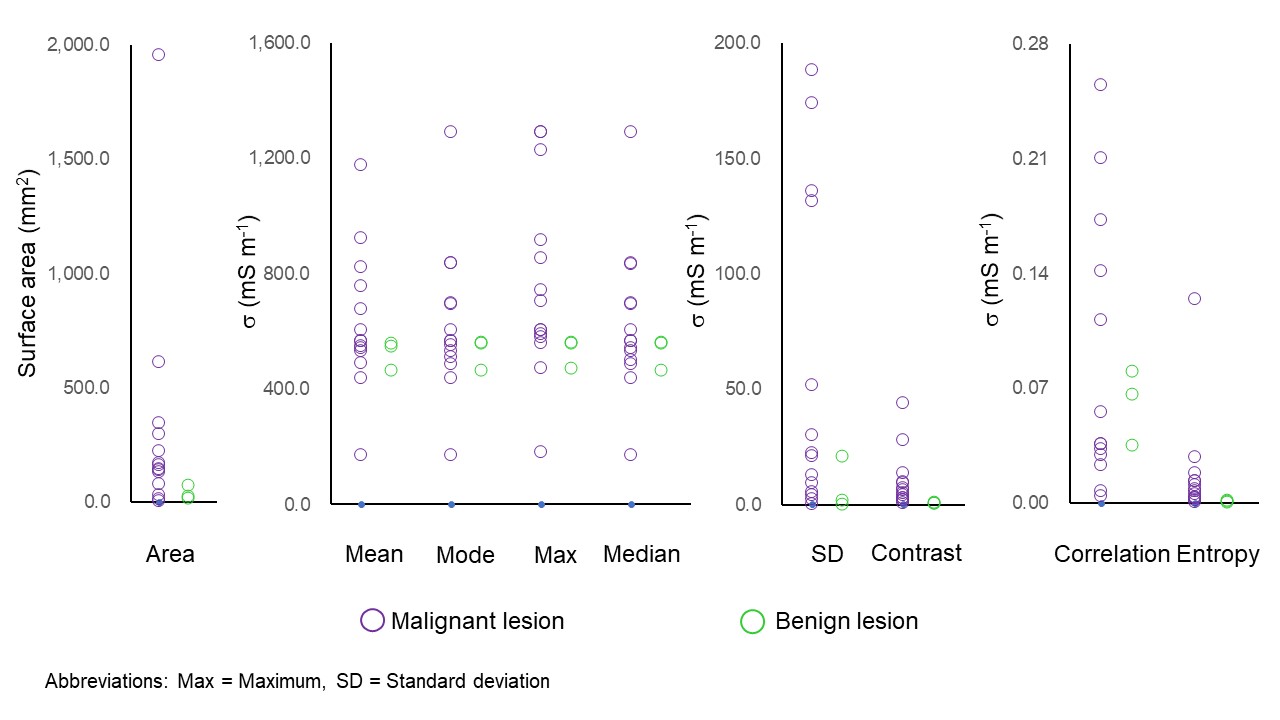
The electrical conductivity (σ) distribution in lung and mediastinal lesions (N=17). Surface area (dimension feature), mean, mode, maximum, and median (intensity features), and standard deviation, contrast, correlation and entropy (texture features) are extracted.
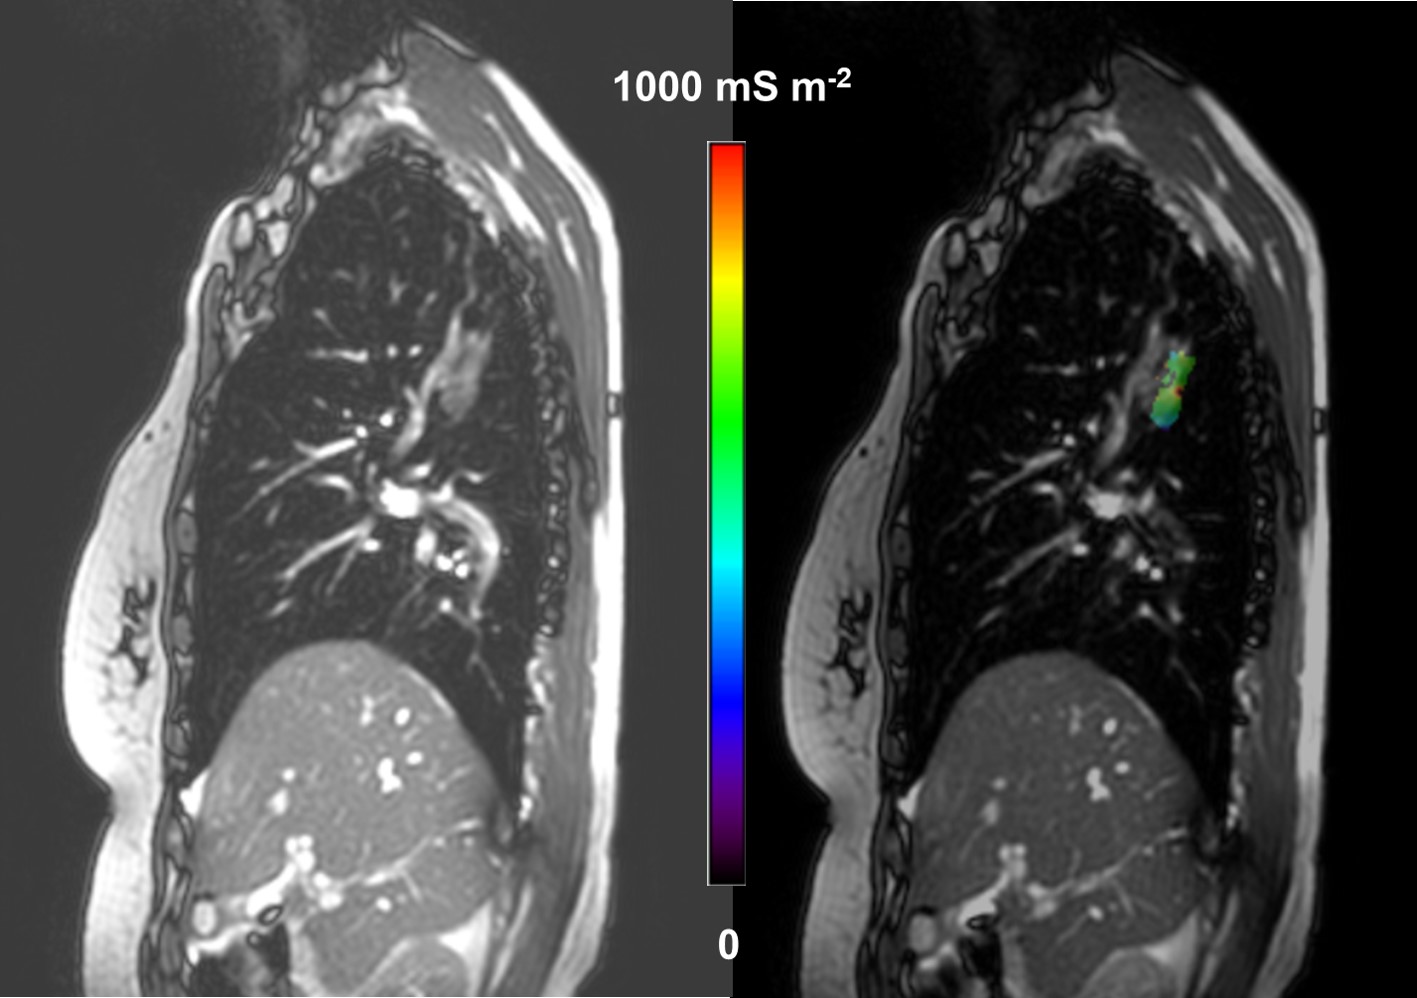
A 66-year-old woman with right upper lobe invasive adenocarcinoma. The σ distribution in the tumor is shown by overlaying the lesion σ map onto the magnitude image of the 2D-steady state free precession (SSFP) sequence (Right). The magnitude image of the 2D-SSFP sequence without overlay is also given (Left).
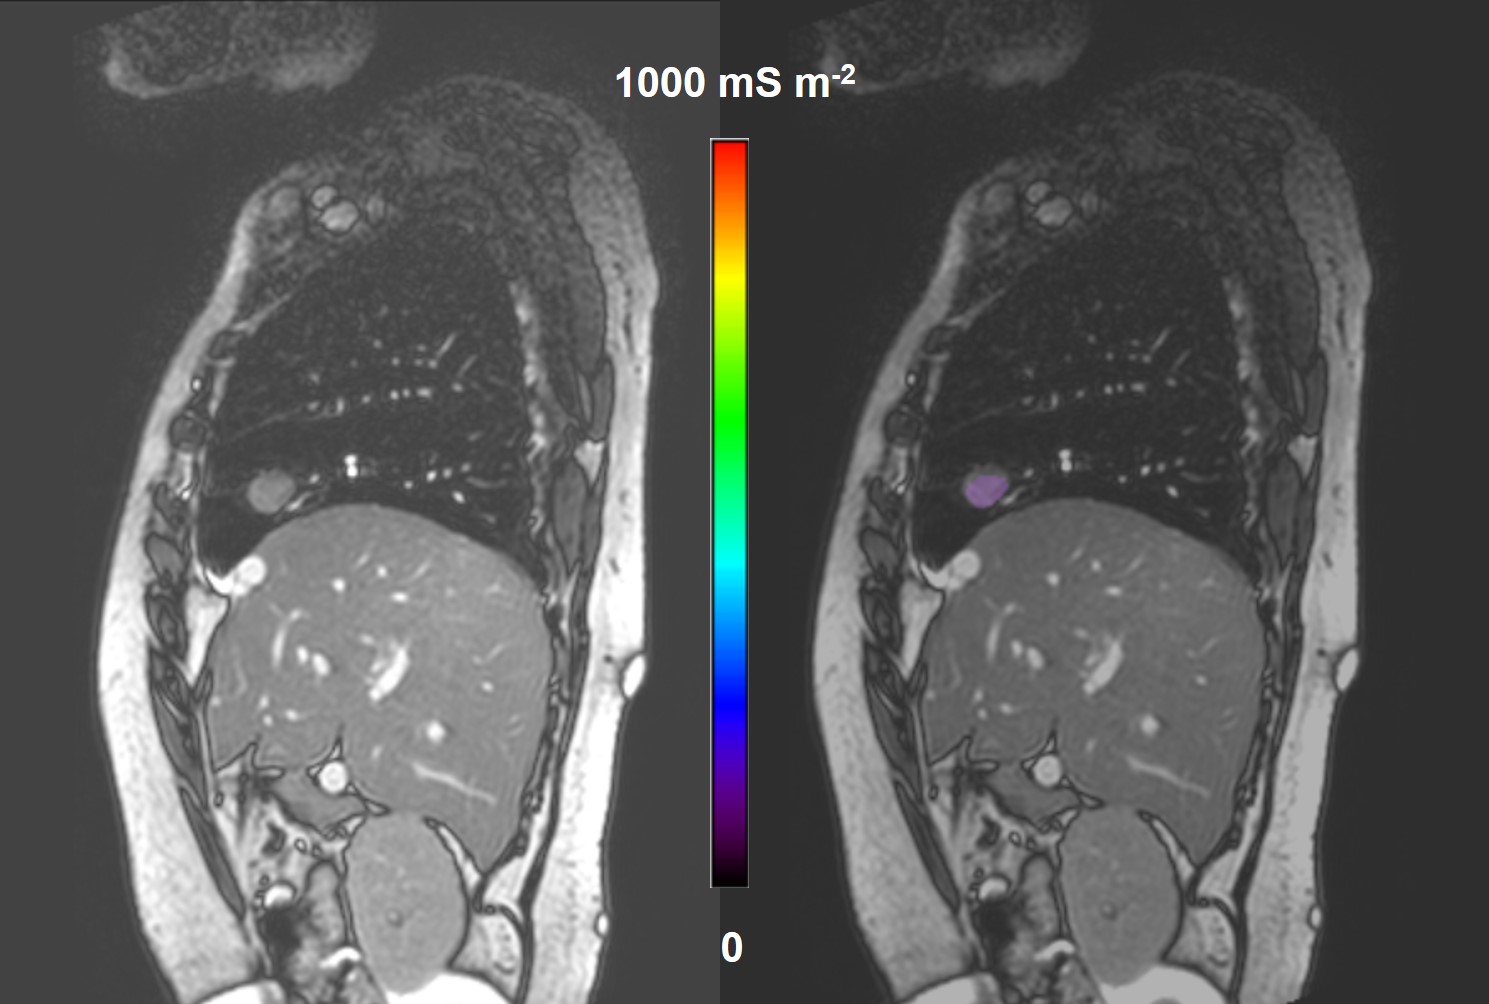
A 70-year-old woman with right middle lobe leiomyoma. The σ distribution in the tumor is shown by overlaying the lesion σ map onto the magnitude image of the 2D-SSFP sequence (Right). The magnitude image of the 2D-SSFP sequence without overlay is also given (Left).
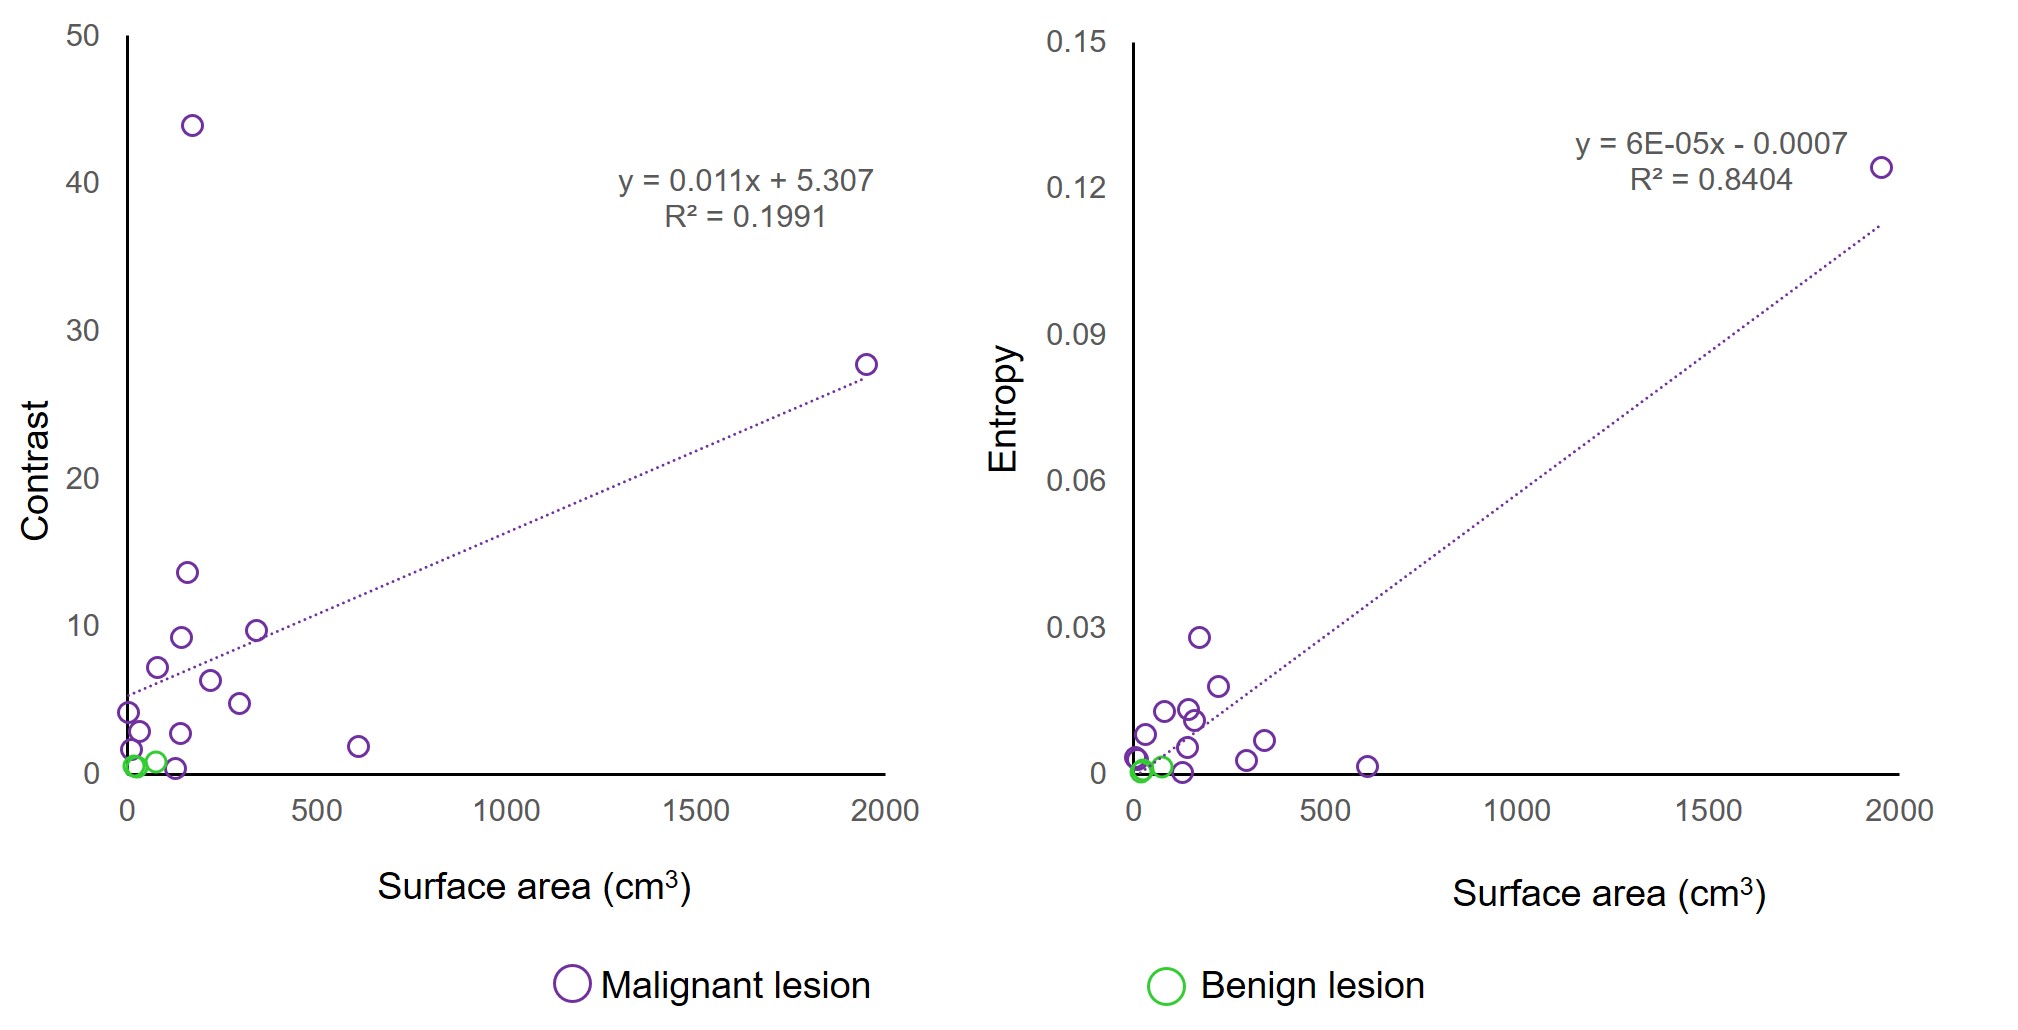
Scatterplots showing the relationship between the intralesional contrast (r=0.905, P<0.001) or entropy of σ (r=0.984, P<0.001) and the tumor size in terms of surface area. Moderate to strong positive correlations are observed.