0432
Imaging Regional Capillary Cardio-Pulmonary Blood Flow Dynamics using Hyperpolarized 129Xe MRI and Keyhole Reconstruction1Center for Pulmonary Imaging Research, Cincinnati Children's Hospital Medical Center, Cincinnati, OH, United States, 2Department of Biomedical Engineering, Duke University, Durham, NC, United States, 3Center for In Vivo Microscopy, Duke University Medical Center, Durham, NC, United States, 4Department of Radiology, Duke University Medical Center, Durham, NC, United States, 5Department of Pediatrics, University of Cincinnati Medical Center, Cincinnati, OH, United States
Synopsis
Hyperpolarized 129Xe MRI offers the ability to analyze pulmonary gas transfer by imaging 129Xe dissolved in red blood cells (RBCs) separately from 129Xe in other tissues. A notable feature of the dissolved 129Xe signal is the presence of small cardiogenic oscillations in the 129Xe RBC signal, which have been used to characterized global abnormalities in pulmonary microvascular hemodynamics. Here, we demonstrate that these cardiogenic oscillations can be mapped 3-dimensionally to image capillary bed hemodynamics. Our approach uses keyhole reconstruction of standard 129Xe gas exchange MR acquisitions. Metrics obtained from these maps distinguished healthy from disease cohorts and predicted disease progression.
Introduction
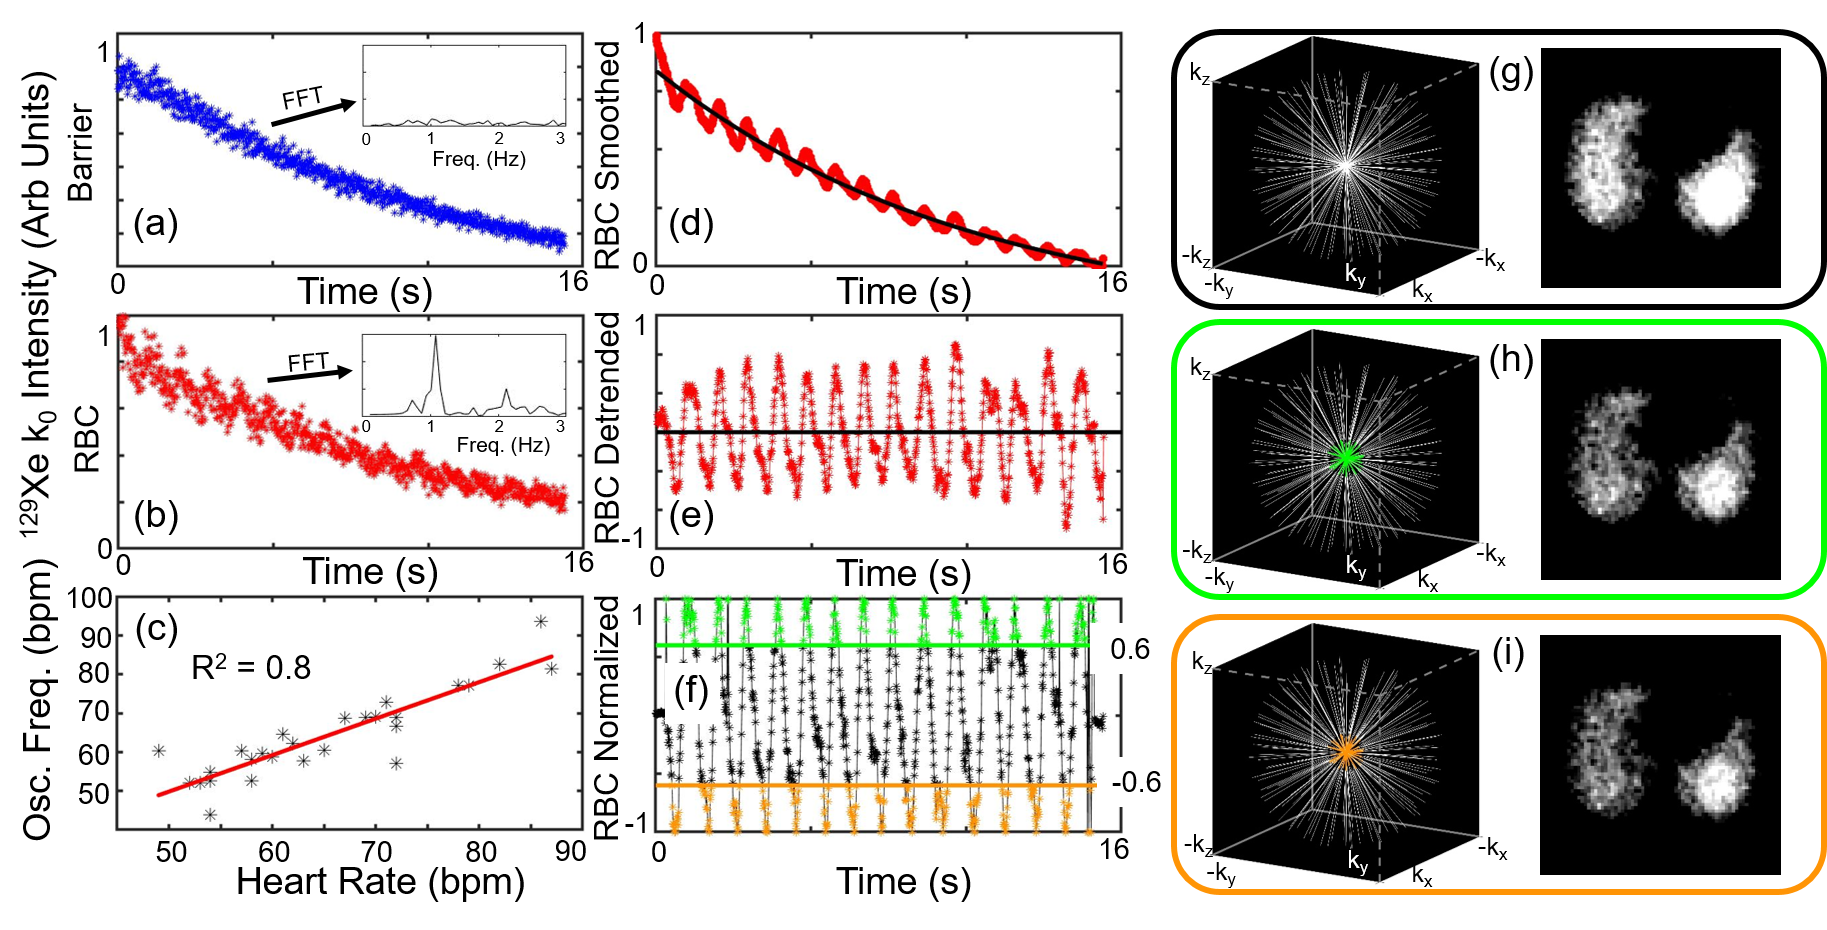
Cardiovascular abnormalities stemming from dysfunction in the pulmonary microvasculature are a common comorbidity or defining characteristic of a variety of lung diseases.1 While CT and MRI metrics have been used to quantify defects in larger pulmonary vasculature, sensitivity to the smaller vessels of the lungs (e.g., the gas exchange capillaries) is lacking in current imaging techniques.2 In recent years, hyperpolarized (HP) 129Xe MRI has emerged as a method to probe regional lung function, and of particular interest, MRI of HP 129Xe dissolved in red blood cells (RBCs) and other tissues has been used to image regional gas exchange using 1-Point Dixon imaging.3 These images have been shown to be sensitive to impaired gas transfer in a variety of lung diseases.4-6 Additional metrics derived from whole-lung 129Xe dynamic spectroscopy have revealed global cardiogenic oscillations in the 129Xe signal dissolved in RBCs that appear to reflect pulmonary vascular disease.7,8 Notably, these same cardiogenic oscillations are also present in the raw data of HP 129Xe gas exchange imaging (Figure 1). Herein, we show that these cardiogenic oscillations can be mapped regionally using keyhole image reconstruction9, providing images of local hemodynamics within the pulmonary capillary bed.Methods
Healthy (N=12), idiopathic pulmonary fibrosis (IPF) (N=12), pulmonary arterial hypertension (PAH) (N=10), and left heart failure (LHF) (N=6) subjects underwent HP 129Xe 1-point Dixon gas exchange MRI after inhaling 1L of xenon. Some subjects (N=7 Healthy, N=7 IPF, N=10 PAH, N=5 LHF) also underwent whole-lung 129Xe dynamic spectroscopy for analysis of cardiogenic oscillations. Of the subjects who were imaged, healthy (N=8) and IPF (N=12) were imaged on a 1.5T scanner (GE 15M4 EXCITE), while all others were imaged on a 3T scanner (SIEMENS MAGNETOM Trio). Of the 12 IPF subjects, N=8 were imaged a second time ~12 months following the initial scan.The first point on each dissolved phase radial projection (k0) was phase-shifted such that the mean real to imaginary signal ratio matched the spectroscopically-acquired RBC/Barrier ratio, thus separating RBC and Barrier signals into these channels.3 The RBC k0 signal exhibited oscillations, but the Barrier did not (Figure 1). RBC signal at k0 was then temporally smoothed, detrended, and oscillation amplitudes were normalized to bin projections into high (>0.6×max) and low (<-0.6×max) bins (Figure 1). These binned projections were used to define “keys” for keyhole reconstruction. The key radius was chosen as the largest k-space radius at which k-space was at least 50% sampled. Images were reconstructed using unsmoothed, detrended data for the “high” key, the “low” key, and the complete, non-keyhole dataset.
After reconstruction, images were separated into RBC and barrier components again using the RBC/Barrier ratio. Oscillation amplitude maps were defined voxel by voxel by
(High Key – Low Key)/Non-Keyholed Image×100%
for total dissolved and Barrier images, and by
(High Key – Low Key)/mean(Non-Keyholed Image)×100%
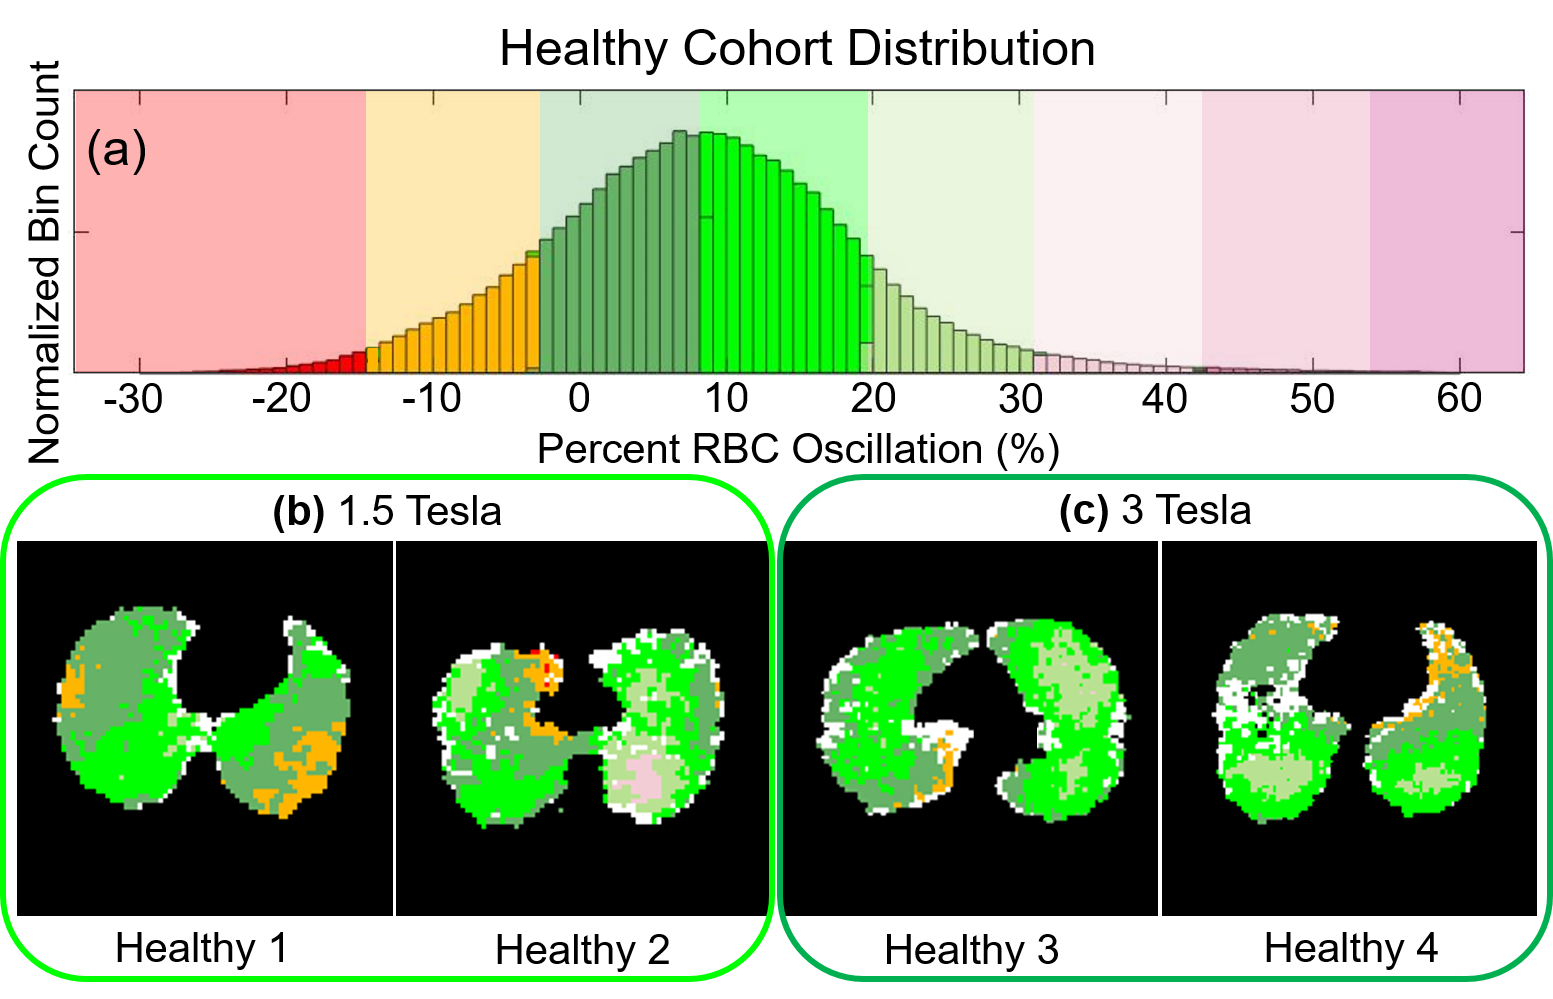
for RBC images (Figure 2) to accommodate the lower SNR in these images. Voxels with SNR<1.5 were removed. RBC oscillation amplitude images were then binned based on the total mean and standard deviation (SD) oscillation for all healthy subjects (Figure 3). The percent of lung voxels binned into “Low” (<healthy mean – 1SD) and “High” (>healthy mean + 1SD) were compared between subjects.
Results
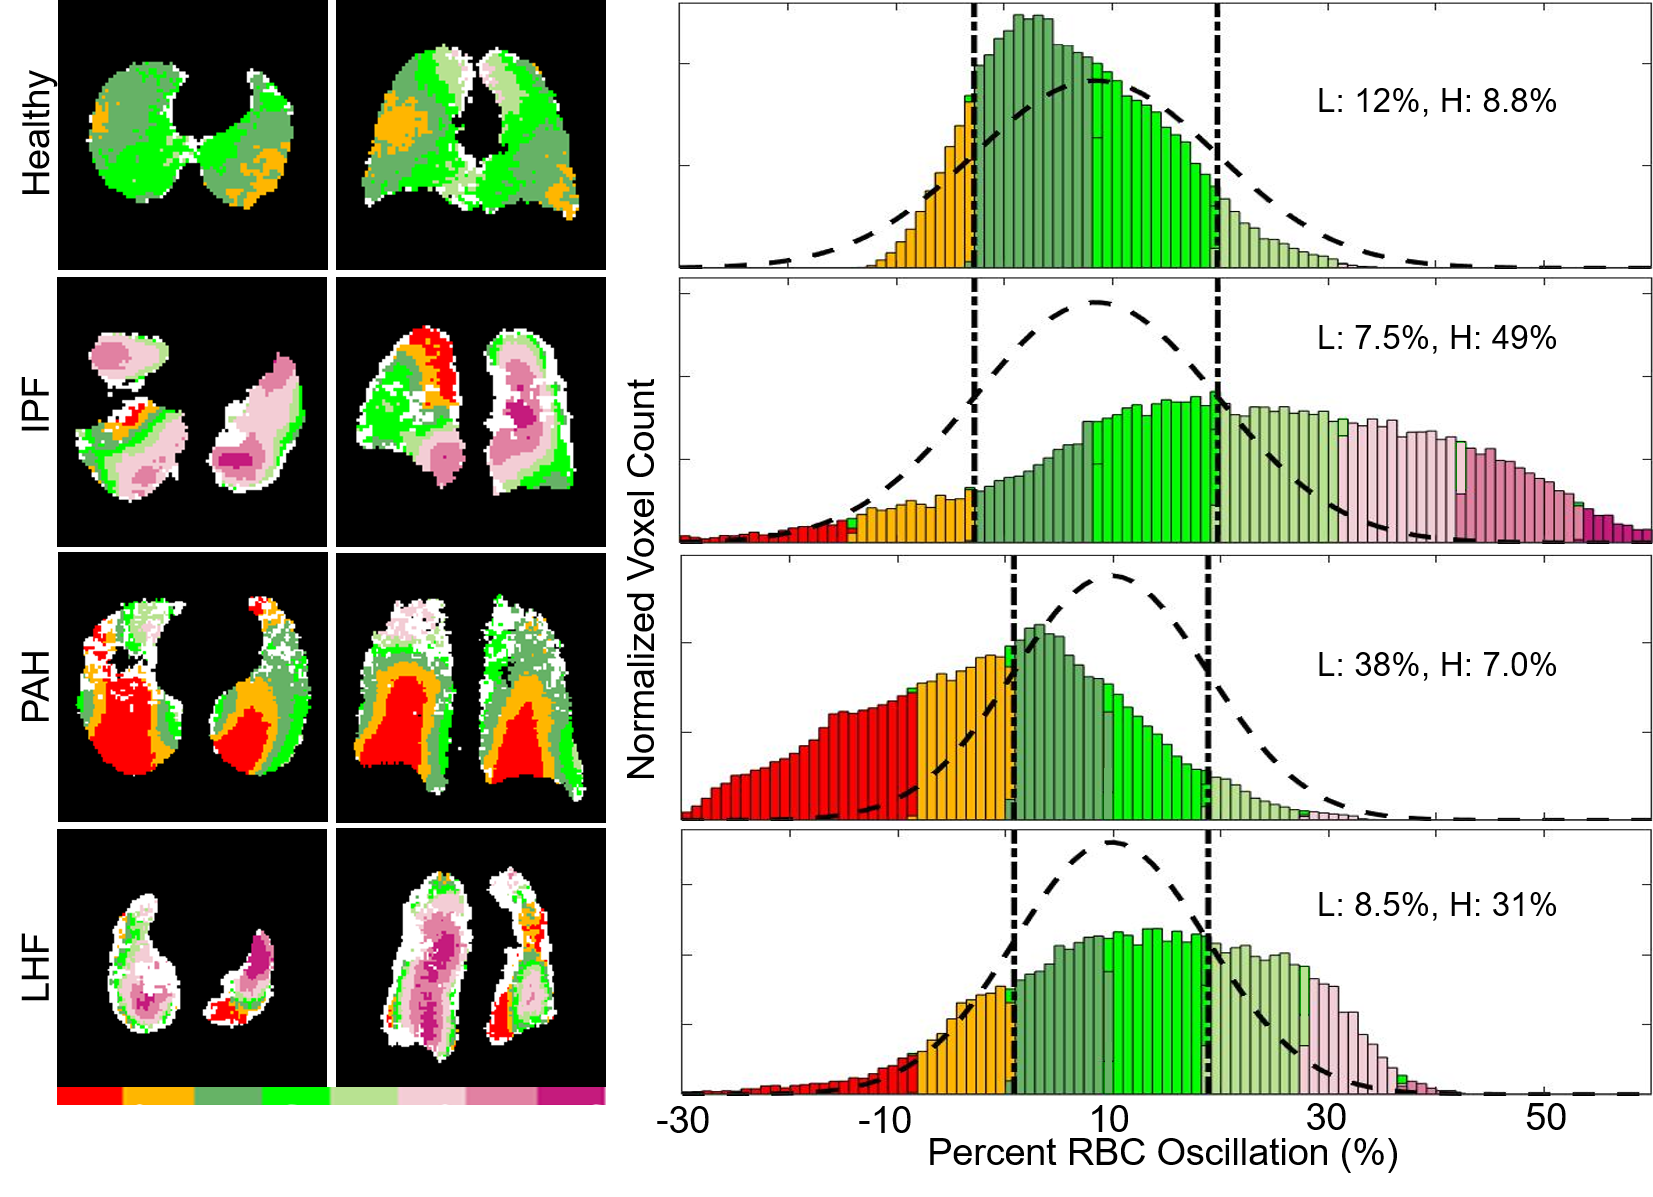
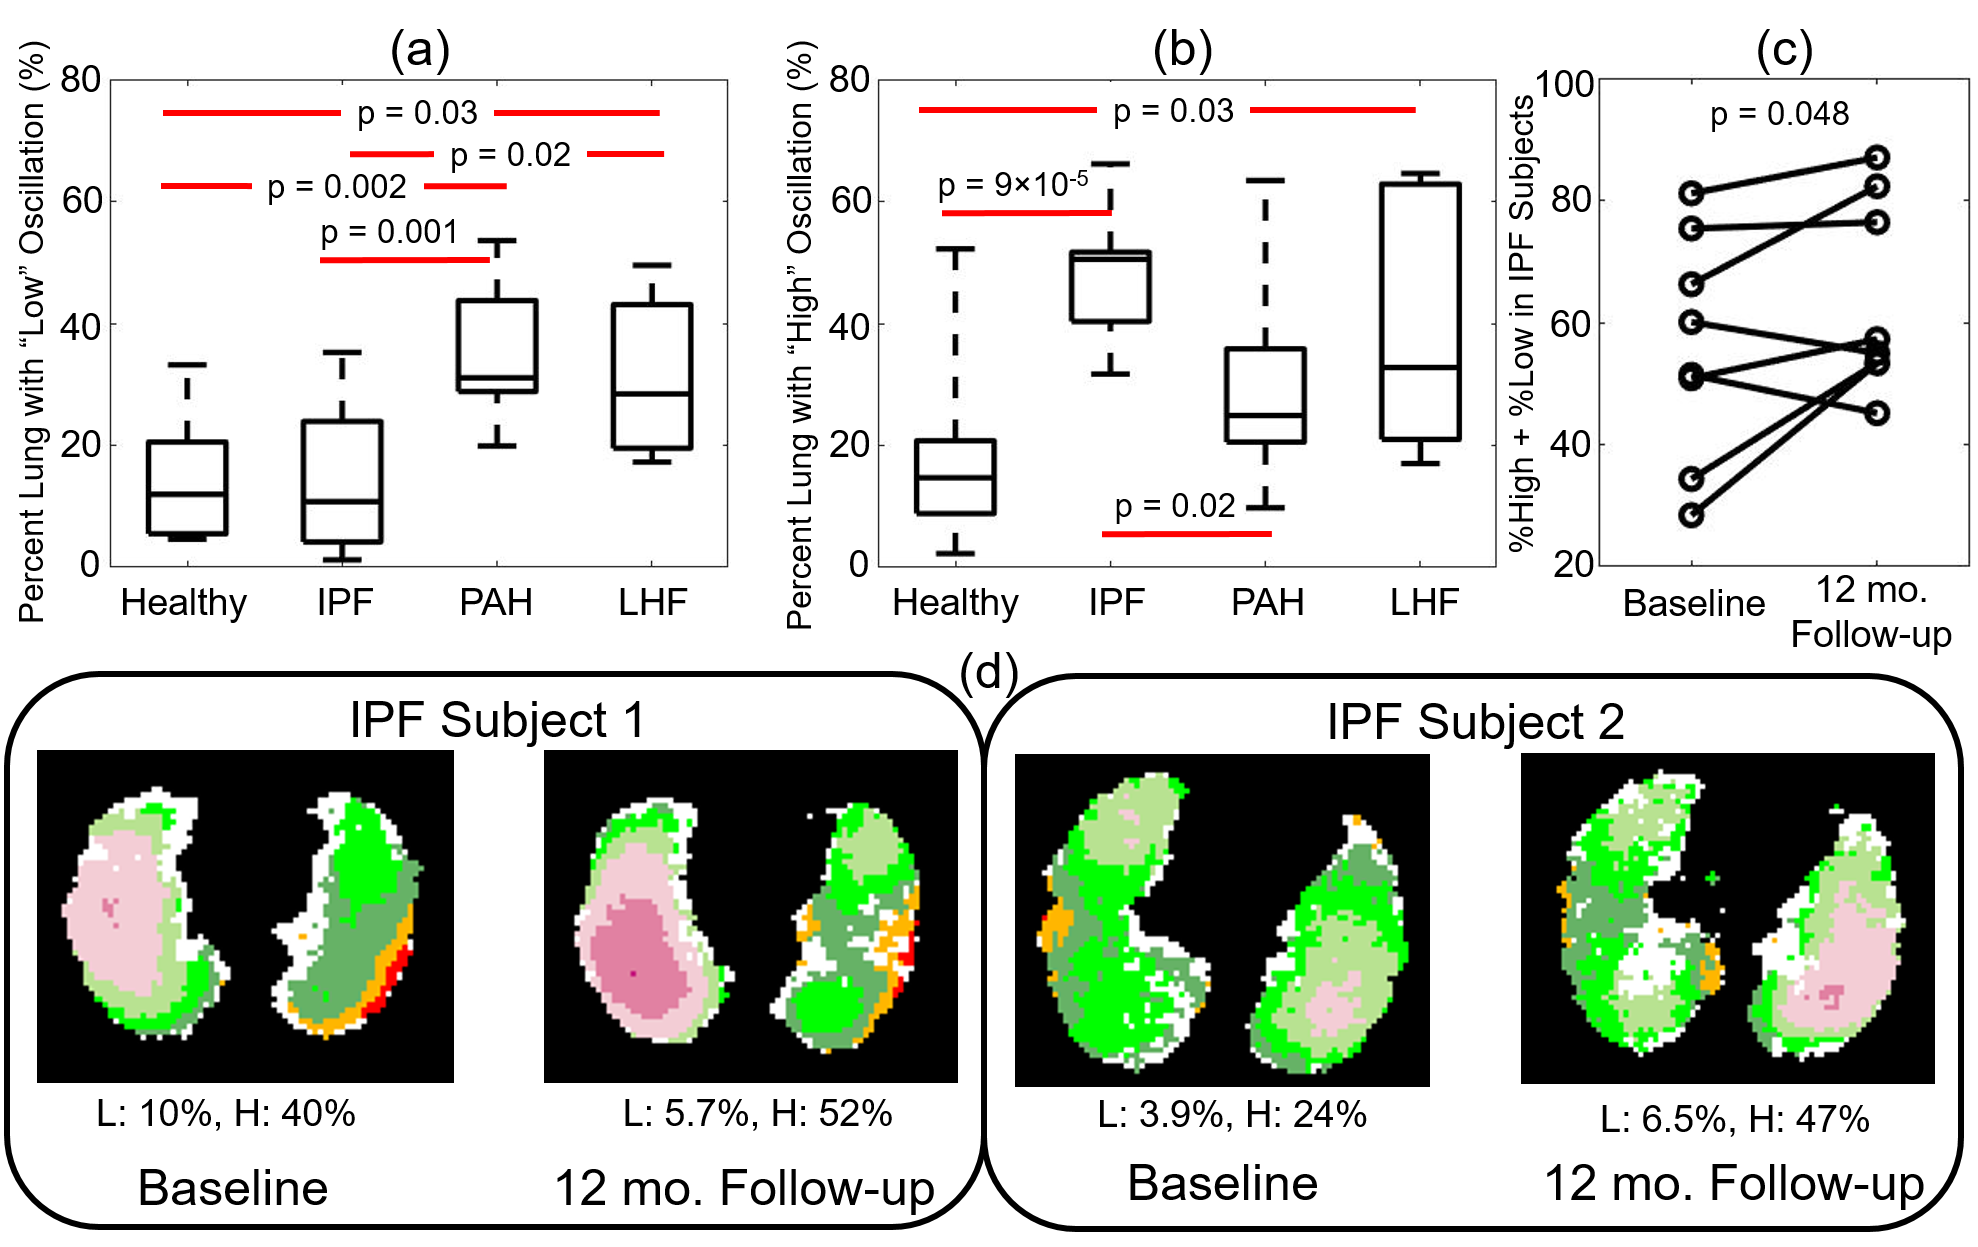
Oscillation amplitude was minimal in the total dissolved phase and barrier images for all subjects. However, RBC images displayed significant oscillation amplitude (Figure 2). Whole lung mean oscillation amplitudes correlated reasonably well with the amplitude measured using whole lung spectroscopy (R2=0.60). Healthy subjects displayed a relatively homogeneous pattern of oscillation, with many subjects exhibiting slightly elevated oscillation amplitude in the posterior portions of the lungs (Figure 3). IPF subjects consistently displayed elevated oscillation amplitude (Figure 4), with the percent of the lungs binned into “high” oscillation significantly higher than healthy (p<0.001) and PAH (p=0.03) subject groups. LHF subjects likewise had a larger percentage binned into the “high” region than healthy subjects (p=0.03). In contrast, PAH and LHF subjects had a greater percent of the lungs binned into “low” oscillation than healthy (PAH: p=0.002, LHF: p=0.03) and IPF (PAH: p=0.001, LHF: p=0.02) (Figure 5). In longitudinal imaging of IPF subjects, neither the percent of lung binned into low nor the high regions changed significantly over time. However, the percent of lung outside of the normal region (%low + %high) increased significantly (p=0.048) (Figure 5).Discussion and Conclusion
By combining keyhole reconstruction and hyperpolarized 129Xe gas exchange imaging, we are able to image cardiopulmonary blood flow dynamics in the capillary bed of the lungs. Metrics derived from this method correlated well with global spectroscopy, and distinguished between the four subject populations studied based on the percentages of the lungs exhibiting low or high oscillation amplitude as compared to the healthy subject cohort. Furthermore, oscillation amplitude mapping over 1 year in a small cohort of IPF subjects who were imaged twice show similar oscillation patterns and generally increasing percentages of lung showing abnormal oscillations. As this technique involves only post-processing, cardiogenic oscillation imaging can readily be derived from existing data. These oscillation data can thus be included in a standard gas exchange acquisition and analysis pipeline to provide metrics of regional microvasculature function for both existing and future data.Acknowledgements
This work was supported by the NIH (T32HL007752, R01HL143011, and R01HL126771) and the Cincinnati Children’s Research Foundation.References
1. Gaskill CF, Carrier EJ, Kropski JA, et al. Disruption of lineage specification in adult pulmonary mesenchymal progenitor cells promotes microvascular dysfunction. The Journal of Clinical Investigation. 2017;127(6):2262-2276.
2. Johns CS, Kiely DG, Swift AJ. Novel imaging techniques in pulmonary hypertension. Current Opinion in Cardiology. 2018;33(6):587-593.
3. Kaushik SS, Robertson SH, Freeman MS, et al. Single-breath clinical imaging of hyperpolarized Xe-129 in the airspaces, barrier, and red blood cells using an interleaved 3D radial 1-Point Dixon acquisition. Magn Reson Med. 2016;75(4):1434-1443.
4. Wang JM, Robertson SH, Wang Z, et al. Using hyperpolarized (129)Xe MRI to quantify regional gas transfer in idiopathic pulmonary fibrosis. Thorax. 2018;73(1):21-28.
5. Wang Z, Bier EA, Swaminathan A, et al. Diverse cardiopulmonary diseases are associated with distinct xenon MRI signatures. European Respiratory Journal. 2019; DOI: 10.1183/13993003.00831-2019.
6. Qing K, Mugler JP, Altes TA, et al. Assessment of lung function in asthma and COPD using hyperpolarized 129Xe chemical shift saturation recovery spectroscopy and dissolved-phase MRI. NMR Biomed. 2014;27(12):1490-1501.
7. Bier EA, Robertson SH, Schrank GM, et al. A protocol for quantifying cardiogenic oscillations in dynamic (129) Xe gas exchange spectroscopy: The effects of idiopathic pulmonary fibrosis. NMR Biomed. 2019;32(1):e4029-e4029.
8. Ruppert K, Altes TA, Mata JF, Ruset IC, Hersman FW, Mugler III JP. Detecting pulmonary capillary blood pulsations using hyperpolarized xenon-129 chemical shift saturation recovery (CSSR) MR spectroscopy. Magn Reson Med. 2016;75(4):1771-1780.
9. Lethmate R, Wajer FTAW, Crémillieux Y, van Ormondt D, Graveron-Demilly D. Dynamic MR-Imaging with radial scanning, a post-acquisition keyhole approach. EURASIP Journal on Advances in Signal Processing. 2003;2003(5):794878.
Figures