0427
Structural and functional lung imaging using a high performance 0.55T MRI system1National Institutes of Health, Bethesda, MD, United States, 2Siemens Medical Solutions, Malvern, PA, United States, 3Siemens Healthcare GmbH, Erlangen, Germany
Synopsis
Lung imaging using conventional MRI has several limitations for clinical use. A contemporary low-field MRI (0.55T) system offers several advantages for structural and functional imaging of lung owing to low magnetic susceptibility and increased oxygen relaxivity. In this abstract we present an improved structural imaging method and functional imaging method for patients with lymphangioleiomyomatosis (LAM) at low-field. Anatomical imaging offers improved delineation of cystic structures in the lung parenchyma. Oxygen-enhanced lung MRI is used to measure ventilation and regional texture in healthy volunteers and this patient group with abnormal pulmonary function.
INTRODUCTION
The application of MRI for clinical lung imaging has remained challenging due to signal dephasing caused by local susceptibility gradients and low proton density [1]. These limitations can be mitigated by the use of a high-performance low-field MRI system that offers improved magnetic field homogeneity and longer T2*, paired contemporary hardware and software allowing advanced imaging methods. In addition, the greater T1 relaxivity of paramagnetic oxygen at 0.55T [2,3] results in increased signal during oxygen-enhanced imaging [4]. Here we used oxygen-enhanced lung MRI to assess ventilation in patients with lymphangioleiomyomatosis (LAM), who have abnormal pulmonary function [5].METHODS
A commercial 1.5T MRI system was altered to operate at 0.55T (prototype MAGNETOM Aera, Siemens Healthcare, Erlangen, Germany), while maintaining gradient performance (45 mT/m maximum amplitude and 200 T/m/s slew rate), RF system and receiver chain. Human imaging experiments were approved by the local Institutional Review Board. Healthy volunteers (n = 10) and patients with LAM (n = 20) underwent imaging on both 0.55T and 1.5T systems for comparison of image quality and increase in signal intensity with oxygen inhalation. A T2-weighted turbo spin echo (TSE) sequence (TE/TR = 47/4403ms, FOV = 270 mm x 360 mm, matrix = 480x640, 32 slices, slice thickness = 6 mm, bandwidth = 260Hz/Px, respiratory triggered) was used to acquire anatomical images. A breath-held 3D T1-weighted ultra-short echo time (UTE) spoiled gradient echo stack-of-spiral prototype sequence was used to generate oxygen-enhanced images (0.55T: TE/TR = 0.15/8.54 ms, spiral readout = 7 ms, flip angle = 17°, FOV = 450 mm x 450 mm, matrix = 128x128, 32 slices, slice thickness = 10mm, bandwidth = 975Hz/Px, scan time = 11 s and 1.5T: TE/TR = 0.17/6.21 ms, spiral readout = 5 ms, flip angle = 20°, FOV = 450 mm x 450 mm, matrix = 128x128, 32 slices, slice thickness = 10 mm, bandwidth = 975 Hz/Px, scan time = 16 s) [6,7]. The UTE images at room air and oxygen were registered using the Elastix algorithm [8] and signal enhancement maps were calculated by taking the percentage difference. The lungs were segmented excluding the major vessels. Mean percentage signal enhancement across the central 5 slices was reported as oxygen enhancement measure. Texture analysis was performed to measure the regional heterogeneity of ventilation maps. Gray level co-occurrence matrix (GLCM) measurements were reported as a metric which is directly proportional to uniformity of signal enhancement.RESULTS
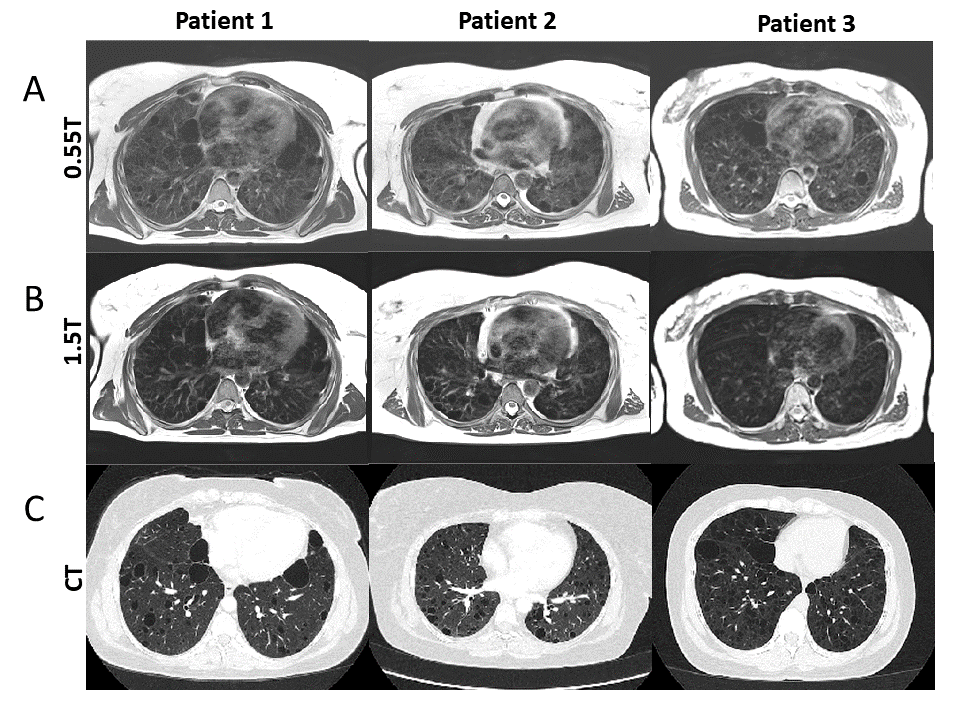
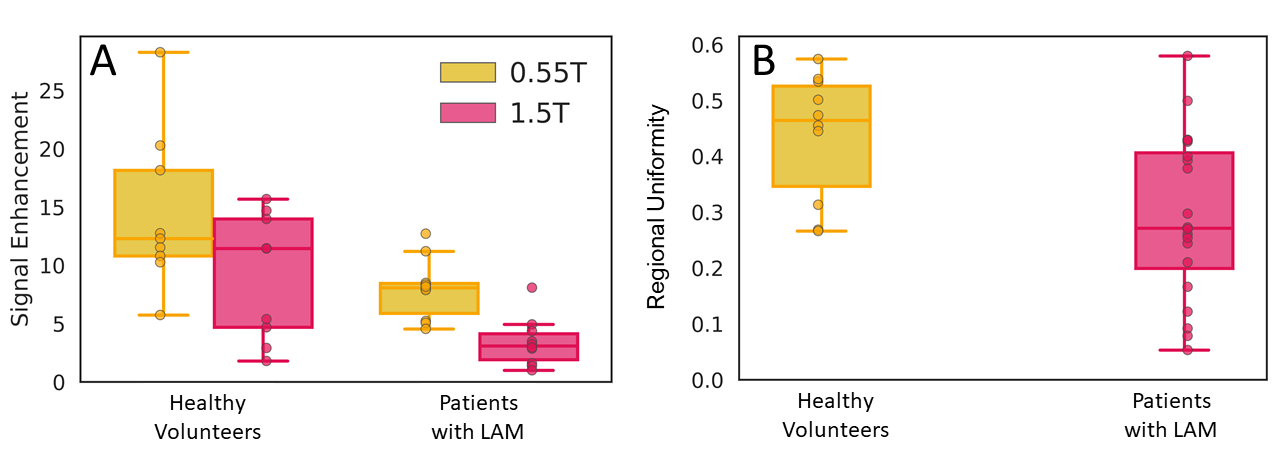
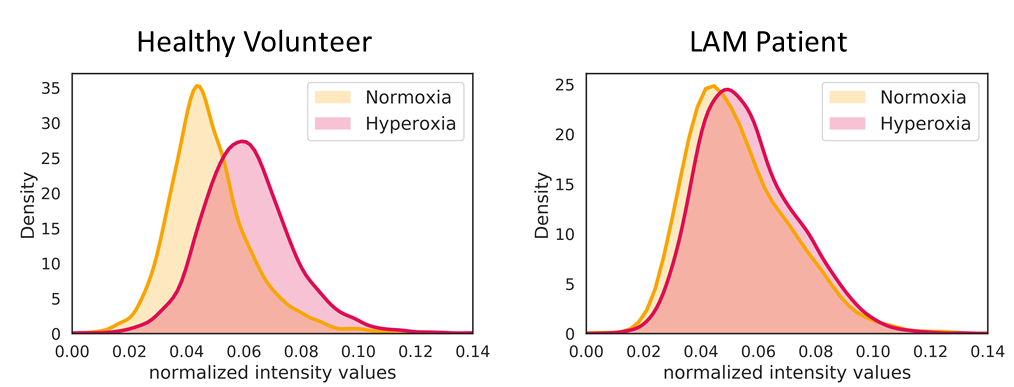
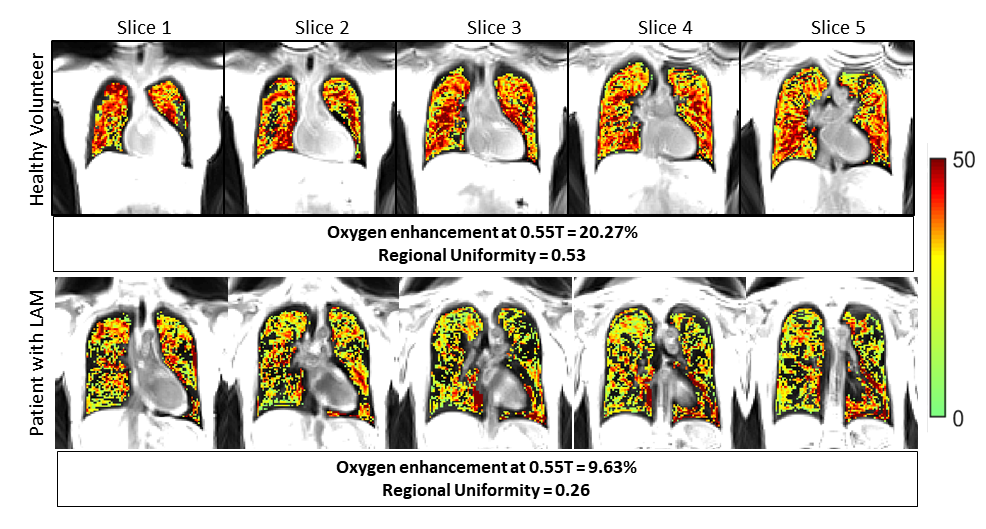
TSE images at 0.55T exhibit superior anatomical details of the lung parenchyma, vessels and cysts in LAM patients (Figure 1) as compared to 1.5T images. These improvements are attributed to improved field homogeneity and reduced susceptibility gradients. Images from 1.5T suffer from distortion such that cyst boundaries cannot be delineated.Signal increase between normoxia and hyperoxia calculated for the 3D UTE acquisitions, was higher at 0.55T compared to 1.5T for healthy volunteers (13.5 ± 7.0% at 0.55T vs 9.1 ± 5.4% at 1.5T) (Figure 2A). Signal intensity increase was lower in patients with LAM (7.3 ± 5.3% at 0.55T ) (Figure 2B). Figure 3 provides the histogram of signal intensities during normoxia and hyperoxia for a single healthy volunteer and patient. Regional distribution maps showed that the signal intensity enhancement caused by oxygen was uniform in healthy volunteers, and regionally varying in patients with LAM (Figure 4). Texture analysis reflected this regional non-uniformity in patients with LAM (GLCM correlation = 0.29 ± 0.14) compared with healthy volunteers (GLCM correlation = 0.43 ± 0.11, p = 0.003) (Figure 2B).
DISCUSSION AND CONCLUSIONS
In this study, we explored oxygen-enhanced functional lung imaging using a high-performance low-field MRI system to overcome the limitations of conventional lung MRI. Lung parenchyma was demonstrated with T2 TSE and T1 3D UTE sequences. The regional oxygen enhancement maps showed impaired ventilation in the patient population with LAM, and quantification of regional heterogeneity demonstrated reduced and non-uniform ventilation compared with healthy subjects. Further work is required to explore the contribution of vasodilation to the signal intensity increase during oxygen inhalation [9]. These results indicate a breadth of opportunities for high-performance low-field MRI in both anatomical and functional lung imaging.Acknowledgements
Funding was provided by the National Heart, Lung, and Blood Institute’s Division of Intramural Research. We would like to acknowledge the assistance of Siemens Healthcare in the modification of the MRI system for operation at 0.55T under an existing cooperative research agreement (CRADA) between NHLBI and Siemens Healthcare.References
1. Puderbach, M., et al. "MR imaging of the chest: a practical approach at 1.5 T." European journal of radiology 64.3 (2007): 345-355.
2. Edelman, Robert R., et al. "Noninvasive assessment of regional ventilation in the human lung using oxygen–enhanced magnetic resonance imaging." Nature medicine 2.11 (1996): 1236.
3. Mirhej, M. E. "Proton spin relaxation by paramagnetic molecular oxygen." Canadian Journal of Chemistry 43.5 (1965): 1130-1138.
4. Dietrich, Olaf, Thomas Gaass, and Maximilian F. Reiser. "T1 relaxation time constants, influence of oxygen, and the oxygen transfer function of the human lung at 1.5 T—A meta-analysis." European journal of radiology 86 (2017): 252-260.Taveira-DaSilva, A.M., W.K. Steagall, and J. Moss, Lymphangioleiomyomatosis. Cancer Control, 2006. 13(4): p. 276-85.
5. Taveira-Dasilva, Angelo M., Wendy K. Steagall, and Joel Moss. "Lymphangioleiomyomatosis." Cancer control 13.4 (2006): 276-285.
6. Qian, Yongxian, and Fernando E. Boada. "Acquisition‐weighted stack of spirals for fast high‐resolution three‐dimensional ultra‐short echo time MR imaging." Magnetic Resonance in Medicine: An Official Journal of the International Society for Magnetic Resonance in Medicine 60.1 (2008): 135-145. 7. Mugler III, John P., et al. "Breath-hold UTE lung imaging using a stack-of-spirals acquisition." Proc Intl Soc Mag Reson Med. 2015.
8. Shamonin, Denis P., et al. "Fast parallel image registration on CPU and GPU for diagnostic classification of Alzheimer's disease." Frontiers in neuroinformatics 7 (2014): 50.
9. Ley, Sebastian, et al. "Impact of oxygen inhalation on the pulmonary circulation: assessment by magnetic resonance (MR)-perfusion and MR-flow measurements." Investigative radiology 42.5 (2007): 283-290.
Figures