0425
Automatic stratification of gliomas into WHO 2016 molecular subtypes using diffusion-weighted imaging and a pre-trained deep neural network1Radiology and Biomedical Imaging, UCSF, San Francisco, CA, United States, 2Bioengineering and Therapeutic Sciences, UCSF, San Francisco, CA, United States, 3Data Science, USF, San Francisco, CA, United States, 4UCSF, Neurological Surgery, CA, United States, 5Graduate Program in Bioengineering, UCSF/UC Berkeley, San Francisco and Berkeley, CA, United States
Synopsis
In this abstract, we use diffusion and anatomical MR imaging together with a pre-trained RGB ImageNet to classify patients into major genetic entities defined by the WHO. We achieved 91% accuracy on our validation set with high per-class accuracy, precision, and recall; and 81% accuracy on a separate test dataset.
Introduction
In 2016 a substantial restructuring of the WHO classification of diffuse gliomas to include molecular markers in addition to histology resulted in 3 main genetic subtypes: 1) glioblastoma, IDH-wildtype (GBM); 2) oligodendroglioma, IDH-mutant, 1p/19q-codeleted (OD); and 3) astrocytoma, IDH-mutant, 1p/19q-intact (AS)1, which account for ~80% of all gliomas2,3. Although most gliomas (~80%) will be resected and their molecular parameters can be evaluated by genetic profiling, a non-invasive characterization of a patient’s genetic subtype can benefit patients where surgery would not otherwise be performed. Prior studies have demonstrated the utility of using anatomical images and convolutional neural networks (CNNs) to distinguish either IDH-mutant from IDH-wildtype tumors, or 1p/19q-codeleted from non-codeleted lesions4,5. The goal of this study was to assess the benefit of: 1) incorporating diffusion-weighted imaging - now a clinical standard; and 2) using RGB-color images from 3 MR image contrasts in order to apply a ResNet-346 network architecture that has been pre-trained on ImageNet7 to initialize the starting weights for our training.Methods
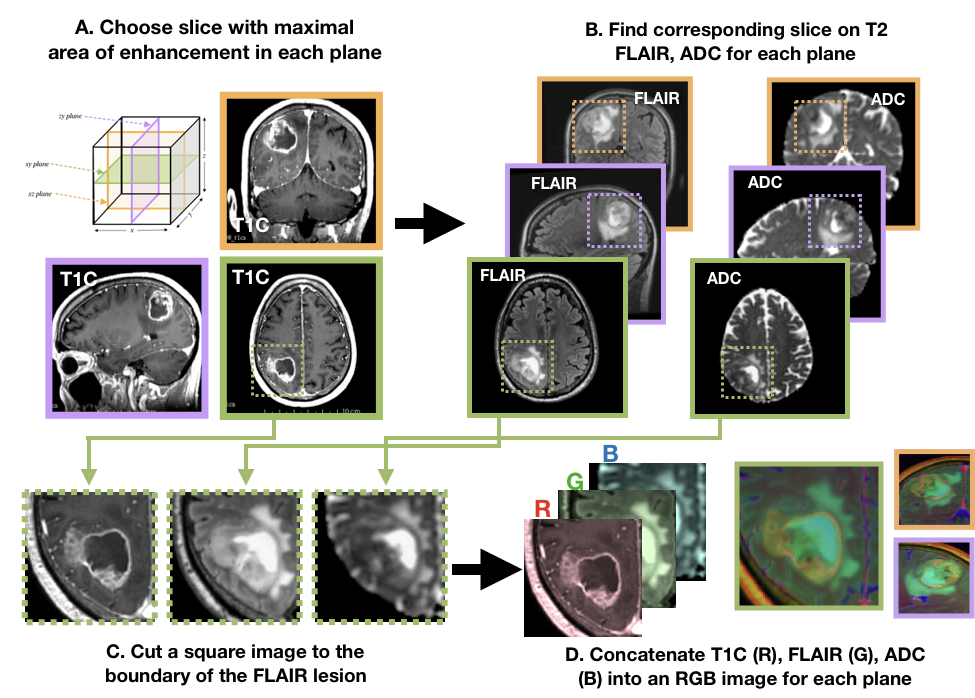
Subjects and Image Acquisition: 208 patients with newly-diagnosed gliomas were scanned on a GE 3T scanner with an 8-channel head coil. T2-weighted FLAIR (T2 FLAIR) and 3D T1-weighted IR-SPGR imaging before (T1) and after (T1C) the injection of a gadolinium-based contrast agent were acquired. Diffusion-tensor images (DTI) were obtained in the axial plane with either 6 directions and 4 excitations or ≥24 directions and 1 excitation [TR/TE = 1000/108 ms, voxel size = 1.7 × 1.7 × 3 mm, b=1000 or 2000 s/mm] and apparent diffusion coefficient (ADC) maps were generated using FMRIB’s Diffusion Toolkit as previously described8.Immunohistochemistry: IDH1R132H mutations along with ATRX alterations were assessed by immunohistochemistry using previously described methods9,10. Clinical FISH assays were used to determine 1p19q codeletion status11. If a tumor was IDH-mutant and ATRX-altered, 1p19q-codeletion status was not assessed due to nearly mutually exclusive distributions. Image processing: Figure 1 details the image processing pipeline. Z-score normalization per-image was performed within a brainmask. Contrast enhancing lesions (CELs) and nonenhancing lesions (NELs) were manually segmented. Slices of interest for each plane were selected by the maximum area of the CEL or NEL. A square box padding the bounds of the NEL was used to extract a patch from the T1C, T2 FLAIR, and ADC images. These patches from each MR modality were concatenated to generate an RGB-color image for the coronal, sagittal and axial planes for each patient. Training and testing: Patients were stratified by molecular subtype: 84 IDH-wildtype GBM, 53 1p/19q-codeleted OD, and 74 IDH-mutant AS. Patients were randomly split into 143 training [56/36/51 GBM/OD/AS], 36 validation [15/9/12 GBM/OD/AS], and 32 testing [13/8/11 GB/OD/AS] datasets.Model and computational framework: A ResNet-34 pre-trained with ImageNet was used to initialize the weights (Figure 2)6. Data was augmented using cropping, rotating, and flipping both horizontally and vertically. Cosine differential learning rates (LR) and cross-entropy loss functions were used during training. Softmax classification of each of three directions were averaged per patient and the maximum value was used as a final prediction. All model building, training, and testing were implemented using PyTorch 1.0.0 on a Tesla V100-PCIE-32GB GPU (Nvidia).Results and Discussion
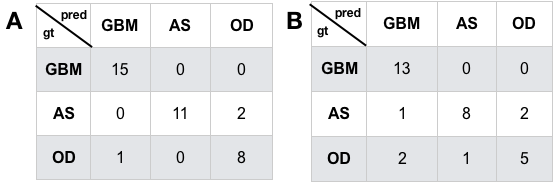
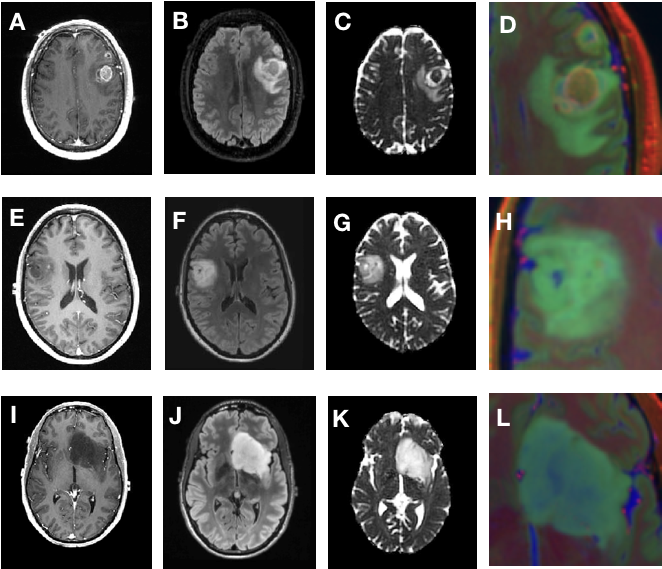
Figure 3 depicts the confusion matrices for the predictions of the validations (A) and test (B) datasets. We achieved a 91% prediction accuracy on our validation set with per-class precision (P) and recall (R) of 0.94 (P) and 1.0 (R) for GBM, 1.0 (P) and 0.85 (R) for IDH-mutant AS, and 0.8 (P) and 0.89 (R) for 1p19q-codeleted OD. When applied to the withheld test dataset, we achieved 81% accuracy, with per-class precision and recall were 0.812 (P) and 1.0 (R) for GBM, 0.89 (P) and 0.73 (R) for IDH-mutant AS, and 0.72 (P) and 0.63 (R) for OD. Figure 4 shows the imaging characteristics of the one OD patient that was incorrectly classified as a GBM and 2 AS patients that were mistakenly classified as OD. The misclassified OD patient had a necrotic core with contrast enhancement, hallmark features of a classic GBM. Figure 5 depicts representative images from each subgroup that was correctly classified with high probabilities, with each subgroup having a unique dominant color channel.Conclusion
This study demonstrates a new framework for incorporating a pretrained-network strategy along with diffusion-weighted imaging into the prediction of the genetic subtype for patients with glioma. The relatively high prediction accuracy for all of the classes holds promise for the incorporation of pre-trained CNNs into clinical workflow by serving as a “second reader”. This method is currently being validated on larger external datasets and can easily be extended to other disease classification problems where multiple image contrasts are acquired.Acknowledgements
No acknowledgement found.References
1. Louis, D. N. et al. The 2016 World Health Organization Classification of Tumors of the Central Nervous System: a summary. Acta Neuropathol. 131, 803–820 (2016).
2. Ostrom, Q. T. et al. CBTRUS Statistical Report: Primary Brain and Other Central Nervous System Tumors Diagnosed in the United States in 2009-2013. Neuro Oncol. 18, v1–v75 (2016).
3. Parsons, D. W. et al. An integrated genomic analysis of human glioblastoma multiforme. Science 321, 1807–1812 (2008).
4. Chang, P. et al. Deep-Learning Convolutional Neural Networks Accurately Classify Genetic Mutations in Gliomas. AJNR Am J Neuroradiol 39, 1201–1207 (2018).
5. Chang, K. et al. Residual Convolutional Neural Network for the Determination of IDH Status in Low- and High-Grade Gliomas from MR Imaging. Clin. Cancer Res. 24, 1073–1081 (2018).
6. He, K., Zhang, X., Ren, S. & Sun, J. Deep residual learning for image recognition. in Proceedings of 2016 IEEE Conference on Computer Vision and Pattern Recognition (CVPR) 770–778 (IEEE, 2016). doi:10.1109/CVPR.2016.90
7. Deng, J. et al. ImageNet: A large-scale hierarchical image database. in 2009 IEEE Conference on Computer Vision and Pattern Recognition 248–255 (IEEE, 2009). doi:10.1109/CVPR.2009.5206848
8. Duarte-Carvajalino, J. M., Sapiro, G., Harel, N. & Lenglet, C. A Framework for Linear and Non-Linear Registration of Diffusion-Weighted MRIs Using Angular Interpolation. Front. Neurosci. 7, 41 (2013).
9. Jalbert, L. E. et al. Metabolic profiling of IDH mutation and malignant progression in infiltrating glioma. Sci. Rep. 7, 44792 (2017).
10. Heaphy, C. M. et al. Altered telomeres in tumors with ATRX and DAXX mutations. Science 333, 425 (2011).
11. Pekmezci, M. et al. Adult infiltrating gliomas with WHO 2016 integrated diagnosis: additional prognostic roles of ATRX and TERT. Acta Neuropathol. 133, 1001–1016 (2017).
Figures