0420
A radiomic signature for predicting recurrence of FLAIR abnormality in glioblastomas using multi-modal MRI1Symbiosis Center for Medical Image Analysis, Symbiosis International University, Pune, India, 2Department of Radiology, Fortis Hospital, Gurgaon, India, 3Department of Radiology, National Institute of Mental Health and Neurosciences, Bangalore, India, 4Radiation Oncology and Neurosurgery, Fortis Hospital, Gurgaon, India
Synopsis
Standard post-operative radiation therapy in glioblastoma delivers radiation uniformly across the hyper-intense areas from pre-operative FLAIR images and does not account for the regions where the infiltration might relapse. This work creates a non-invasive prognostic signature of the extent of recurrent hyper-intense FLAIR using radiomics features extracted from multi-modal MRI. Results demonstrate that the area of recurrence can be accurately predicted earlier with some radiomic features as beacon of recurrence than others when tested temporally across multiple time-points.
Introduction
Glioblastomas are the most aggressive brain tumors and carry poor prognosis with only 10-15 months of median survival1. Recurrence of glioblastomas is universal, and current standard of care includes surgical resection that is planned using enhancement and necrotic core visualized on T1- post contrast MRI, followed by radiation therapy and adjuvant chemotherapy. The radiation planning utilizes the hyper-intense signal from T2-FLAIR MRI and is delivered uniformly without accounting for the regions where the infiltration might relapse2,3,4. To this end, non-invasive early prediction and delineation of recurrent hyper-intense FLAIR can aid in targeted therapy which may potentially delay the relapse. In this work, we use an array of textural and intensity features from multi-modal MRI to predict the extent of hyper-intense FLAIR at recurrence, thus creating a prognostic signature that may further support personalized treatment planning and efficacy. In addition, we also demonstrate temporal textural alterations that occur prior to recurrence and illustrate early radiomic biomarkers which may aid in predicting probable regions of relapse before it is visible on FLAIR images.Methods
Our dataset consisted of 88 longitudinal MRIs from 15 patients with tumor progression and recurrence. All these patients were operated and histology confirmed as glioblastoma IDH wild-type in 14 and IDH mutant in one patient. These patients were treated with conformal radiotherapy with concurrent temozolomide. The recurrence was confirmed by high rCBV values on serial study done every three months and validated by re-surgery and histopathology in 12/15 patients. Image acquisition was performed on Philips Ingenia 3T scanner with a 15-channel head coil with: (1) 3D FLAIR images: TR/TE=4700/290ms, flip angle=90°, slice thickness=1mm, and time of inversion=1650ms (2) 3D T1 contrast enhanced (T1ce) with TR/TE=700/25ms, slice thickness=1mm, and flip angle=90° (3) T2-Weighted images: TR/TE=3700/100ms, flip angle=90°, slice thickness=5mm (4)DCE perfusion imaging: T1-fast field echo (T1-FFE) sequence with TR/TE=4.45/2.01ms; FA=10 degree; slice thickness=6 mm; FOV=240 × 240 mm2; matrix size=128x128. To predict the recurrence, imaging performed at an average time-point of 7±2.57 months prior to recurrence (pre-recurrence) was used. All the images were pre-processed (skull stripping, tissue segmentation and intensity normalization) followed by intra-subject affine registration between the modalities and timepoints. Semi-automated segmentation of the tumoral regions on post-recurrence scans was employed to delineate the enhancing, non-enhancing and T2-FLAIR hyper-intensities (vasogenic edema + infiltration). The FLAIR hyperintense mask was mapped back to the earlier (7±2.57 months) pre-recurrence time-point and was considered as a prospective growth region while the unaffected WM matter on the same pre-recurrence scan was considered as normative tissue. Patch-wise (3*3*3 mm) radiomics based feature extraction was performed using PyRadiomics 2.2.0 library5 and included intensity, statistical, GLCM, GLDM, GLRLM and GLSZM features. These were computed on the pre-recurrence scan and trained and cross-validated on 9 subjects (202,665 patches) using a random forest classifier and tested on remaining 6 subjects to predict prospective FLAIR hyper-intensity. A probabilistic heatmap was constructed from all the patch scores and the areas of predicted FLAIR abnormalities were visualized. Furthermore, the most discriminative radiomic features were extracted (top 10) from the classifier to investigate the temporal alterations over multiple timepoints by mapping back the recurrence mask and computing radiomic features from all the earlier time-points. The average time (days) of deviation from normal (compared to earlier time-point) was computed for each of the top 10 features.Results
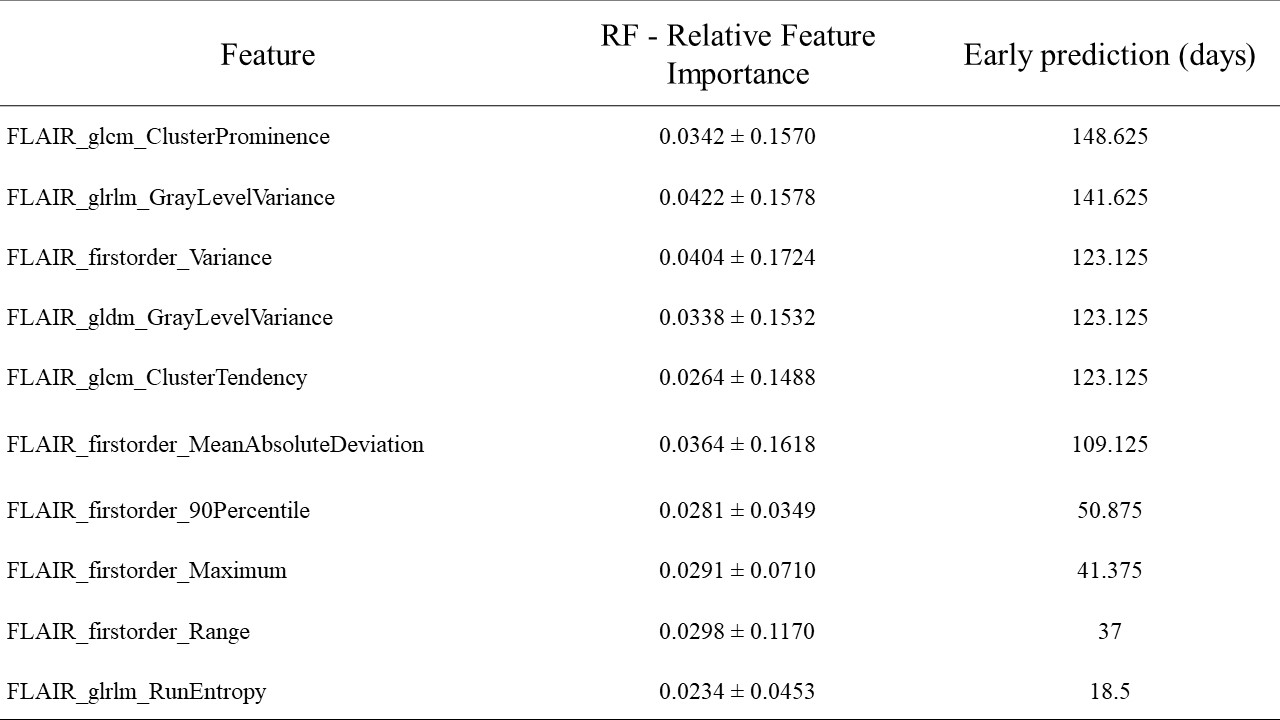
Figure 1 demonstrates the probabilistic signatures of recurrence for the test subjects. The CV accuracy was 78% (sensitivity/specificity = 0.783/0.785) while the test accuracy was 77% (sensitivity/specificity =0.681/0.860). The thresholded map in Figure 2 demonstrates the areas with highest chance of recurrence. For the temporal analysis, figure 3 displays the top 10 features and how early they deviated from the normative trajectory for percentage of subjects (x-axis). Table 1 illustrates the average number of days, before recurrence that the feature value deviated from normal for the top 10 features. It can be observed that GLCM cluster prominence (~148 days) and GLRLM grey level variance (141 days) were the beacon markers of recurrence. Figure 4 shows a temporal trajectory of 3 (of the top 10) features (GLRLM grey level variance, GLCM cluster prominence, Firstorder MeanAbsoluteDeviation) over all the acquired timepoints for three test subjects.Discussion
Results demonstrate that radiomic features are an important signature for prediction of GBM recurrence prior to its visibility on FLAIR images. Our patch based classifier could illustrate the areas of probable recurrence of FLAIR hyperintensities with highest probabilities around the enhancing area of recurrence suggestive of possible future infiltration (Figure 2). Finally, for the top predictive features the temporal change was evident as these feature values separated from normative curve earlier than the recurrence was visually interpreted on the MRI. Some textures such as GLCM cluster prominence demonstrated early alteration consistently across all the subjects implicating that it can serve as a beacon marker from which later timeline of relapse can possibly be inferred. Overall, our work is an important first step in creating non-invasive markers of GBM recurrence that may support therapeutic interventions in future prospective studies.Acknowledgements
No acknowledgement found.References
1. Rulseh AM, Keller J, Klener J, et al. Long-term survival of patients suffering from glioblastoma multiforme treated with tumor-treating fields. World J SurgOncol. (2012); 10:220. Published 2012 Oct 24. doi:10.1186/1477-7819-10-220.
2. Heesters M., et al., “Brain tumor delineation based on CT and MR imaging. Implications for radiotherapy treatment planning,” Strahlenther. Onkol. 169(12), 729–733 (1993).
3. Akbari H., et al., “Imaging surrogates of infiltration obtained via multiparametric imaging pattern analysis predict subsequent location of recurrence of glioblastoma,” Neurosurgery 78(4), 572–580(2016)https://doi.org/10.1227/NEU.00000000000012024.
4. Konukoglu E., et al., “Extrapolating glioma invasion margin in brain magnetic resonance images: suggesting new irradiation margins,” Med. Image Anal. 14(2), 111–125 (2010) https://doi.org/10.1016/j.media.2009.11.0055.
5. Joost J.M. van Griethuysen et al, “Computational Radiomics System to Decode the Radiographic Phenotype”.
Figures
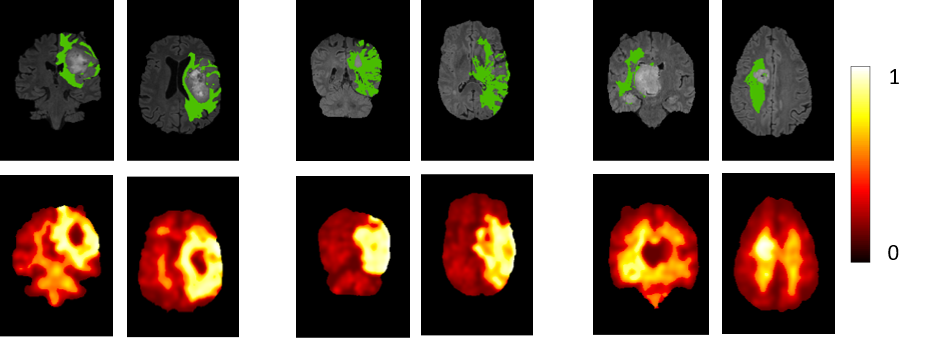
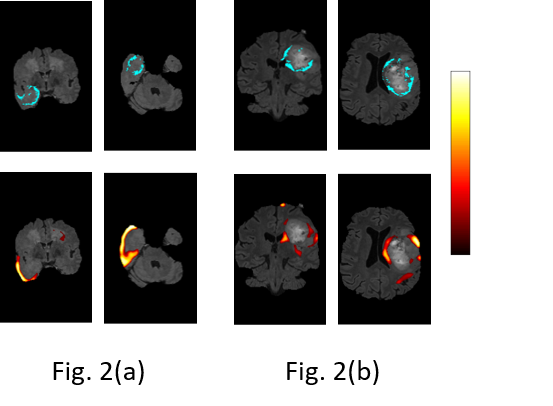
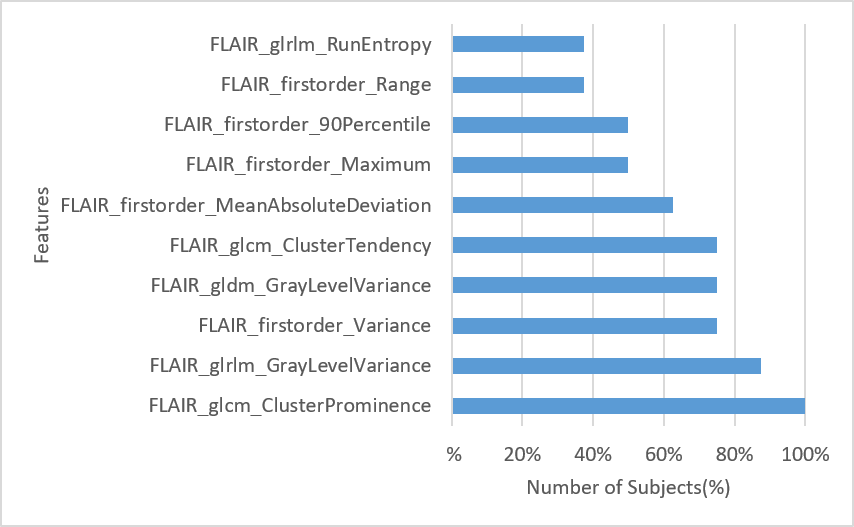
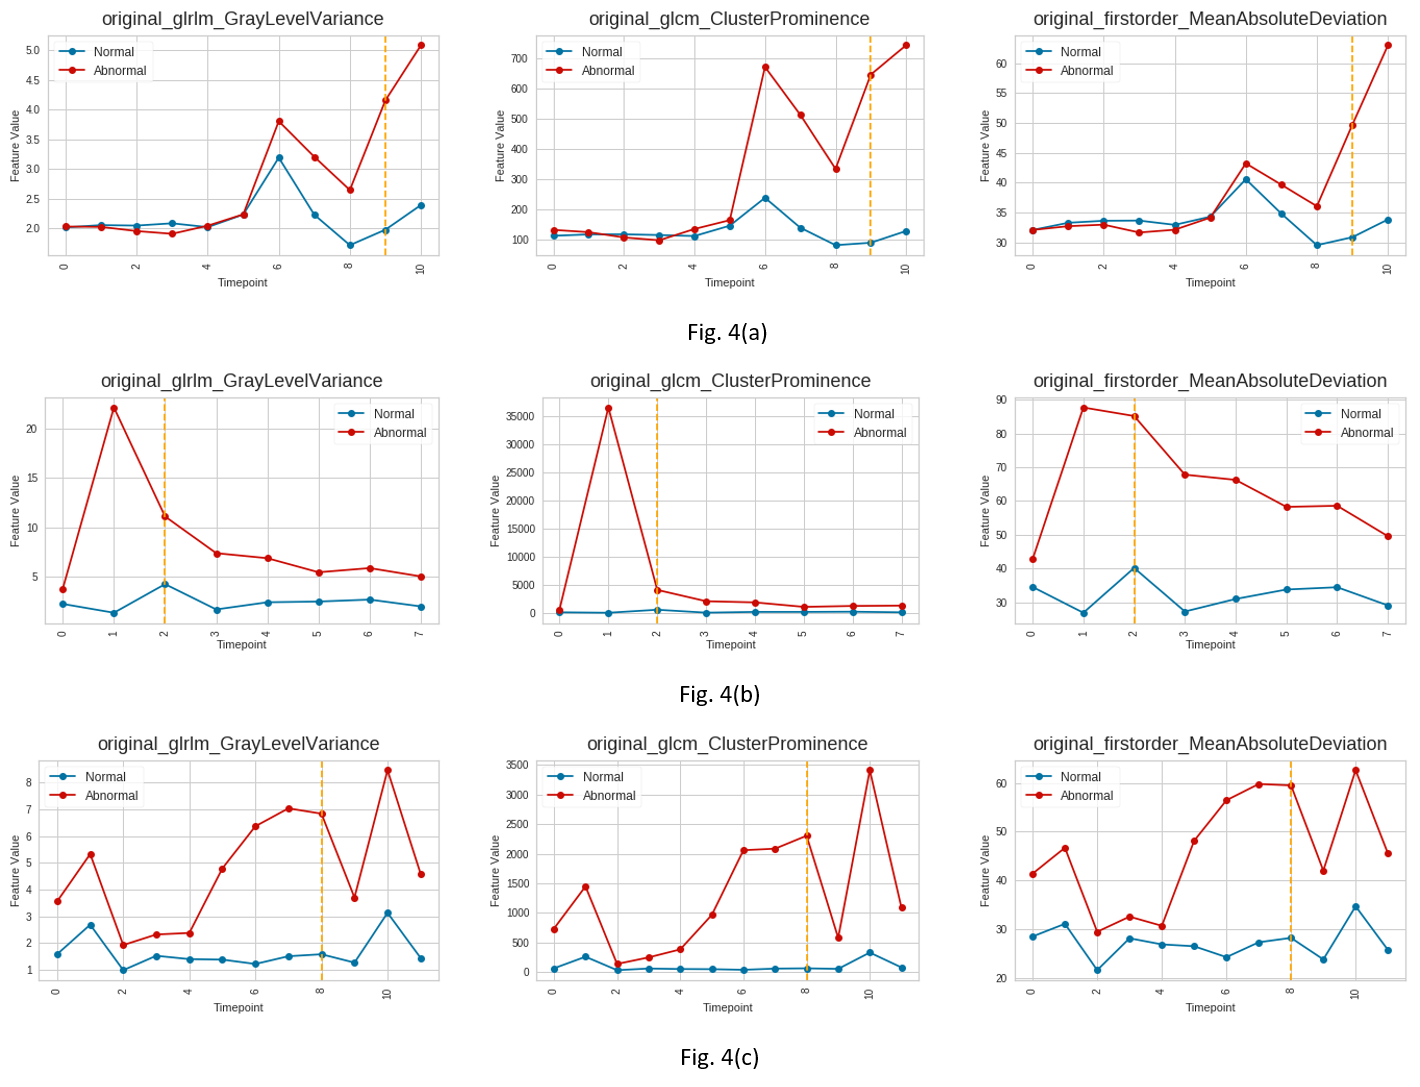
Figure 4: shows the temporal changes in the following top-ranked features: Glrlm-GraylevelVariance (left), Glcm-ClusterProminance(center), Firstorder-MeanAbsoluteDevation(right). Figure 4 (a,b,c) indicate different subjects with varying number of timepoints. In every plot, horizontal axis indicates the timepoint of scanning whereas radiomics feature values are indicated by the vertical axis. The dashed yellow line marks the timepoint of visible recurrence/growth.