0417
Information-based assessment of the radiomic-histomic relationship in brain cancer patients1Biophysics, Medical College of Wisconsin, Wauwatosa, WI, United States, 2Radiology, Medical College of Wisconsin, Wauwatosa, WI, United States, 3Biomedical Engineering, Medical College of Wisconsin, Wauwatosa, WI, United States, 4Neurology, Medical College of Wisconsin, Wauwatosa, WI, United States, 5Pathology, Medical College of Wisconsin, Wauwatosa, WI, United States, 6Biostatistics, Medical College of Wisconsin, Wauwatosa, WI, United States
Synopsis
This study sought to provide a biological basis of radiomics-based analyses by assessing the relationship between MR features and analogous histomic features of the underlying tissue using coregistered histology samples taken at autopsy from brain cancer patients. Several radiomic features demonstrated substantial mutual information with their histomic analogs, with first order features showing the strongest associations. These histomic-preserving features were shown to be stable across potential confounds such as differences in scanner vender and acquisition field strength. These findings suggest that MR radiomic features reflect information about the texture of the underlying tissue.
Introduction
MR-derived radiomic features have demonstrated substantial predictive utility in modeling different prognostic factors of glioblastomas and other brain cancers [1–4]. However, the biological relationship underpinning these predictive models has been largely unstudied, with the generalizability of these models also called into question [5–7]. An essential step towards advancing this technique are addressing these concerns, but studies attempting to tie radiomic features to biological information have thus far been limited to biopsy cores, which are not able to provide information outside of the MR-defined tumor boundary [8,9]. This study used autopsy tissue samples coregistered to the MRI to address the biological underpinnings of radiomic features across a variety of tissue types found in brain cancer. Here, we examine the localized relationship between MR-derived radiomic features and histology-derived “histomic” features in terms of mutual information. Furthermore, we assessed the influence of several confounding factors such as MR scanner vendor and field strength on the radiomic-histomic (RH) relationship to address concerns regarding generalizability.Methods
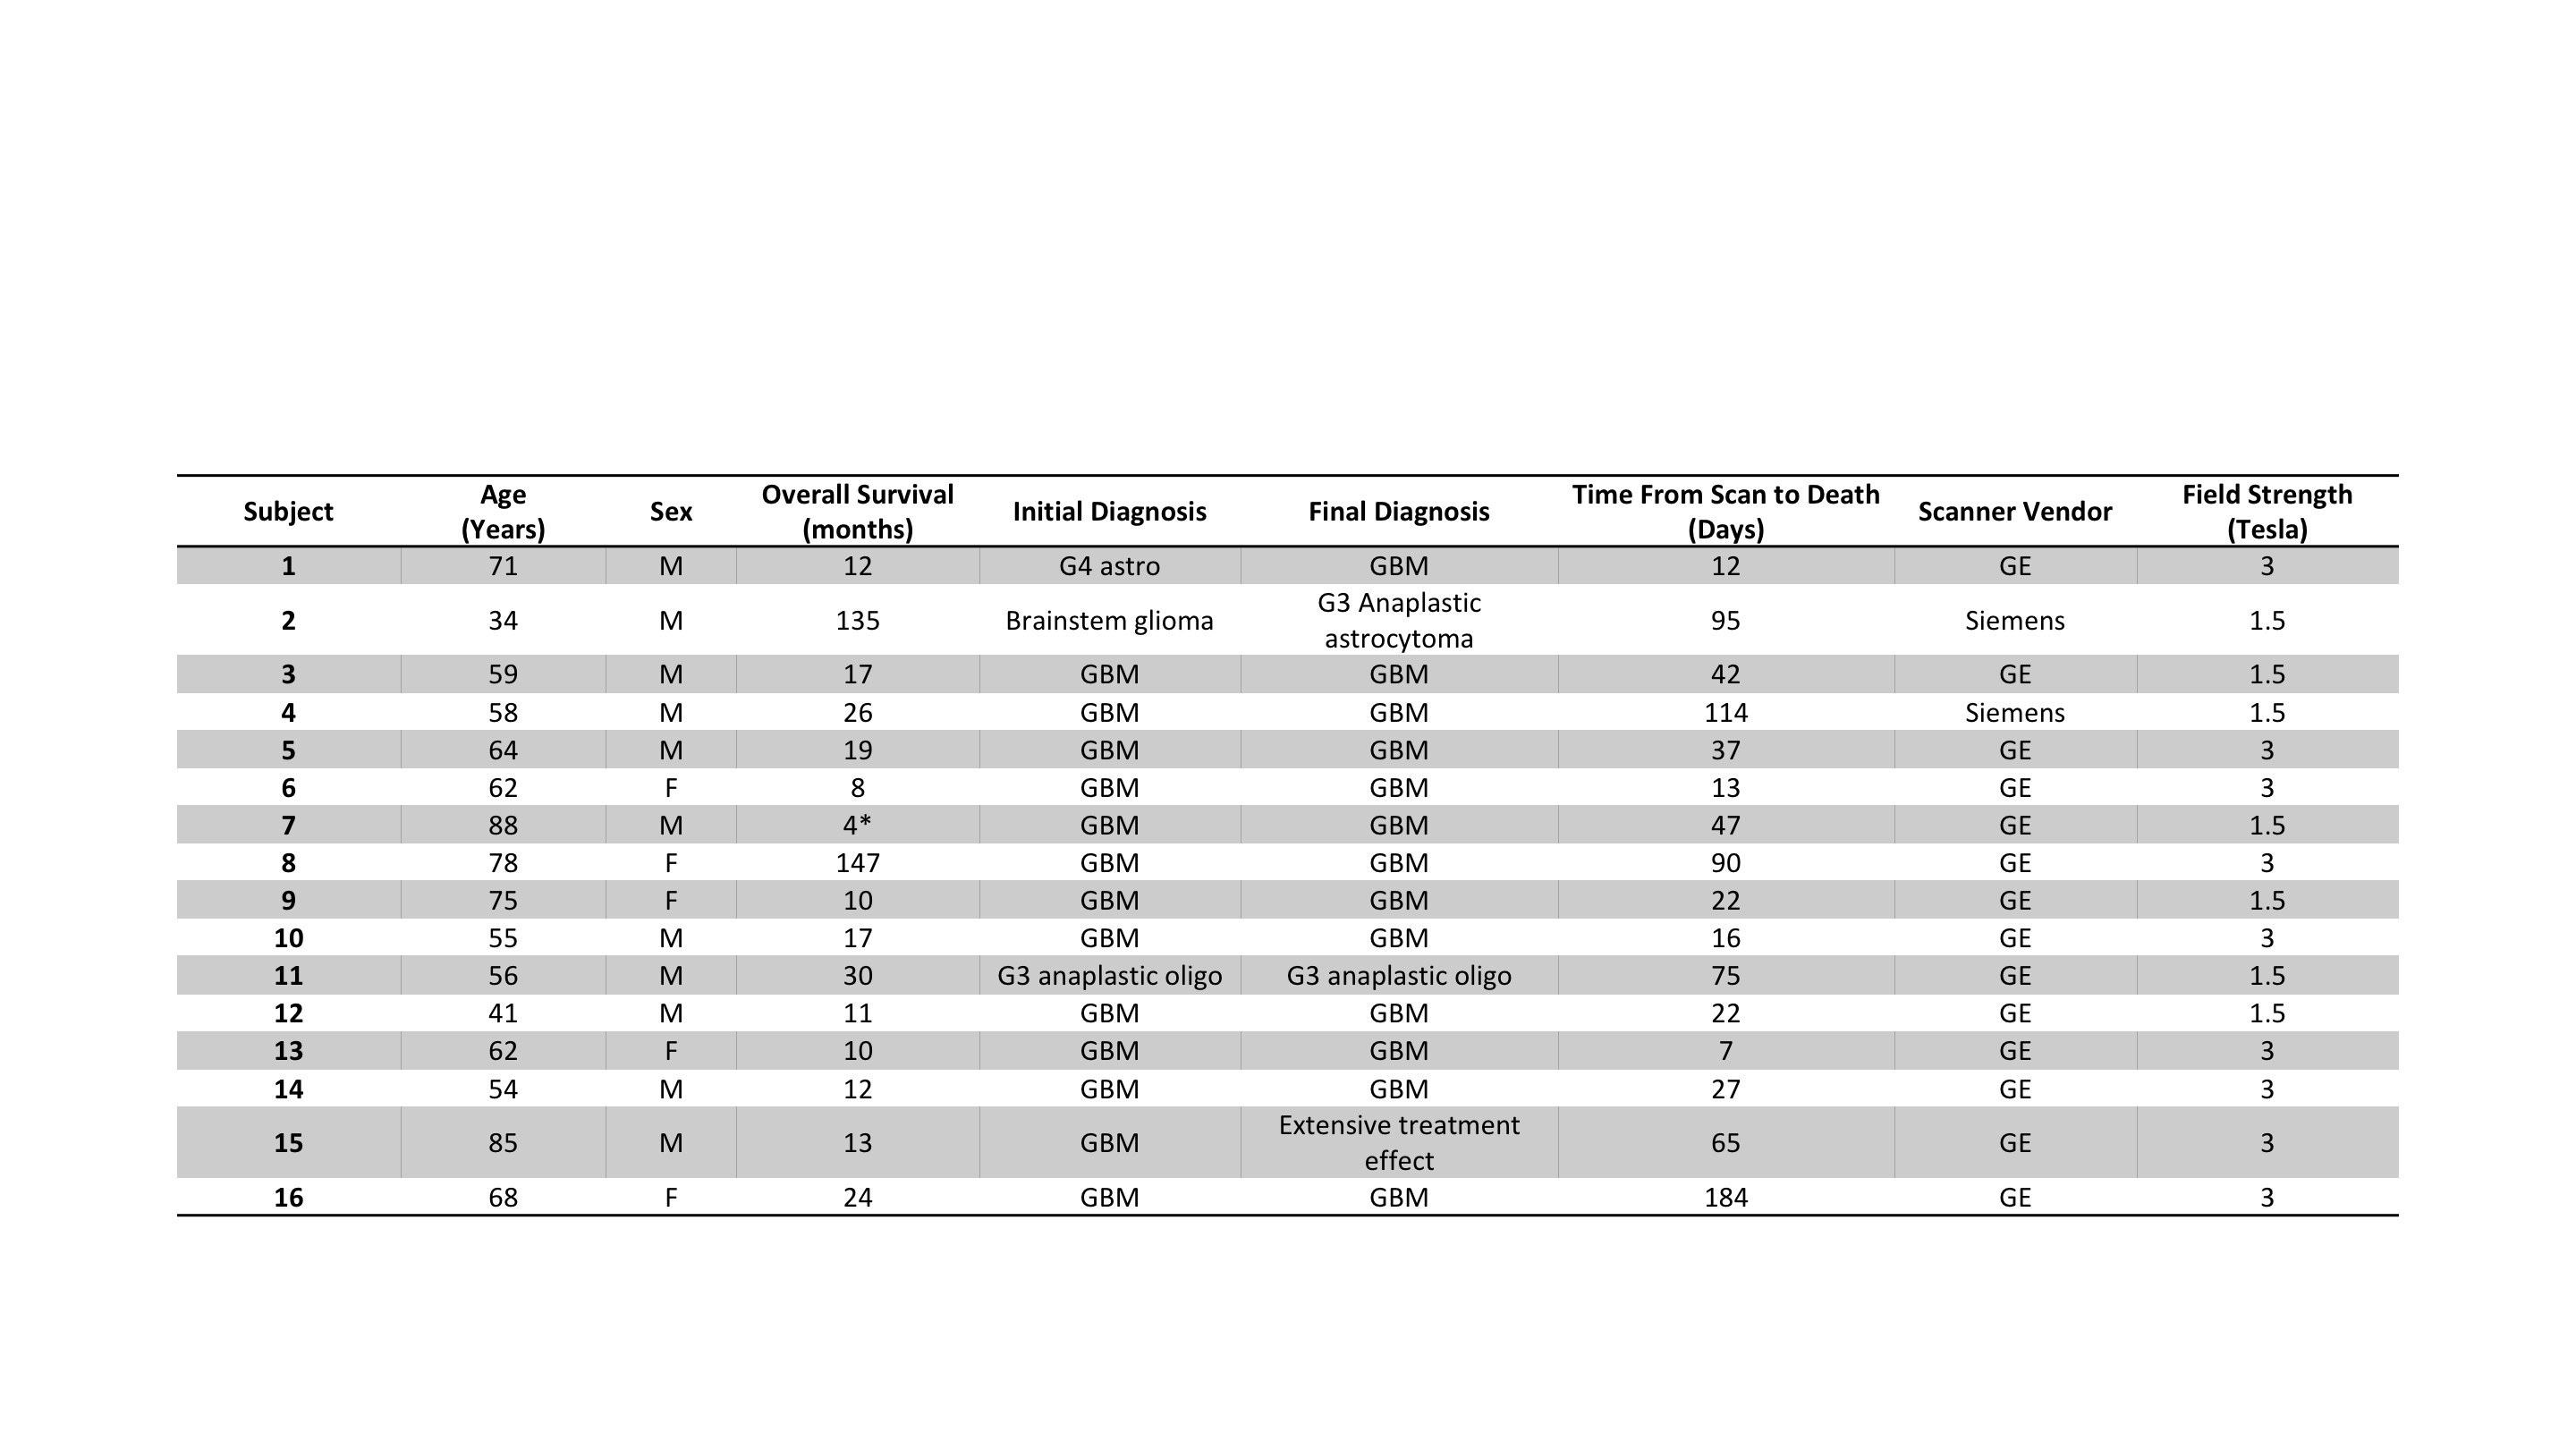
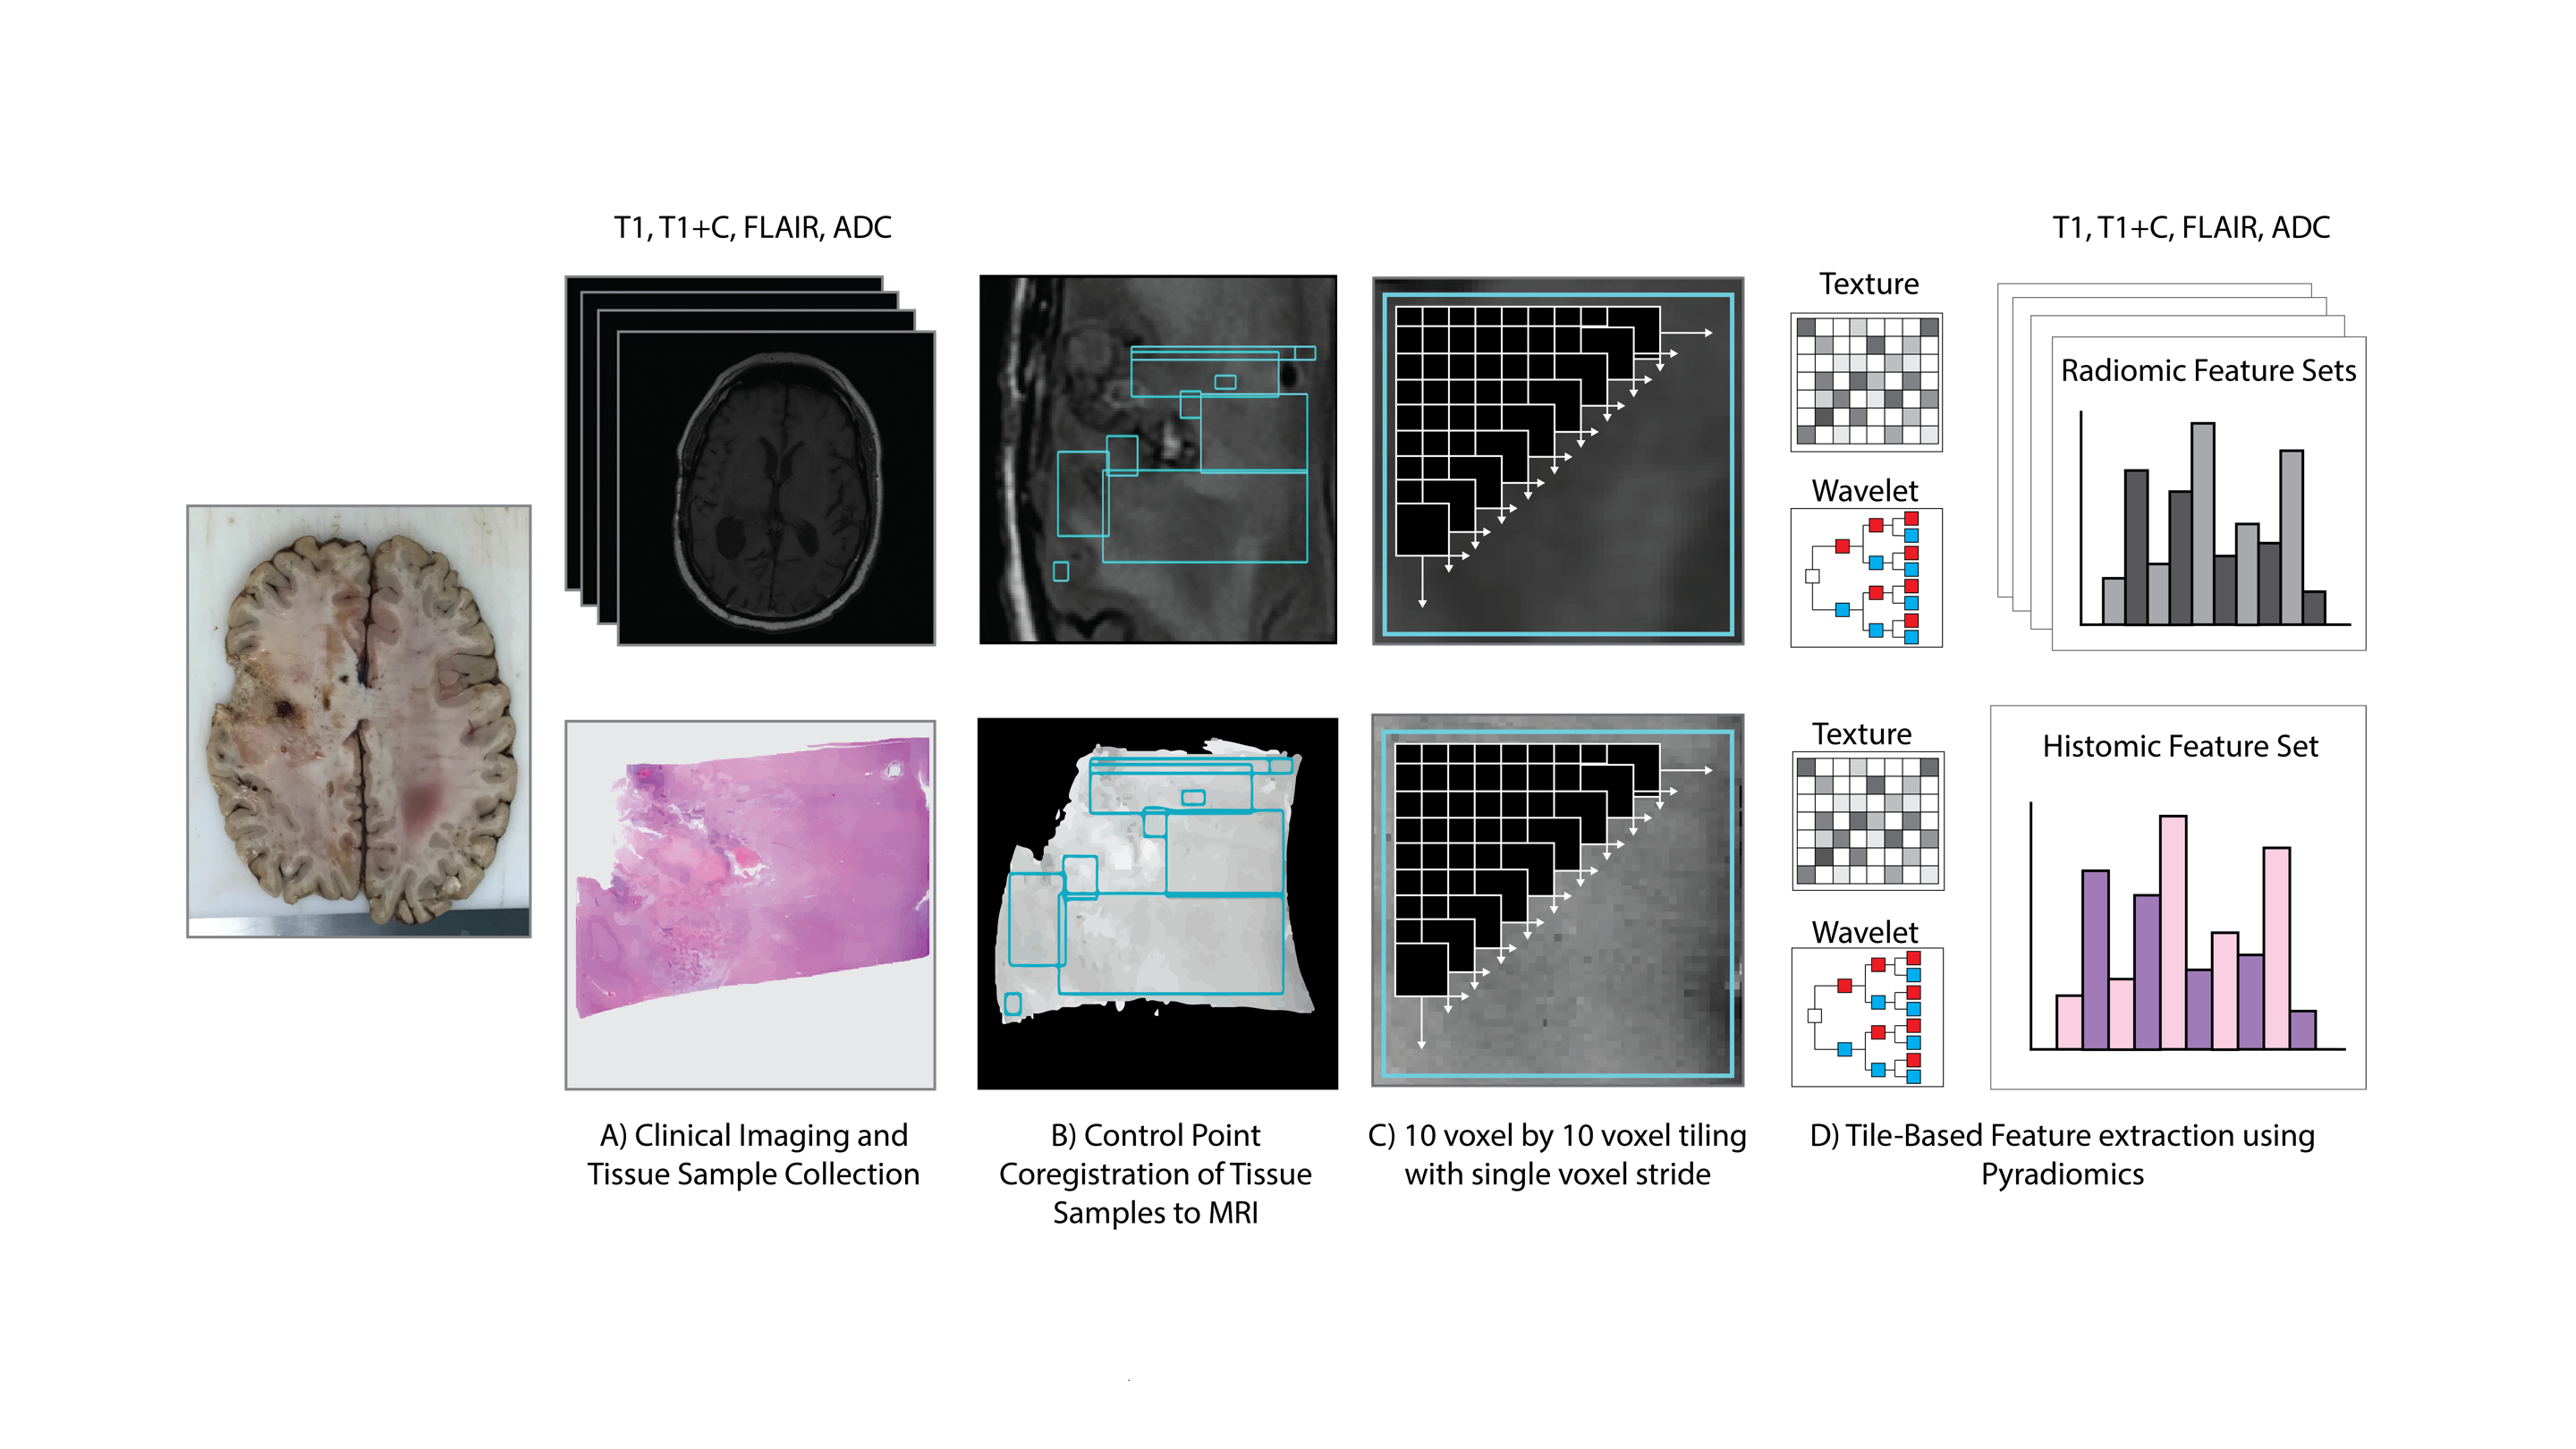
Sixteen patients with a pathologically confirmed brain cancer were enrolled in this study (Figure 1). A diagrammatic representation of the data collection process is provided in Figure 2. Forty-five tissue samples were collected at autopsy, and clinical imaging was collected from the last session prior to death (including a T1-weighted image (T1), T1 with injection of gadolinium contrast agent (T1+C), a T2-weighted fluid attenuated inversion recovery image (FLAIR), and an apparent diffusion coefficient image (ADC) calculated from diffusion weighted imaging). Samples were acquired using 3-D printed slicing jigs based on the clinical imaging in order to slice the brain in line with the slices of the MRI. Following hematoxylin and eosin (HE) tissue staining, full slides from the samples were then digitized at 10X magnification using a sliding stage microscope. In-house custom software was used to coregister the histology to the MRI. Manually defined control points were used to direct a nonlinear transformation of the histology slide to the FLAIR image. Regions of interest (ROIs) were then defined based on quality assessment for both the MRI and the histology across each slide, with tile masks generated across the ROIs using a 10 voxel by 10 voxel frame with single voxel stride. Radiomic features were calculated across each tile mask for the T1, T1+C, FLAIR, and ADC image using Pyradiomics v2.1.0. Features were extracted on each normalized image, as well as the eight images generated from a 3-D wavelet decomposition (3DWD) of each image. Extracted features included first order (FO) features, gray-level co-occurrence matrix (GLCM), gray-level dependence matrix (GLDM) features, gray-level run level matrix (GLRLM) features, gray-level size zone matrix (GLSZM) features, and neighboring gray tone dependence matrix (NGTDM) features. These same features were then calculated across each tile on the grayscale histology image, resulting in 837 radiomic features for each of the four MRI and 837 histomic features for the histology.Results
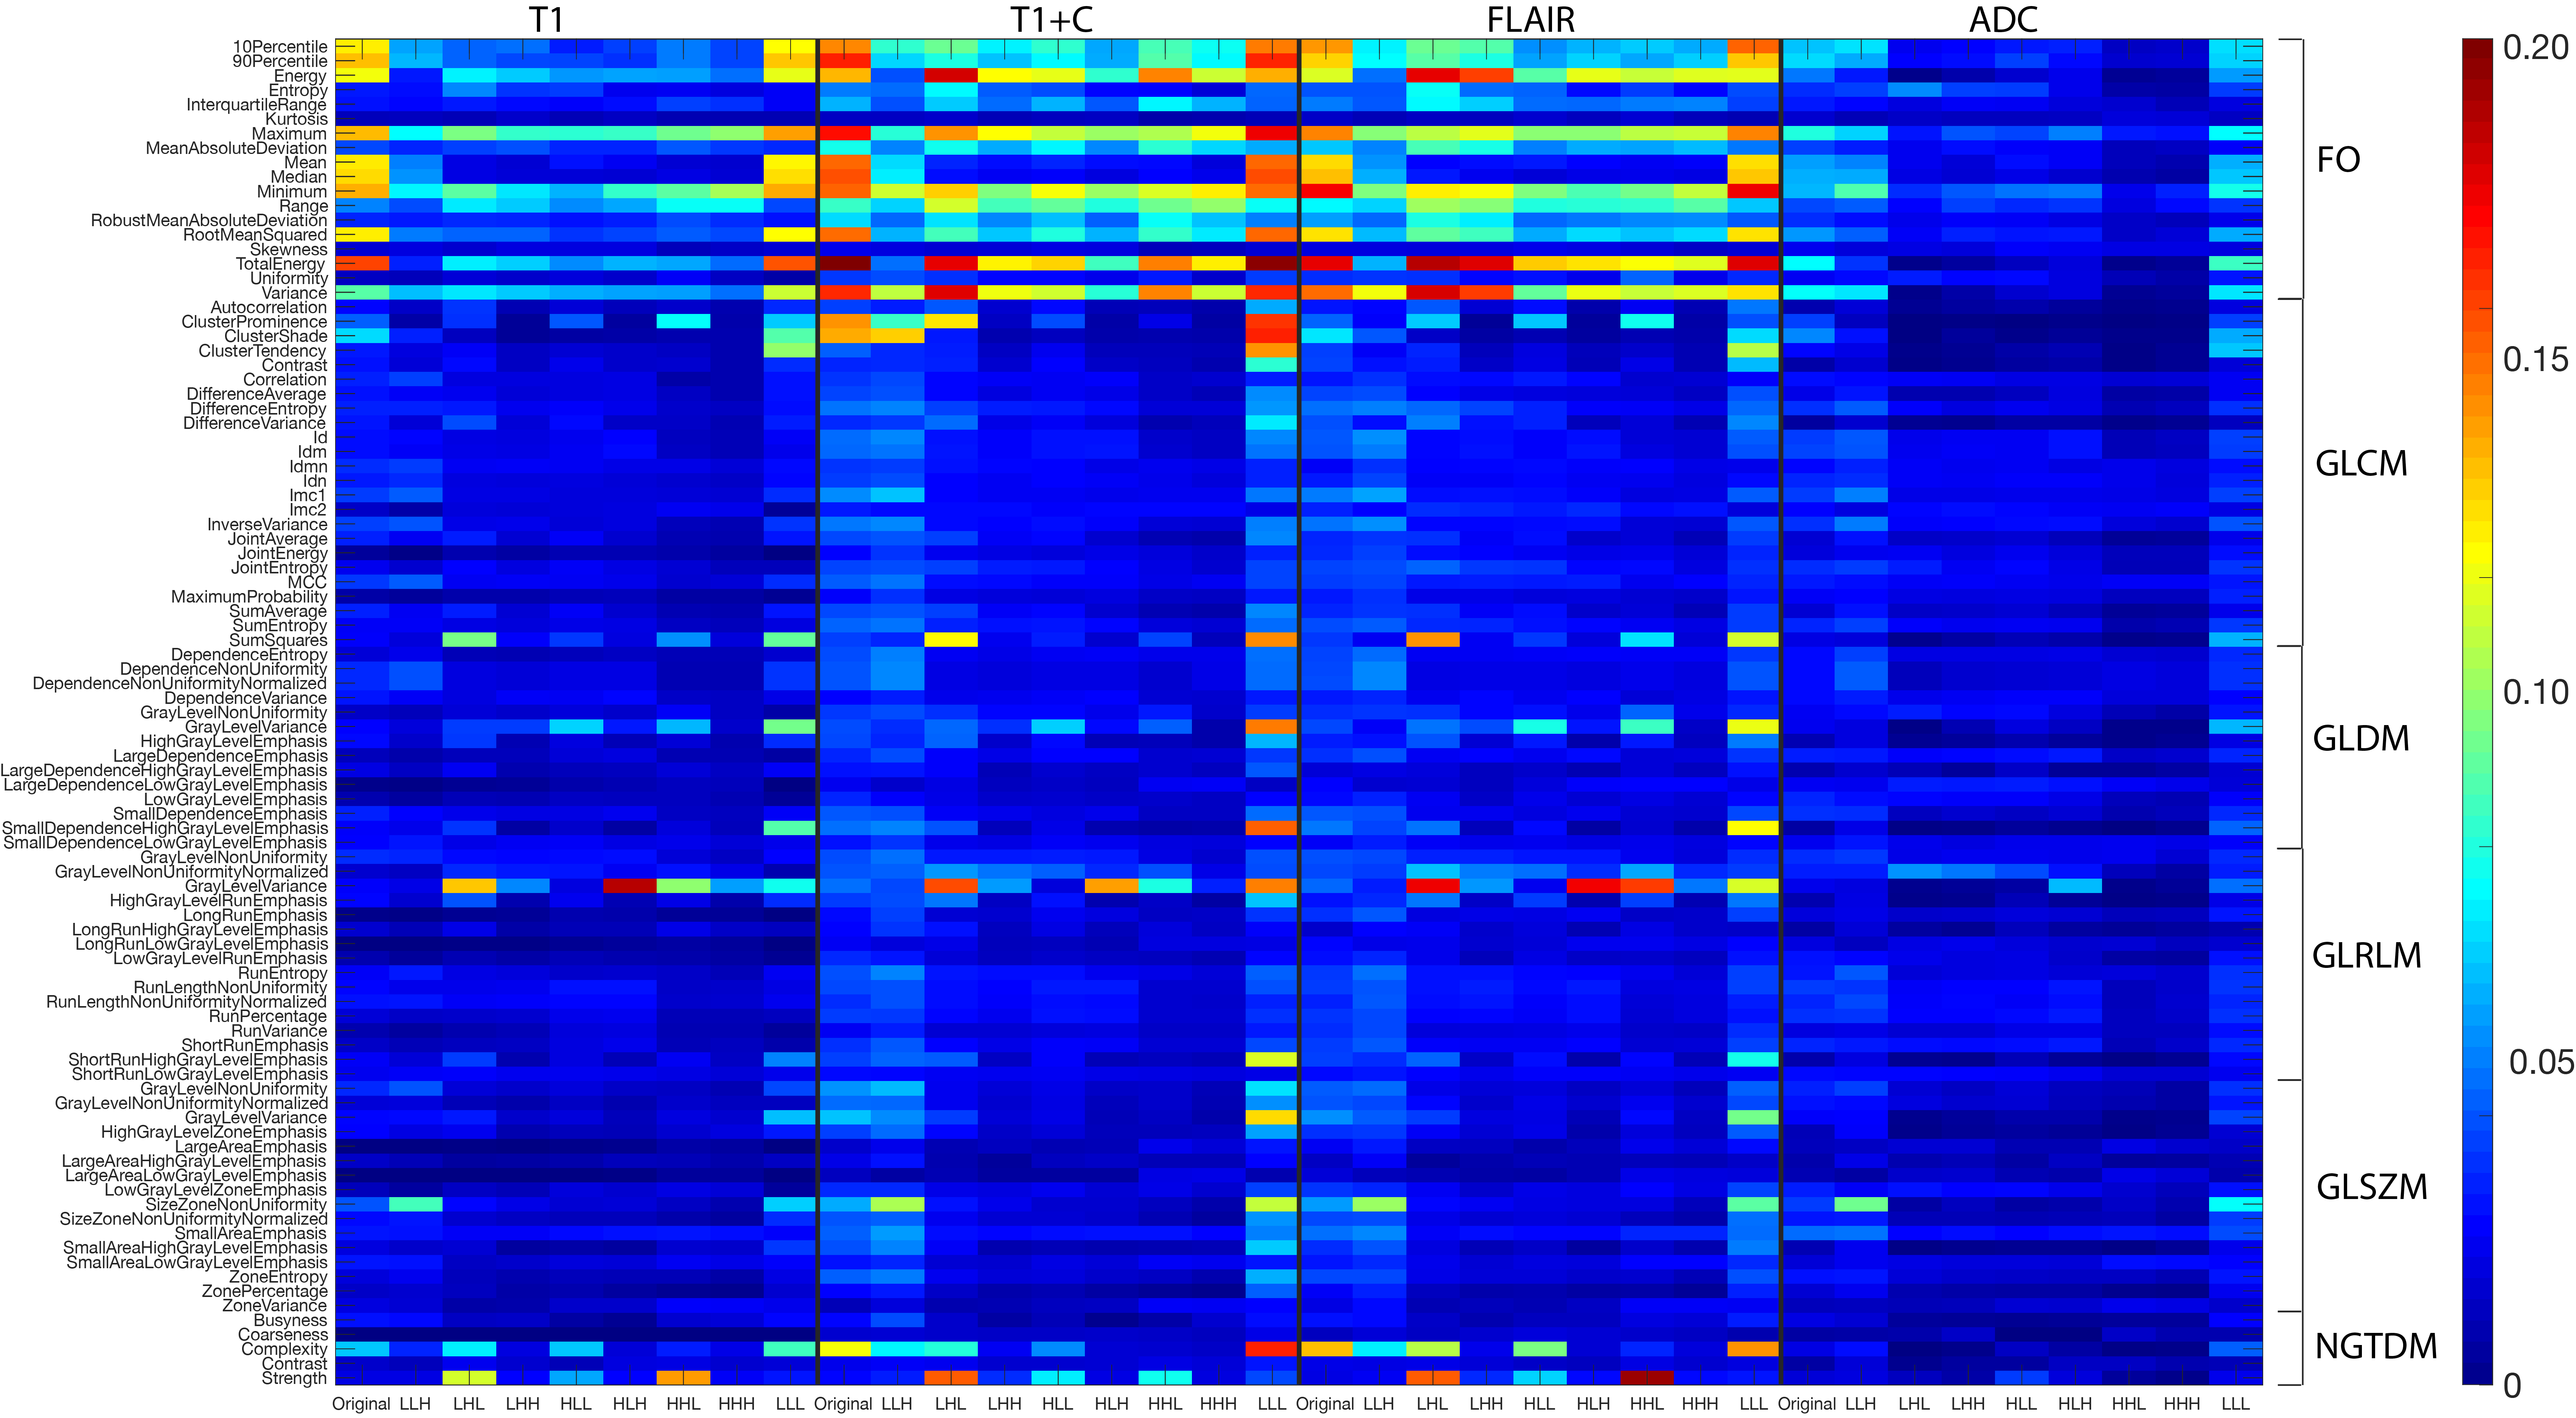
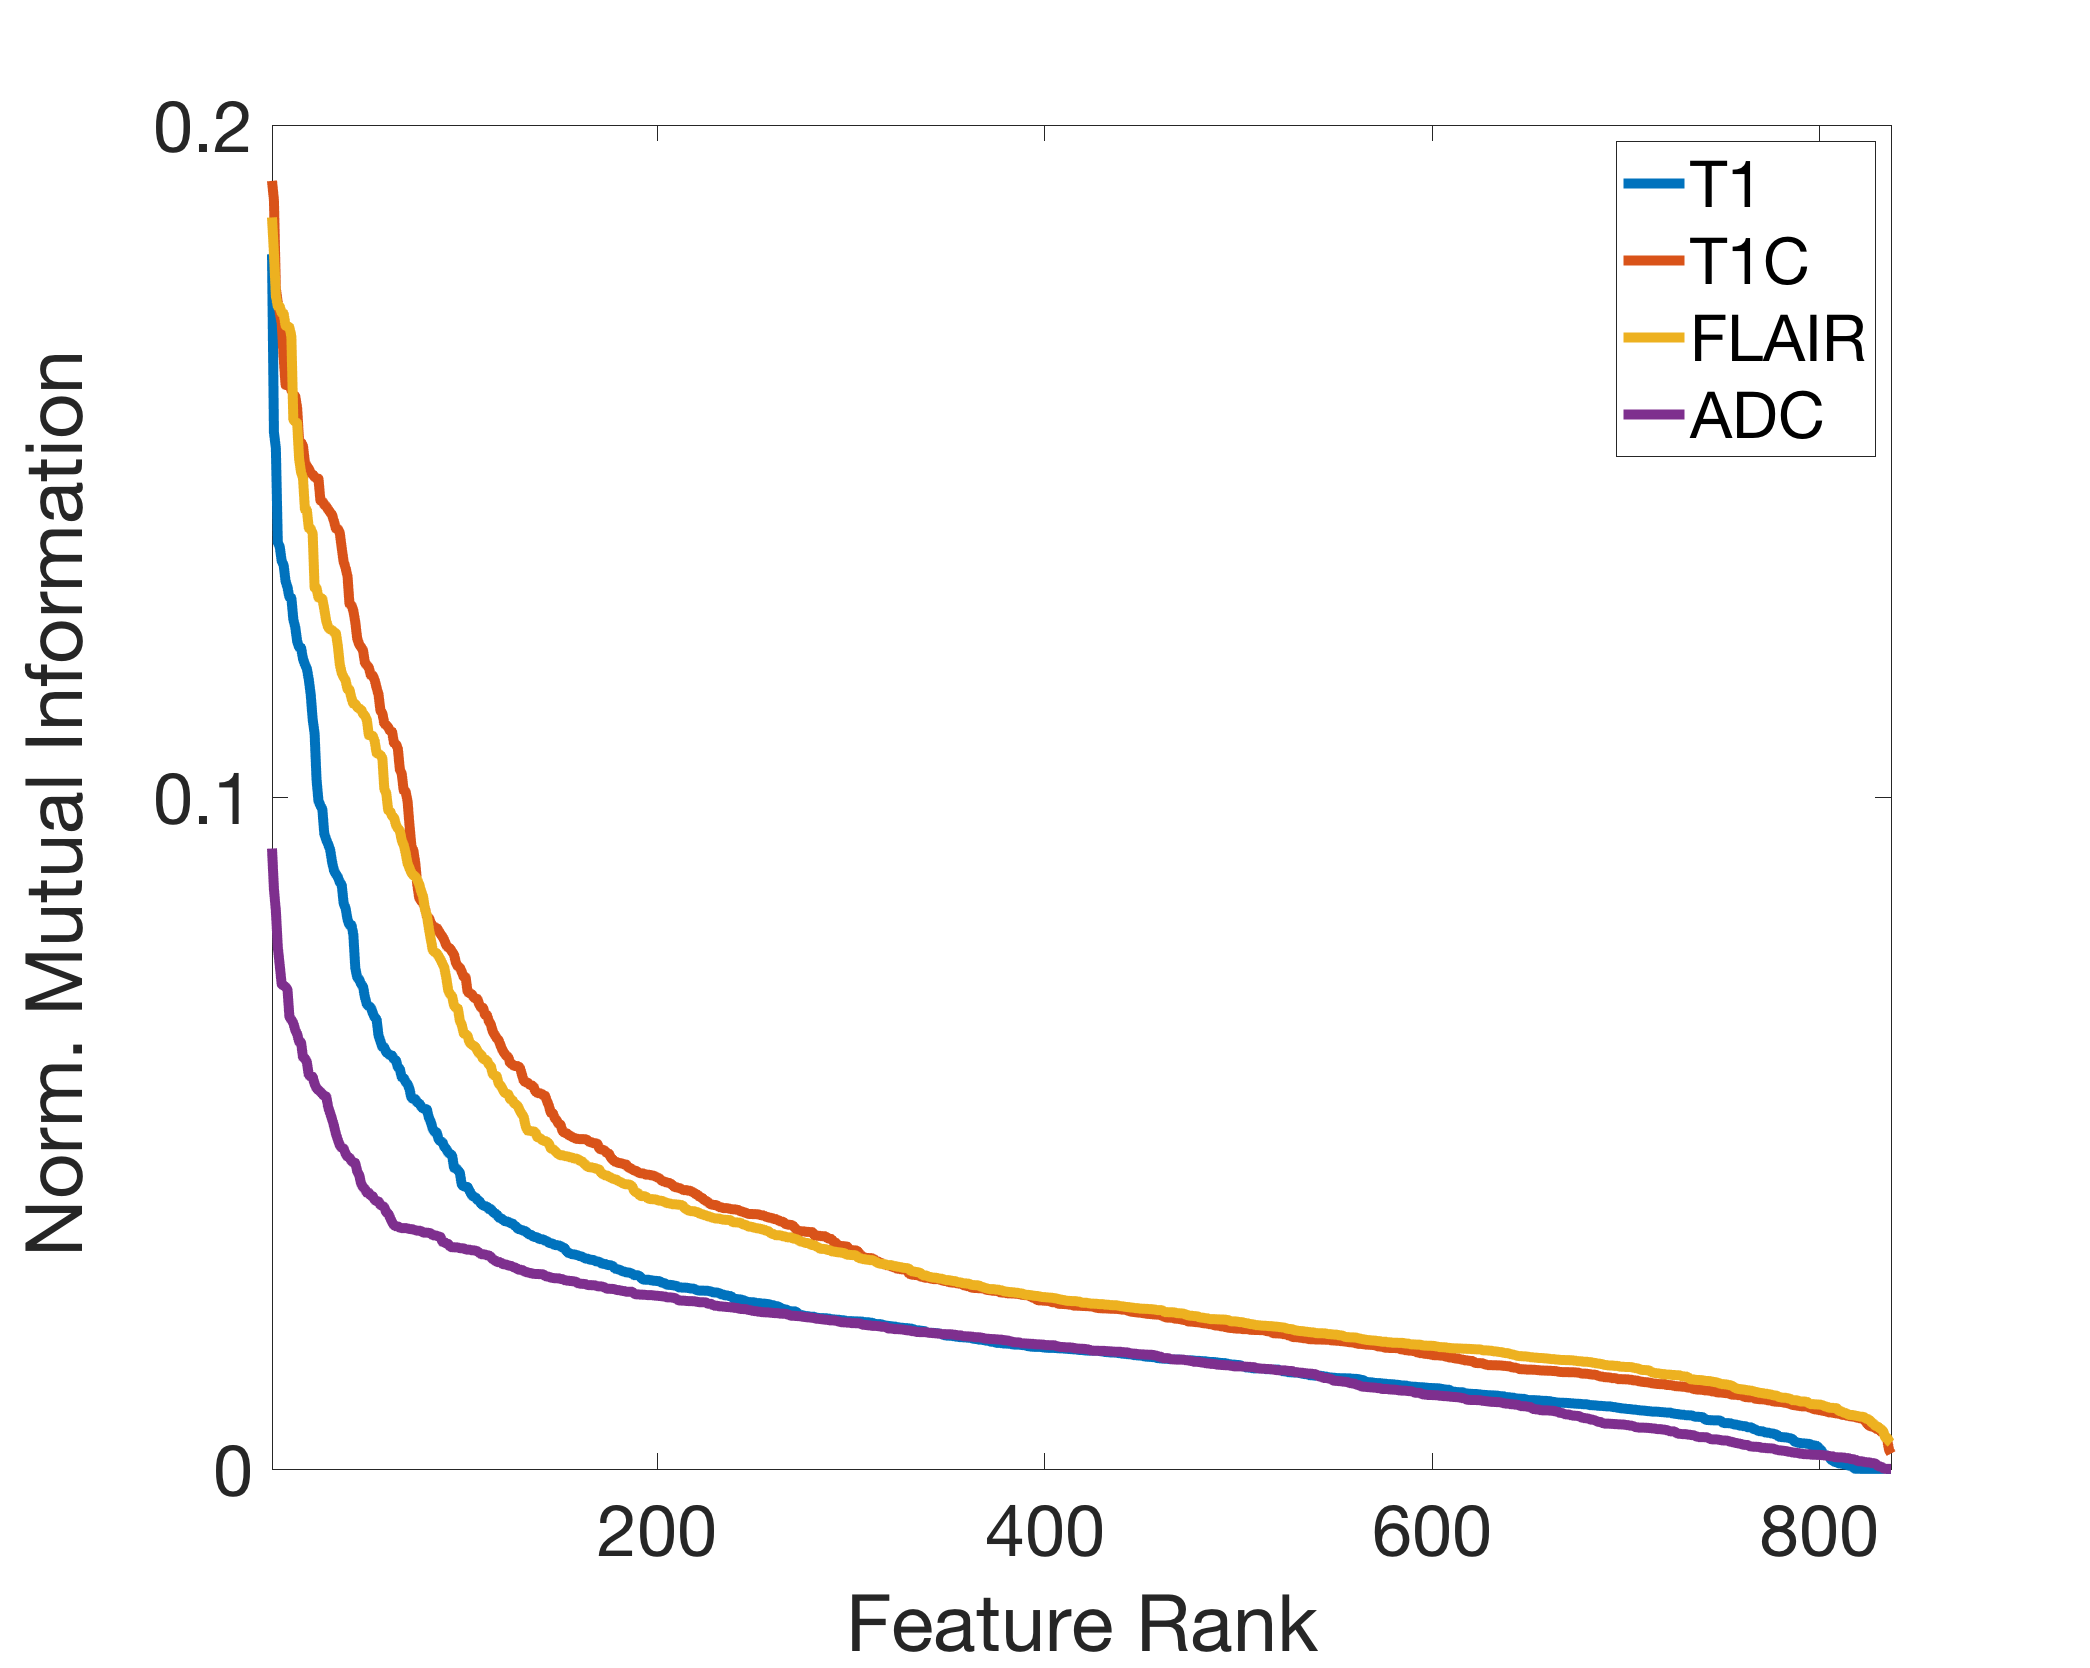
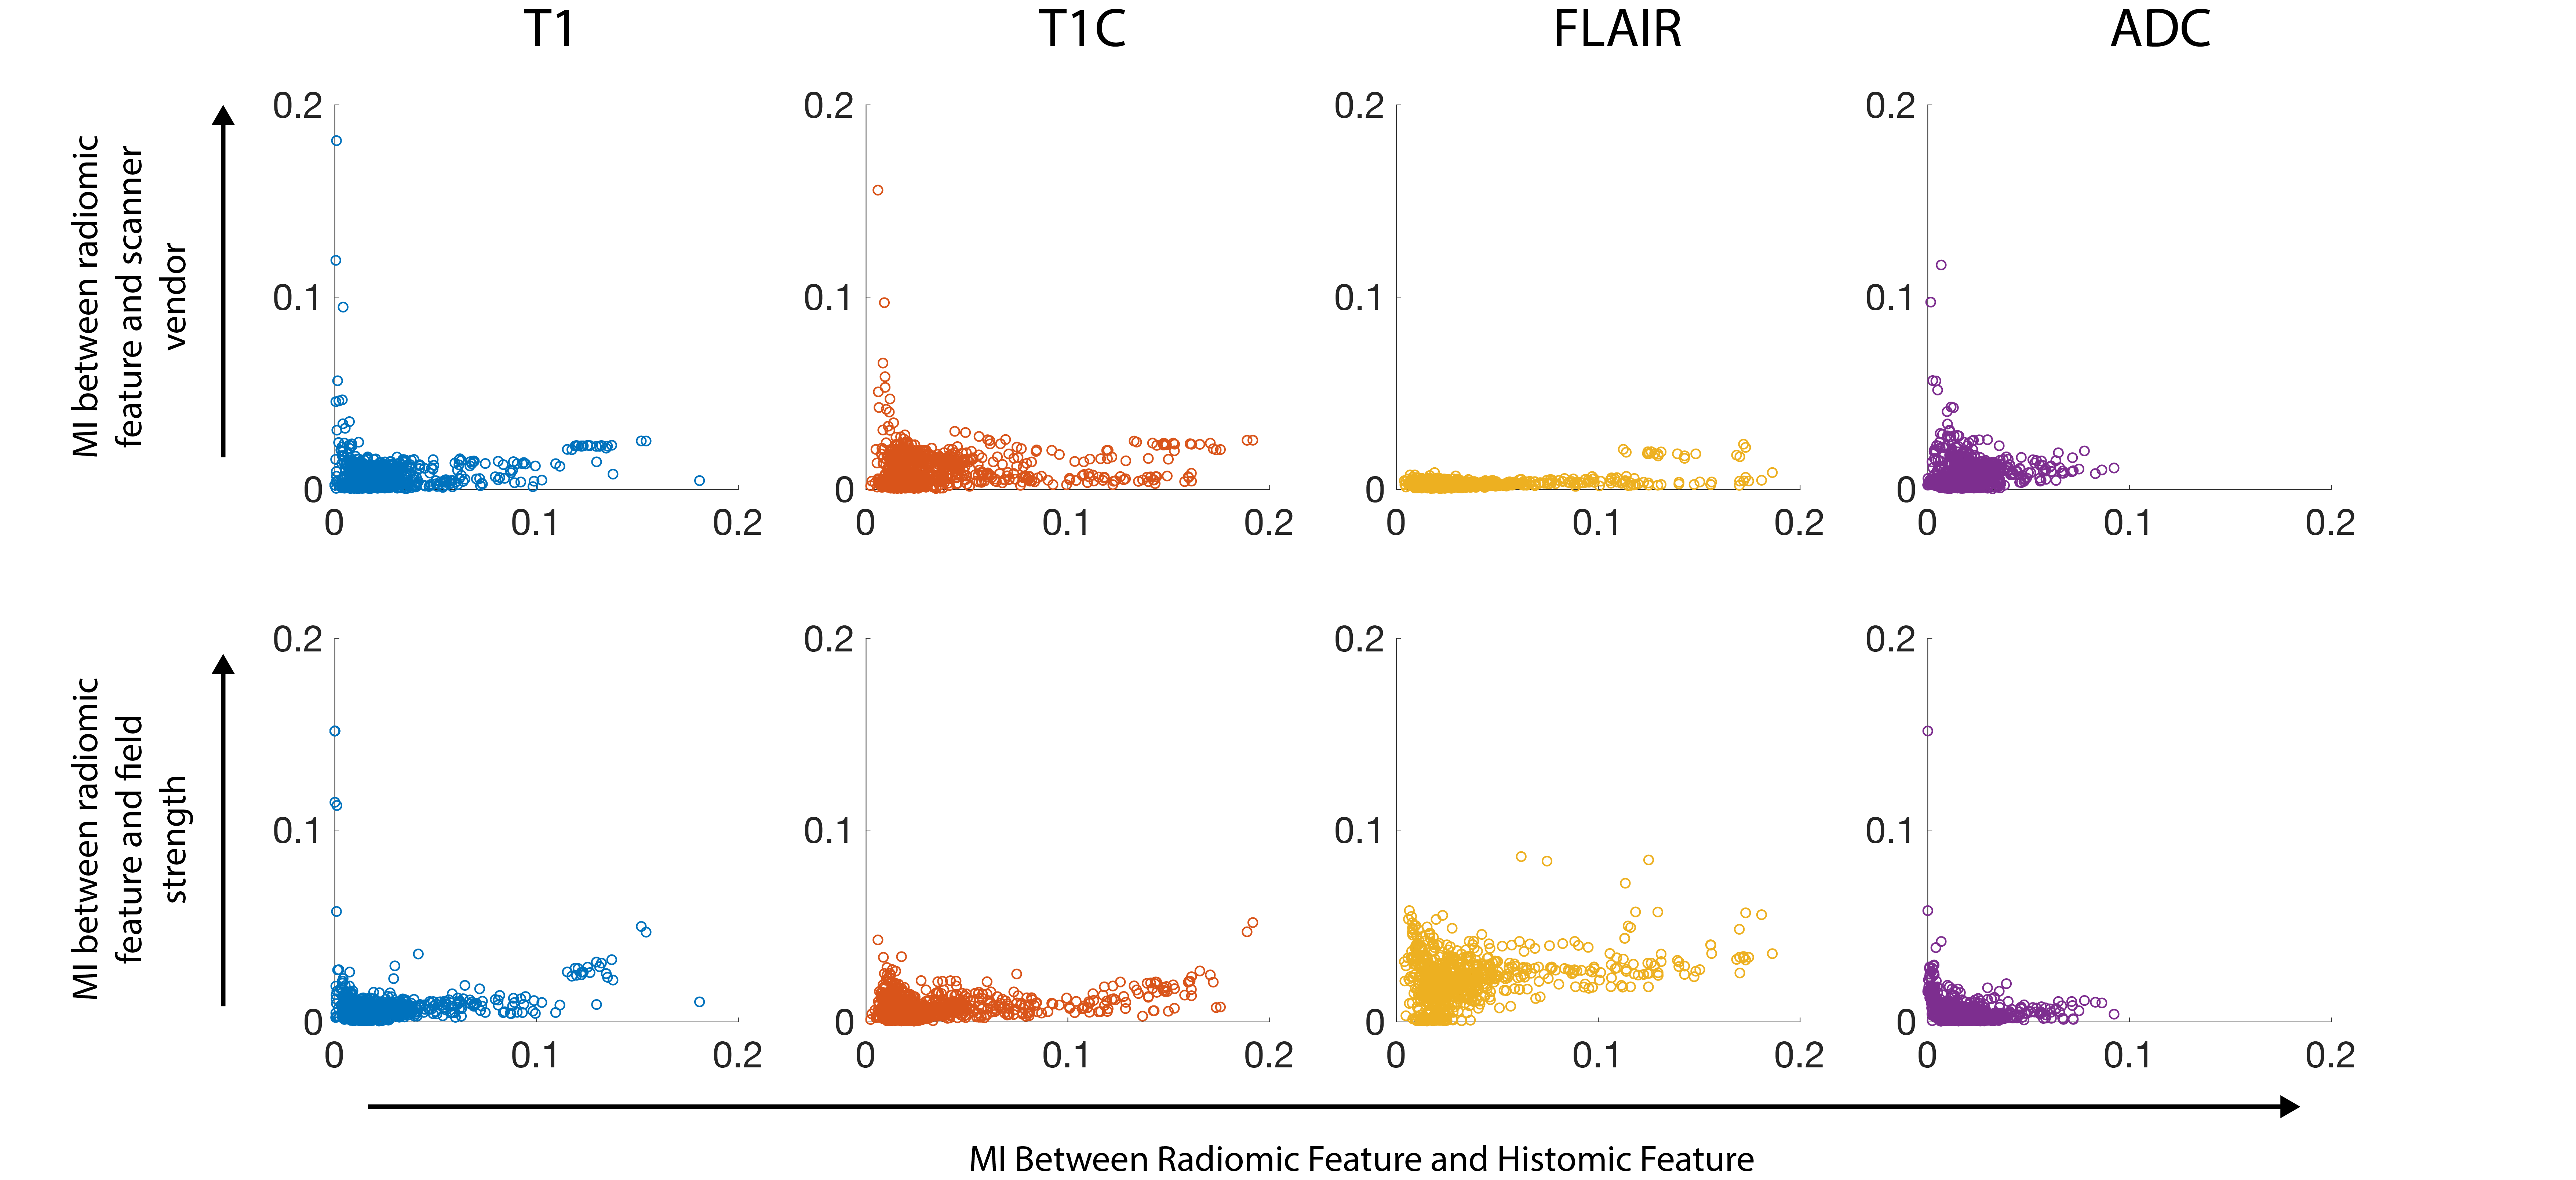
The RH relationship between analogous features was calculated using a normalized kernel-based estimation of shared information between the two variables. The mutual information (MI) between each RH pair was divided by the entropy of the histomic feature, giving the proportion of histomic information explained by the radiomic feature, presented as both a heatmap to compare individual features (Figure 3) and by ranked associations to compare across images (Figure 4). FO features tended to possess the strongest RH relationships, with FLAIR and T1+C images showing more features with strong RH relationships. The influence of scanner vendor and field strength was assessed by calculating the normalized mutual information between each radiomic feature and the confounding factor. Figure 5 shows the confound MI plotted against the RH MI, revealing that the RH pairs with the strongest relationships tended to have minor MI with scanner vendor and field strength when compared to their radiomic-histomic MI.Discussion
This study sought to explore the histological underpinnings of tile-based MP-MRI radiomic features in GBM and other brain cancer patients. Several radiomic features demonstrated substantial associations with their histomic analogs, suggesting that these aspects of the MRI directly characterize the same features of the underlying tissue histology. Furthermore, these associated features are shown to be relatively robust across different confounding factors, such as MR scanner vendor and acquisition field strength. The FLAIR image tends to provide the most robust RH relationships, with gadolinium contrast enhancement from the T1+C image providing substantial RH improvement over the standard T1. The distinction between strongly associated FO features and the lesser-associated higher order features (GLCM, GLDM, GLRLM, GLSZM, and NGTDM) tended to see increased divergence across the 3DWD, with FO features of the 3DWD images seeing stable associations and higher order features of the 3DWD images seeing both decreased and increased associations. Field strength appeared to influence the most associated radiomic features more than vendor differences and should be taken into consideration in the interpretation of radiomics-based modelling for localized histological information.Conclusion
These findings, taken as a whole, provide an information-based characterization of the texture relationship between MR images and tissue histology and begin to provide a neurobiological context for radiomics-based modelling in brain cancer.Acknowledgements
We would like to thank our patients for their participation in this study and our funding sources: American Brain Tumor Association DG14004, R01CA218144, R01CA218144-02S1, and R21CA23189201.References
1 McGarry SD, Hurrell SL, Kaczmarowski AL, et al. Magnetic Resonance Imaging-Based Radiomic Profiles Predict Patient Prognosis in Newly Diagnosed Glioblastoma Before Therapy. Tomogr (Ann Arbor, Mich) 2016;2:223–8. doi:10.18383/j.tom.2016.00250
2 Sanghani P, Ang BT, King NKK, et al. Overall survival prediction in glioblastoma multiforme patients from volumetric, shape and texture features using machine learning. Surg Oncol 2018;27:709–14. doi:10.1016/j.suronc.2018.09.002
3 Gillies RJ, Kinahan PE, Hricak H. Radiomics: Images Are More than Pictures, They Are Data. Radiology 2016;278:563–77. doi:10.1148/radiol.2015151169
4 Kniep HC, Madesta F, Schneider T, et al. Radiomics of Brain MRI: Utility in Prediction of Metastatic Tumor Type. Radiology 2018;290:479–87. doi:10.1148/radiol.2018180946
5 Um H, Tixier F, Bermudez D, et al. Impact of image preprocessing on the scanner dependence of multi-parametric MRI radiomic features and covariate shift in multi-institutional glioblastoma datasets. Phys Med Biol 2019;64:165011. doi:10.1088/1361-6560/ab2f44
6 Chirra P, Leo P, Yim M, et al. Multisite evaluation of radiomic feature reproducibility and discriminability for identifying peripheral zone prostate tumors on MRI. J Med imaging (Bellingham, Wash) 2019;6:24502. doi:10.1117/1.JMI.6.2.024502
7 Kumar V, Gu Y, Basu S, et al. Radiomics: the process and the challenges. Magn Reson Imaging 2012;30:1234–48. doi:10.1016/j.mri.2012.06.010
8 Prah MA, Al-Gizawiy MM, Mueller WM, et al. Spatial discrimination of glioblastoma and treatment effect with histologically-validated perfusion and diffusion magnetic resonance imaging metrics. J Neurooncol 2018;136:13–21. doi:10.1007/s11060-017-2617-3
9 Gates EDH, Lin JS, Weinberg JS, et al. Guiding the first biopsy in glioma patients using estimated Ki-67 maps derived from MRI: conventional versus advanced imaging. Neuro Oncol 2019;21:527–36. doi:10.1093/neuonc/noz004
Figures