0415
Multimodal MRI to aid prediction of low-grade glioma growth characteristics1Neurosciences Research Centre, St George's, University of London, London, United Kingdom, 2St George's University Hospitals NHS Foundation Trust, London, United Kingdom, 3Ashford and St Peter's Hospitals NHS Foundation Trust, Surrey, United Kingdom, 4National Lund and Heart Institute, Imperial College, London, United Kingdom, 5OncoRay—National Center for Radiation Research in Oncology, Dresden, Germany
Synopsis
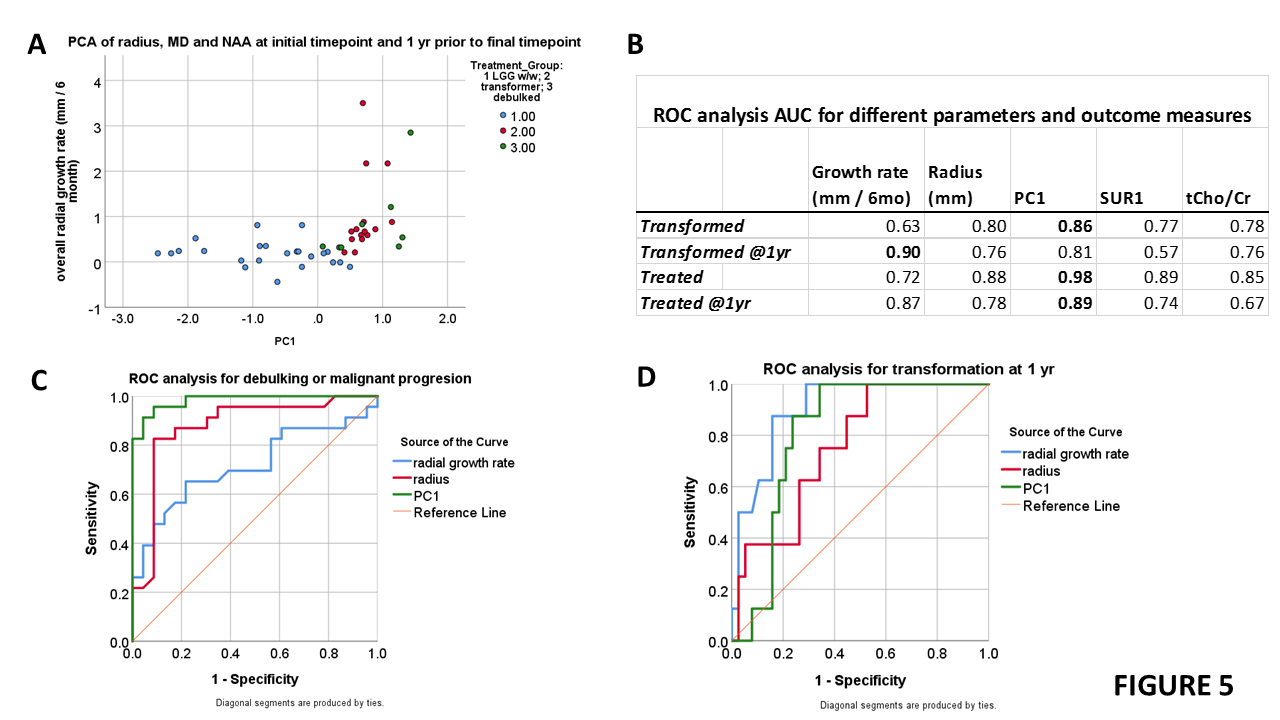
1H MRS and DTI measures were assessed for their ability to predict the future growth and malignant transformation of low-grade gliomas. The tumour core NAA concentration and the mean diffusivity (MD) within the MRS voxel, combined with the FLAIR tumour volume, provided a good predictor of tumours with higher growth rates. A ROC analysis gave an AUC of 0.86 to predict tumours likely to undergo malignant progression, and AUC of 0.98 when including those undergoing early debulking. The combined NAA, MD and volumetric parameter provided a single time-point assessment of future growth characteristics.
INTRODUCTION
Low-grade gliomas (LGG) present as slow-growing tumours and a conservative “watch and wait” strategy frequently used until they undergo malignant transformation and require aggressive treatment. Transformation may be deduced from patient clinical deterioration, or radiologically from visible tumour volume increase or contrast enhancement during routine MRI. 3D tumour volumetric measurement to determine accurate growth rates are proposed for better detection of transformation.1,2 Comparison studies suggest growth rate as a predictor of transformation outperforms tumour size at presentation, average diffusion coefficient or increased perfusion2, and increased tCho/tCr ratio is a useful predictor3. In a longitudinal study we evaluated whether a combination of tumour size with metabolic and diffusion parameters provide a better early transformation marker.METHODS
Patients from a longitudinal study were selected who had at least 3 scans 6 months apart to enable growth rate estimation (n=27): 13 were stable low-grade gliomas with no treatment (mean follow-up beyond last MRI of 19 mo, range 0-54 mo); 5 underwent surgical debulking due to tumour size; 9 showed malignant transformation. Mean scans per patient was 6.3 (range 3 to 11). 3T MRI included standard clinical T2w FLAIR, 3D T1w pre- and post-Gd, diffusion tensor imaging (DTI) and single voxel 1H MRS using PRESS (TE=30ms, TR=2000ms). MRS was acquired with voxel size (15 mm)3 to (20 mm)3 placed within the tumour bulk.Metabolite concentrations were determined using tissue water as a reference with no correction for water content or relaxation times. Lesion size was determined by multi-slice delineation of FLAIR lesion area and subsequent independent review. Estimated total lesion volumes were converted to a radius in mm of an equivalent sized sphere for growth rate calculations in units of mm growth per 6 month1. Average DTI measures of MD and FA were computed within the MRS voxels.
A univariate Cox proportional hazards analysis was used to determine which parameters best predicted outcome of malignant transformation, or for any treatment (which includes debulking). A backward conditional multivariate Cox analysis was then used to create an outcome function. PCA was additionally used for parameter reduction. ROC analysis was performed for prediction over the whole study period from the 1st scan data; and for prediction of 1yr outcome using combined data from the 1st scan and 1yr prior to the final scan.
RESULTS
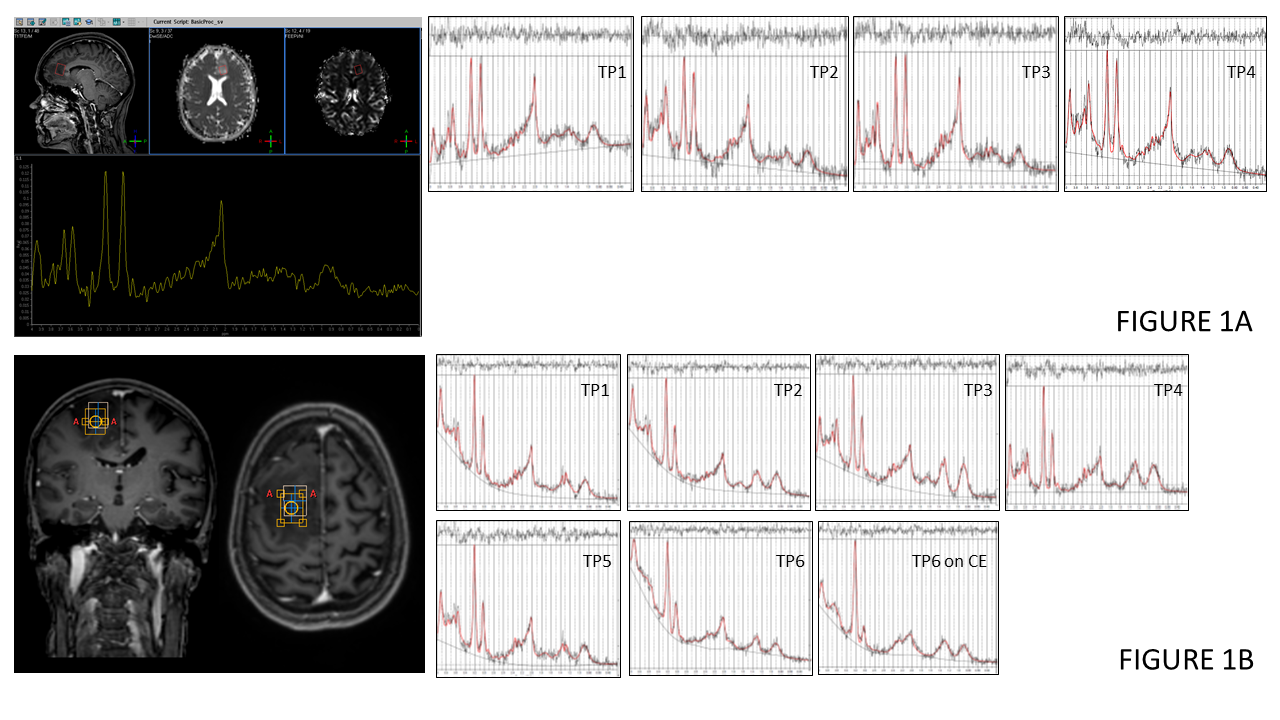
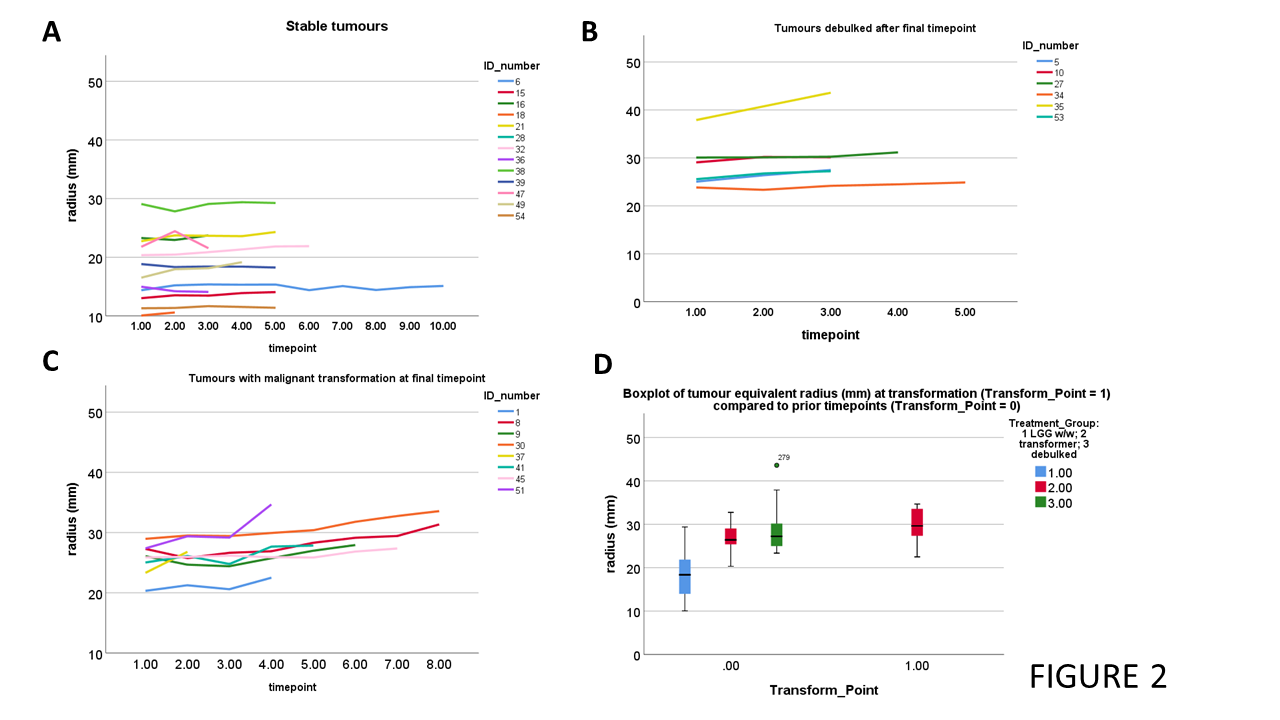
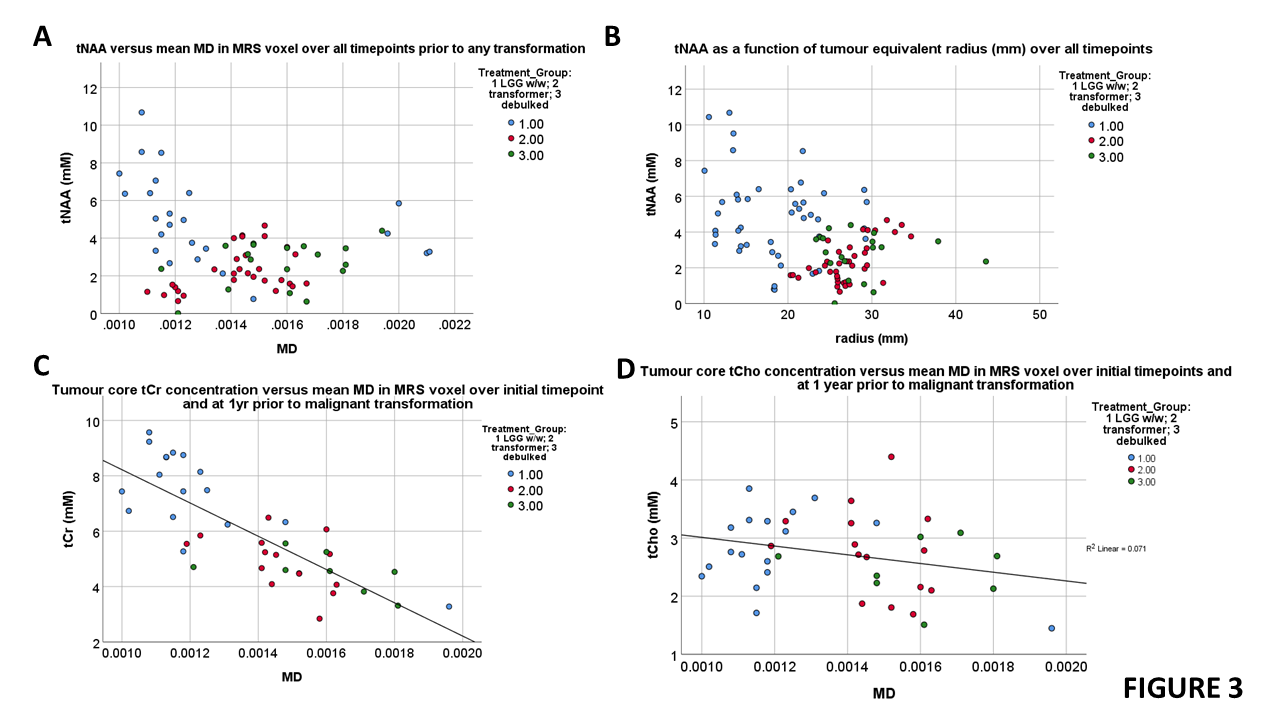
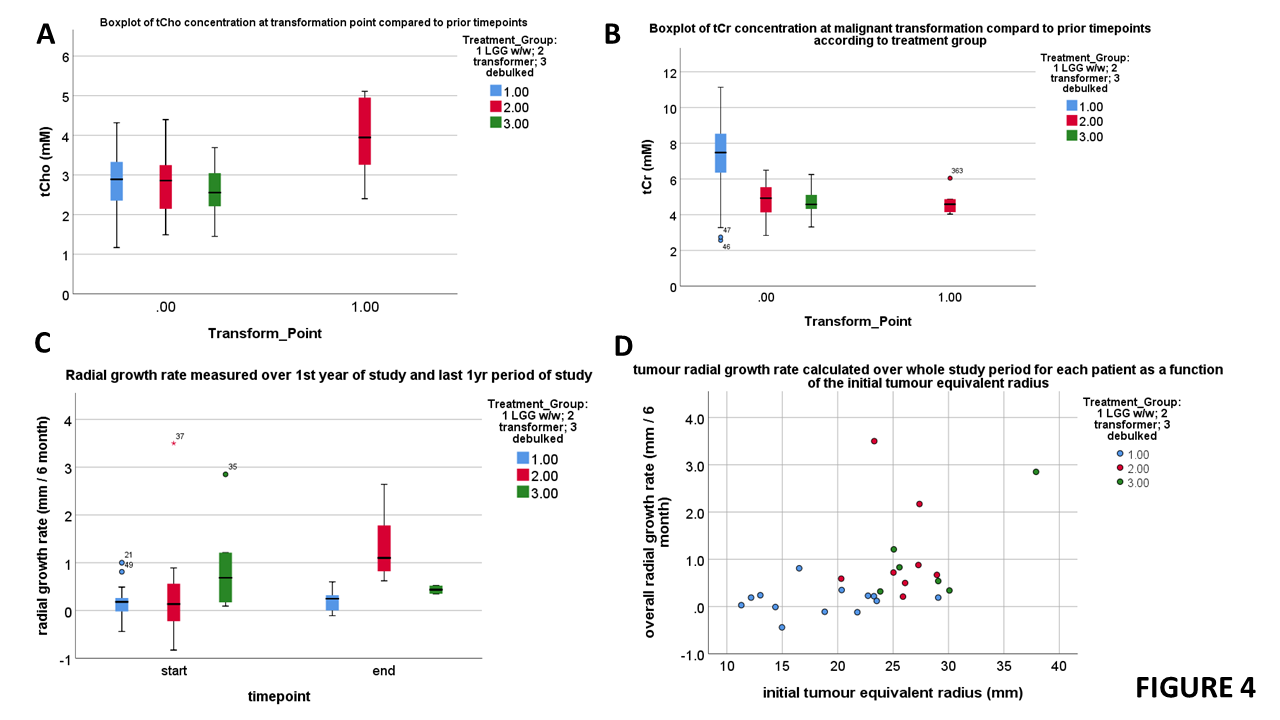
Figure 1 shows example sequences of 1H MRS for stable and transforming low-grade gliomas. Figure 2 shows the time course of the tumour equivalent radius for the three tumour groups. Tumours that showed malignant progression or went for debulking, were significantly larger (p=0.006) and had higher overall growth rates (p=0.001) than stable low grade gliomas. Tumours that underwent treatment due to size or transformation had lower core tNAA, which was inversely related to tumour size (Figure 3A). Higher MD was associated with lower tNAA and lower tCr, whereas tCho was not significantly altered (Figure 3C to 3D). tCho was highest at the point of malignant transformation (Figure 4A), even though voxel location was selected prior to observable contrast enhancement. tCr was reduced in the tumours most likely to undergo debulking or malignant transformation (Figure 4B). The radial growth rate over the 1st year period, and the final year period, was only significantly different for the tumours that transformed (Figure 4C). Tumours with an initial radius ≥25mm were more likely to undergo treatment (Figure 4D).Cox-Proportional Hazards analysis indicated tNAA (p=0.007), MD (p=0.004) and radius (p=0.023) were the best predictors for future treatment from initial timepoint measures, giving prediction parameter SUR1. Parameter PC1 was then derived from PCA of these measures over all timepoints. Analysis for predicting transformation indicated just tCho/tCr (p=0.001) was significant. Similar results were found when predicting 1yr outcome from combined initial and 1yr prior to final datapoints.
PC1 shows good separation of stable and treated tumour groups in comparison to growth rates (Figure 5A). ROC analysis indicated that PC1 is better than SUR1, tCho/tCr and radius for overall classification and 1yr predictions (Figure 5B and 5C). Growth rate is the best predictor of transformation at 1yr (Figure 5B and 5D).
DISCUSSION
As shown by others4 we observe a critical tumour size above which higher growth rates and more likely a clinical intervention occurs. However,the multimodal factor PC1 provided a better predictor of the requirement for clinical treatment than volumetric measures alone. PC1 was close to growth rate in accuracy for predicting transformation, but with the advantage of being derived from a single time point.Elevated MD and reduced NAA with little change in tCho in more rapidly growing tumours suggests loss of neuronal structure and increased tumour mass. The initially high tCho/tCr in low-grade glioma is then due to reduced tCr (suggesting altered metabolic status compared to normal tissue) rather than elevated tCho, which then occurs at transformation. The factor PC1 likely aids detection of the presence of higher fraction of tumour cells within the lesion core, and with an included volume measure, indicates the capacity for greater tumour growth, hence transformation or need for debulking. A larger study is still needed to confirm whether PC1 is an independent predictor or reflects genetic subtypes or other factors related to outcome.5
Acknowledgements
This work was supported by Cancer Research UK grant C7809/A10342References
1. Pallud J, Taillandier L, Capelle L, et al. Quantitative morphological magnetic resonance imaging follow-up of low-grade glioma: a plea for systematic measurement of growth rates. Neurosurgery 2012, 71:729–39.
2. Caseiras GB, Ciccarelli O, Altmann DR, et al. Low-Grade Gliomas: Six-month Tumor Growth Predicts Patient Outcome Better than Admission Tumor Volume, Relative Cerebral Blood Volume, and Apparent Diffusion Coefficient. Radiology 2009, 253:2, 505-512.
3. Hlaihel C, Guilloton L, Guyotat J, et al. Predictive value of multimodality MRI using conventional, perfusion, and spectroscopy MR in anaplastic transformation of low-grade oligodendrogliomas. J Neurooncol 2010, 97:73–80.
4. Gui C, Kosteniuk SE, Lau JC, et al. Tumor growth dynamics in serially-imaged low-grade glioma patients. J of Neuro-Oncology 2018, 139:167–175.
5. Pallud J, Blonski M, Mandonnet E, et al.. Velocity of tumor spontaneous expansion predicts long-term outcomes for diffuse low-grade gliomas. Neuro-Oncology 2013, 15:595–606.
Figures