0414
Altered Systemic Fluctuations of Blood Flow in Brains with Glioma: An Investigation with Temporal-Shift Resting-State fMRI1Shenzhen Institutes of Advanced Technology, Chinese Academy of Sciences, Shenzhen, China, 2Huashan Hospital of Fudan University, Shanghai, China, 3University of Chinese Academy of Science, Beijing, China
Synopsis
The systemic oscillation of the blood flow in cerebrum and cerebellum may vary with gliomas of different malignancy, resulting in neurovascular uncoupling and abnormal perfusion. In this study, we investigated the implication of glioma on the oscillation of cerebral blood flow based on time-shifted rs-fMRI. HGGs induces more widely alterations in the spontaneous fluctuations of cerebral and cerebellar blood flow at the global scale. Vascular oscillation changes derived from rs-fMRI may provide a novel insight for the assessment of the functional plasticity and its clinical relevance in the interpretation of the psychological and psychiatric symptoms in subjects with glioma.
Instruction
The systemic oscillation of the blood flow in cerebrum and cerebellum may vary with gliomas of different malignancy as a result of impaired neurovascular coupling (NVC) and/or cerebral perfusion.1-3 In this study, we aim to explore the implication of cerebral glioma on the oscillation of global cerebral blood flow based on the temporal-shift resting state functional MR images (rs-fMRI).Materials and Methods
This study was approved by local institutional review board. A total of 33 subjects (LGG: female/male 6/9, aged 35.10±8.13; HGG: female/male 9/9, aged 44.88±11.55) with histological confirmed glioma located in left hemisphere were consecutively recruited. Rs-fMRI data was acquired using gradient echo-planar imaging sequence (3.0T, Siemens Verio, Germany) with a 12-channel phase array head coil. The major imaging parameters were TR/TE 2000/35ms, FA 90°, FOV 210×210mm, matrix 64×64, slice thickness 4.0mm, 240 volumes. Rs-fMRI data were preprocessed using Graph Theoretical Network Analysis toolbox.4 The first 10 time points were discarded for scanner calibration. Slice timing and realignment were performed in turn to remove the temporal differences between slices and correct head movement. The signal of CSF and head motion parameters obtained with Friston 24-parameter model were regressed out. Images were then normalized to the standard Montreal Neurological Institute template (MNI152) with voxel size resampled to 2 x 2 x 2mm3 and spatially smoothed by a Gaussian kernel (FWHM = 4mm). Linear trend removing and low-pass filtering (0.01-0.1Hz) were applied to remove high frequency physiological noises and low frequency drift. The mean BOLD dynamics of the contralesional hemisphere (CH) was defined as the regressor. The time series of each voxel was shifted from -7TR to +7TR. Linear regression was conducted to calculate the regression coefficient between the time series of each voxel and the regressor at each time shift, resulting in a series of regression coefficient for each voxel [β-7TR, β-6TR, ... ,β+6TR, β+7TR]. The temporal shift value with the maximum regression coefficient was assigned to the given voxel, forming the time shift map of each subject (Figure 1). The negative time-shift values represent the area with potential hypoperfusion, while the positive values indicate possible hyperperfusion.5 Coefficient of kurtosis and skewness were calculated for the contralesional cerebral hemisphere and each cerebellar hemisphere based on the histogram of the time shift map. Two-tailed t test and permutation test were performed for intergroup comparison between low grade (LGG) and high grade gliomas (HGG) (SPSS 19.0). p﹤0.05 was set as significance level with multiple comparison correction.Results
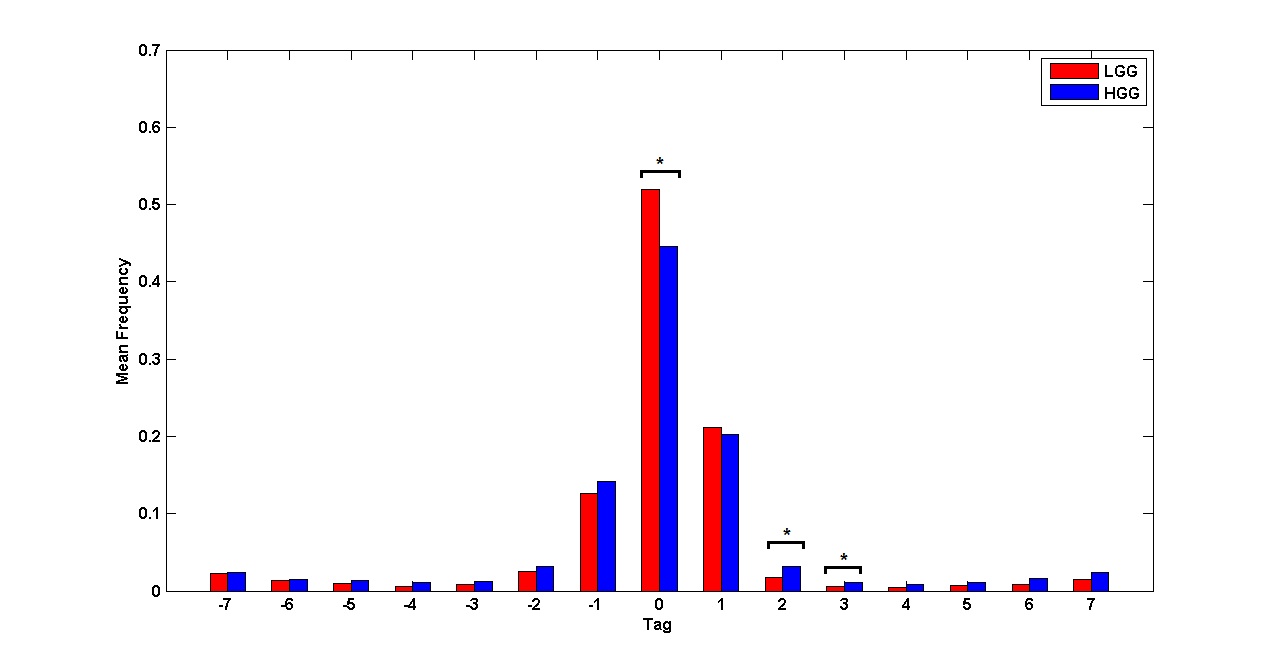
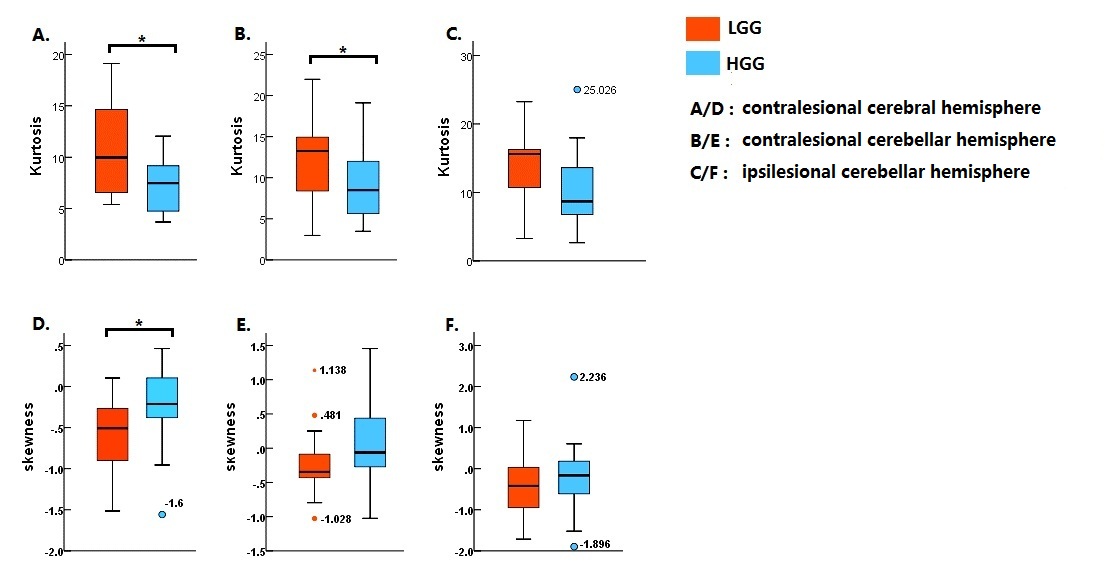
Representative time-shift maps of LGG and HGG were shown in Figure 1. More voxels with temporal shift = 0 were observed in LGG than HGG group (p <0.05, FDR corrected). The percent of voxels with +2TR and +3TR temporal shift in the contralesional hemisphere were significantly higher in HGGs than that of LGGs (p <0.05, FDR corrected) (Figure 2). The histogram distribution of the temporal shift value in the contralesional hemisphere showed significantly intergroup difference, with HGGs manifesting lower kurtosis and higher skewness relative to LGGs. The histogram of the contralesional cerebellum showed a lower kurtosis in HGGs as compared to that of LGGs (p<0.05, permutation test, number of permutations = 1,000) (Figure 3).Discussion
The dynamic of rs-fMRI is reflective of NVC in healthy brains.6 Growth of glioma may interrupt the NVC, possibly due to vascular dysfunction or the interaction among astrocytes, neurons and the glioma cells.3 Glioma-induced local or systemic hypercapnia would result in impaired vascular autoregulation, leading to neurovascular uncoupling and abnormal perfusion. LGGs and HGGs proliferate with different pattern, and may interrupt the NVC at various degrees.1 This may interpret the distinct intergroup variations in the spontaneous fluctuations of cerebral blood flow in this study. The deminishing vascular autoregulation may pivot the tumor progression and intertwine with functional and structural plasticity in shaping the global effect of glioma.Conclusion
HGGs induces more widely alterations in the spontaneous fluctuations of cerebral and cerebellar blood flow at the global scale. Alterations in the cerebral vascular oscillation derived from rs-fMRI provide a novel insight for the assessment of the functional plasticity in the context of glioma progession, and may substrate clinical relevance of the the psychological and psychiatric symptoms in subjects with glioma.Acknowledgements
No acknowledgement found.References
1. Agarwal S, Sair HI, Yahyavi-Firouz-Abadi N, Airan R, Pillai JJ. Neurovascular uncoupling in resting state fMRI demonstrated in patients with primary brain gliomas. J Magn Reson Imaging 2016; 43(3): 620-6.
2. Chow DS, Horenstein CI, Canoll P, et al. Glioblastoma Induces Vascular Dysregulation in Nonenhancing Peritumoral Regions in Humans. AJR Am J Roentgenol 2016; 206(5): 1073-81.
3. Venkatesh HS, Morishita W, Geraghty AC, et al. Electrical and synaptic integration of glioma into neural circuits. Nature 2019; 573(7775): 539-45.
4. Wang J, Wang X, Xia M, Liao X, Evans A, He Y. GRETNA: a graph theoretical network analysis toolbox for imaging connectomics. Front Hum Neurosci 2015; 9: 386.
5. Chen Q, Zhou J, Zhang H, et al. One-step analysis of brain perfusion and function for acute stroke patients after reperfusion: A resting-state fMRI study. J Magn Reson Imaging 2018.6.
6. Phillips AA, Chan FH, Zheng MM, Krassioukov AV, Ainslie PN. Neurovascular coupling in humans: Physiology, methodological advances and clinical implications. J Cereb Blood Flow Metab 2016; 36(4): 647-64.
Figures