0413
Evaluating the use of rCBV as a tumor grade classifier across NCI Quantitative Imaging Network sites: Part II of the DSC-MRI DRO Challenge1Barrow Neurological Institute, Phoenix, AZ, United States, 2Mayo Clinic, Scottsdale, AZ, United States, 3Medical College of Wisconsin53226, Milwaukee, WI, United States, 4Rhode Island Hospital and Alpert Medical School of Brown University, Providence, RI, United States, 5Washington University in St. Louis, St. Louis, MO, United States, 6Mayo Clinic, Rochester, MN, United States, 7The University of Texas at Austin, Austin, TX, United States, 8University of Michigan, Ann Arbor, MI, United States, 9University of Texas Health Science Center at San Antonio, San Antonio, TX, United States, 10Massachusetts General Hospital, Boston, MA, United States, 11University of Washington, Seattle, WA, United States, 12The University of Texas Southwestern, Dallas, TX, United States
Synopsis
Using a dynamic susceptibility contrast (DSC) MRI DRO we previously characterized brain tumor relative cerebral blood volume (rCBV) reproducibility across 12 sites employing a range of imaging protocols and software platforms. Our goal in this study is to determine the impact of rCBV reproducibility for tumor grade classification. We found that varying software platforms produced a range of optimal thresholds, but the performance of these thresholds were similar. These results indicate that different software platforms are able to classify tumor grades, but the site-specific thresholds underscore the importance of standardizing acquisition and analysis protocols across sites and software benchmarking.
Introduction:
In a previously published study involving 12 sites within the NCI’s Quantitative Imaging Network (QIN)1, variable imaging protocols (IP)s and post-processing methods (PM)s were found to reduce rCBV reproducibility. This study extends this investigation by evaluating the potential impact of variable IPs and PMs on a clinical use case, brain tumor grade classification. To achieve this goal, virtual tumors mimicking high- and low- grade glioma tumors were created using a DSC digital reference object (DRO) representative of a wide-range of glioma MR signals.2Methods:
Virtual Tumor Development: The DRO encompasses 10,000 tumor voxels that were simulated for both an intact- (Ktrans = 0) and a disrupted- (Ktrans > 0) blood-brain-barrier (BBB). In order to create virtual HGG and LGG tumors, we utilized a publicly available dataset3 on The Cancer Imaging Archive (TCIA)4. This dataset contains 49 DSC-MRI images of low- (LGG; n = 13) and high-grade (HGG; n = 36) glial brain lesions. We simulated a DRO to match the IP used in this dataset, and then randomly selected 25 DRO rCBV voxels that each matched the mean of the tumor rCBV in the database to within +/-20%. In the end, 24 LGG and 72 HGG virtual tumors were simulated. The DRO used for virtual tumor development was considered the reference where applicable.Study Design: This challenge was comprised of three phases to evaluate the influence of IP and/or PM on tumor grading across 12 participating sites of the QIN (Table 1). Phase I (“site IP w/constant PM”) required each site to submit their clinical IP to the managing center (n = 20). Site-specific IPs were generated and processed by the managing center according to post-processing steps previously published5-6. Phase II (“constant IP w/site PM”) required each site to process an IP recommended by the ASFNR7 using their software of choice (n = 17). Phase III (“site IP w/site PM”) required each site to process their site-specific IP DROs using their software of choice (n = 25). A total of 62 DROs were analyzed.
Statistical Analysis: The ability to classify tumor grade was evaluated using a two-sampled t-test (p-values < 0.05 were considered statistically significant) and Receiver Operating Characteristics (ROC) analysis. The optimal threshold was normalized to the reference’s optimal threshold. The relative optimal threshold and area under the ROC (AUROC) is reported for each submitted DRO.
Results:
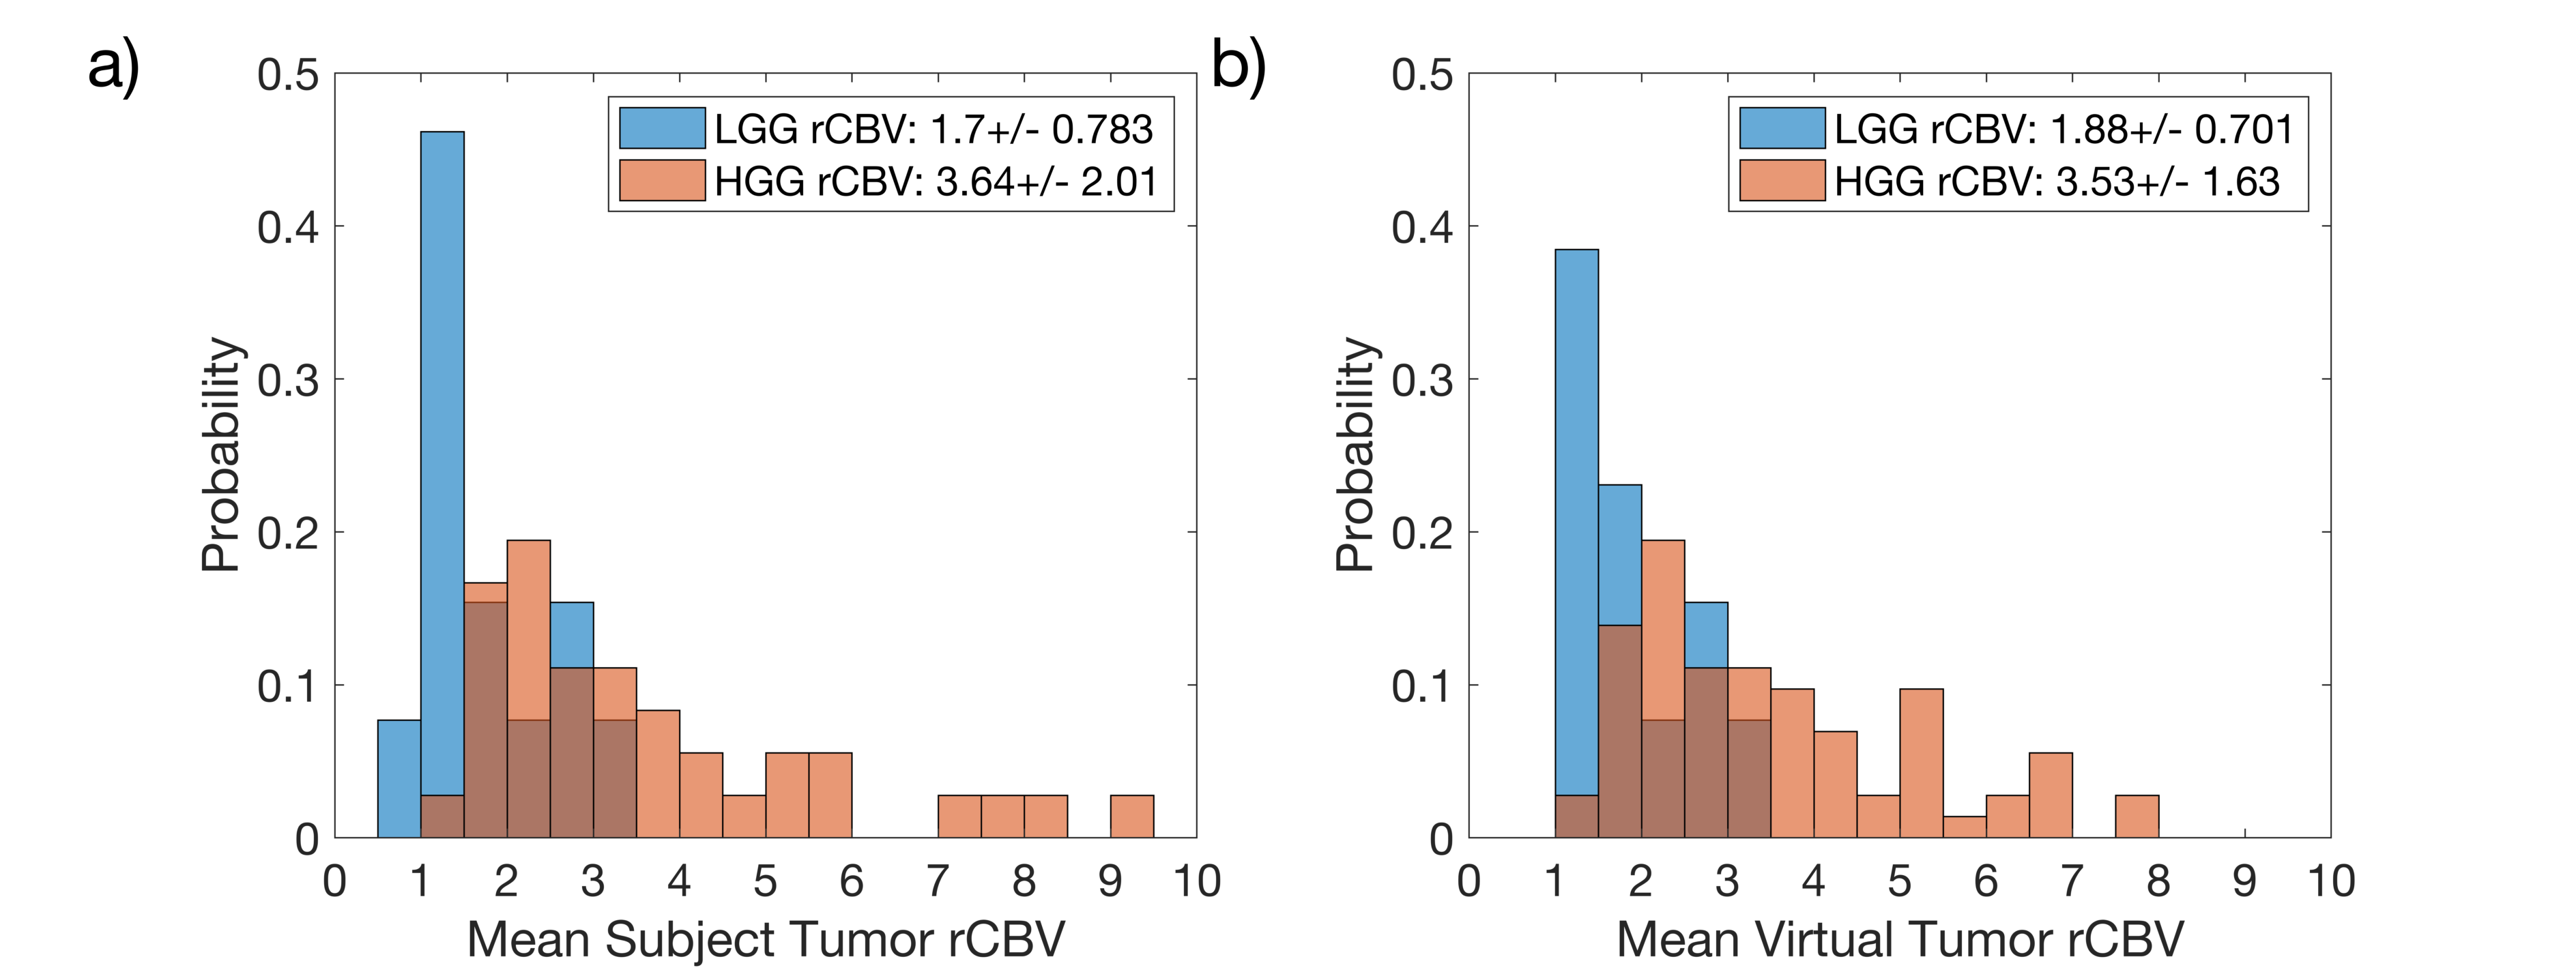
The rCBV histograms of the TCIA dataset (Fig1a) and the virtual tumors (Fig1b) were similar. Because of the range of DRO values, low (<1) and high (>8) rCBV tumors were not matched as shown in Fig1b, but their mean values were within 10% for LGG and 3% for HGG populations. Once these virtual tumors were confirmed with literature, we applied these tumor masks to the 62 previously submitted DROs.Multiple IPs and PMs were reported by sites (Table 1). The majority of IPs submitted were similar to the current consensus recommendation7. A variety of software platforms were used: IB Neuro, nordicICE, PGUI, 3D Slicer, Philips IntelliSpace Portal, and in-house processing scripts.
For all three phases of this study, all submissions resulted in a statistically significant p-value (p-values < 0.05) for both intact and disrupted BBB simulations. This indicates that regardless of the IP or PM combinations used during submission, the mean rCBV of each tumor grade was statistically different from each other.
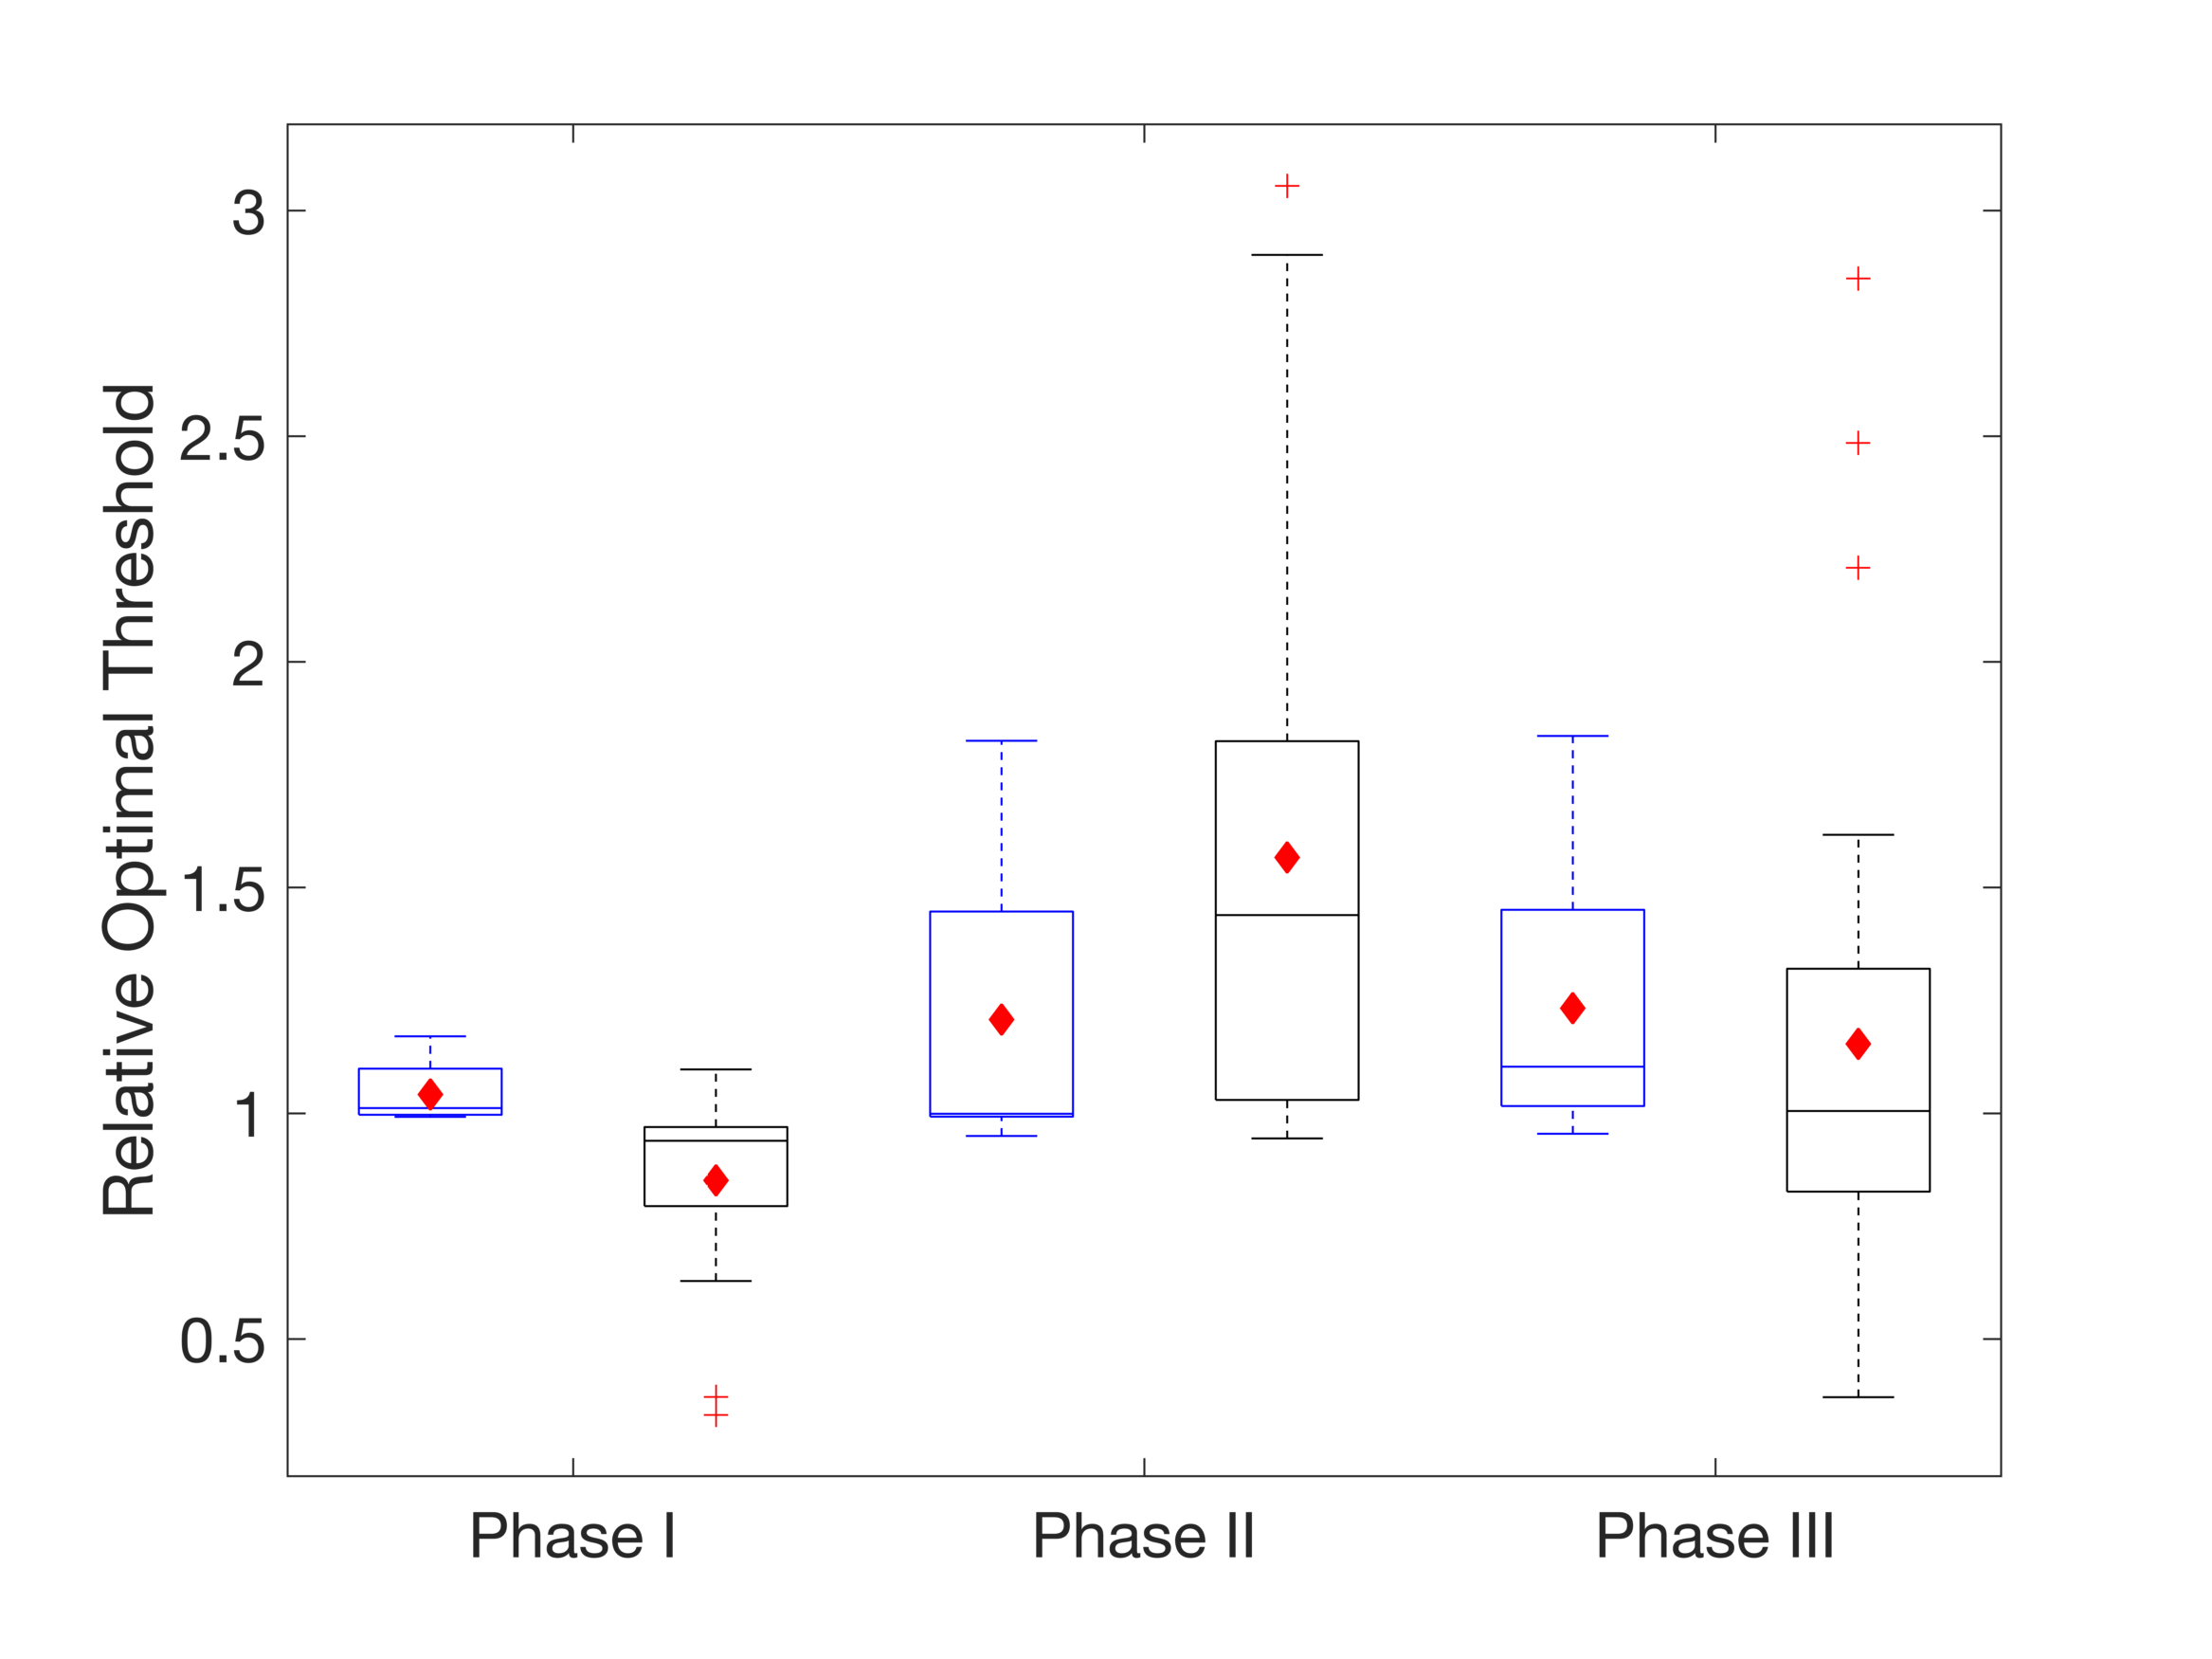
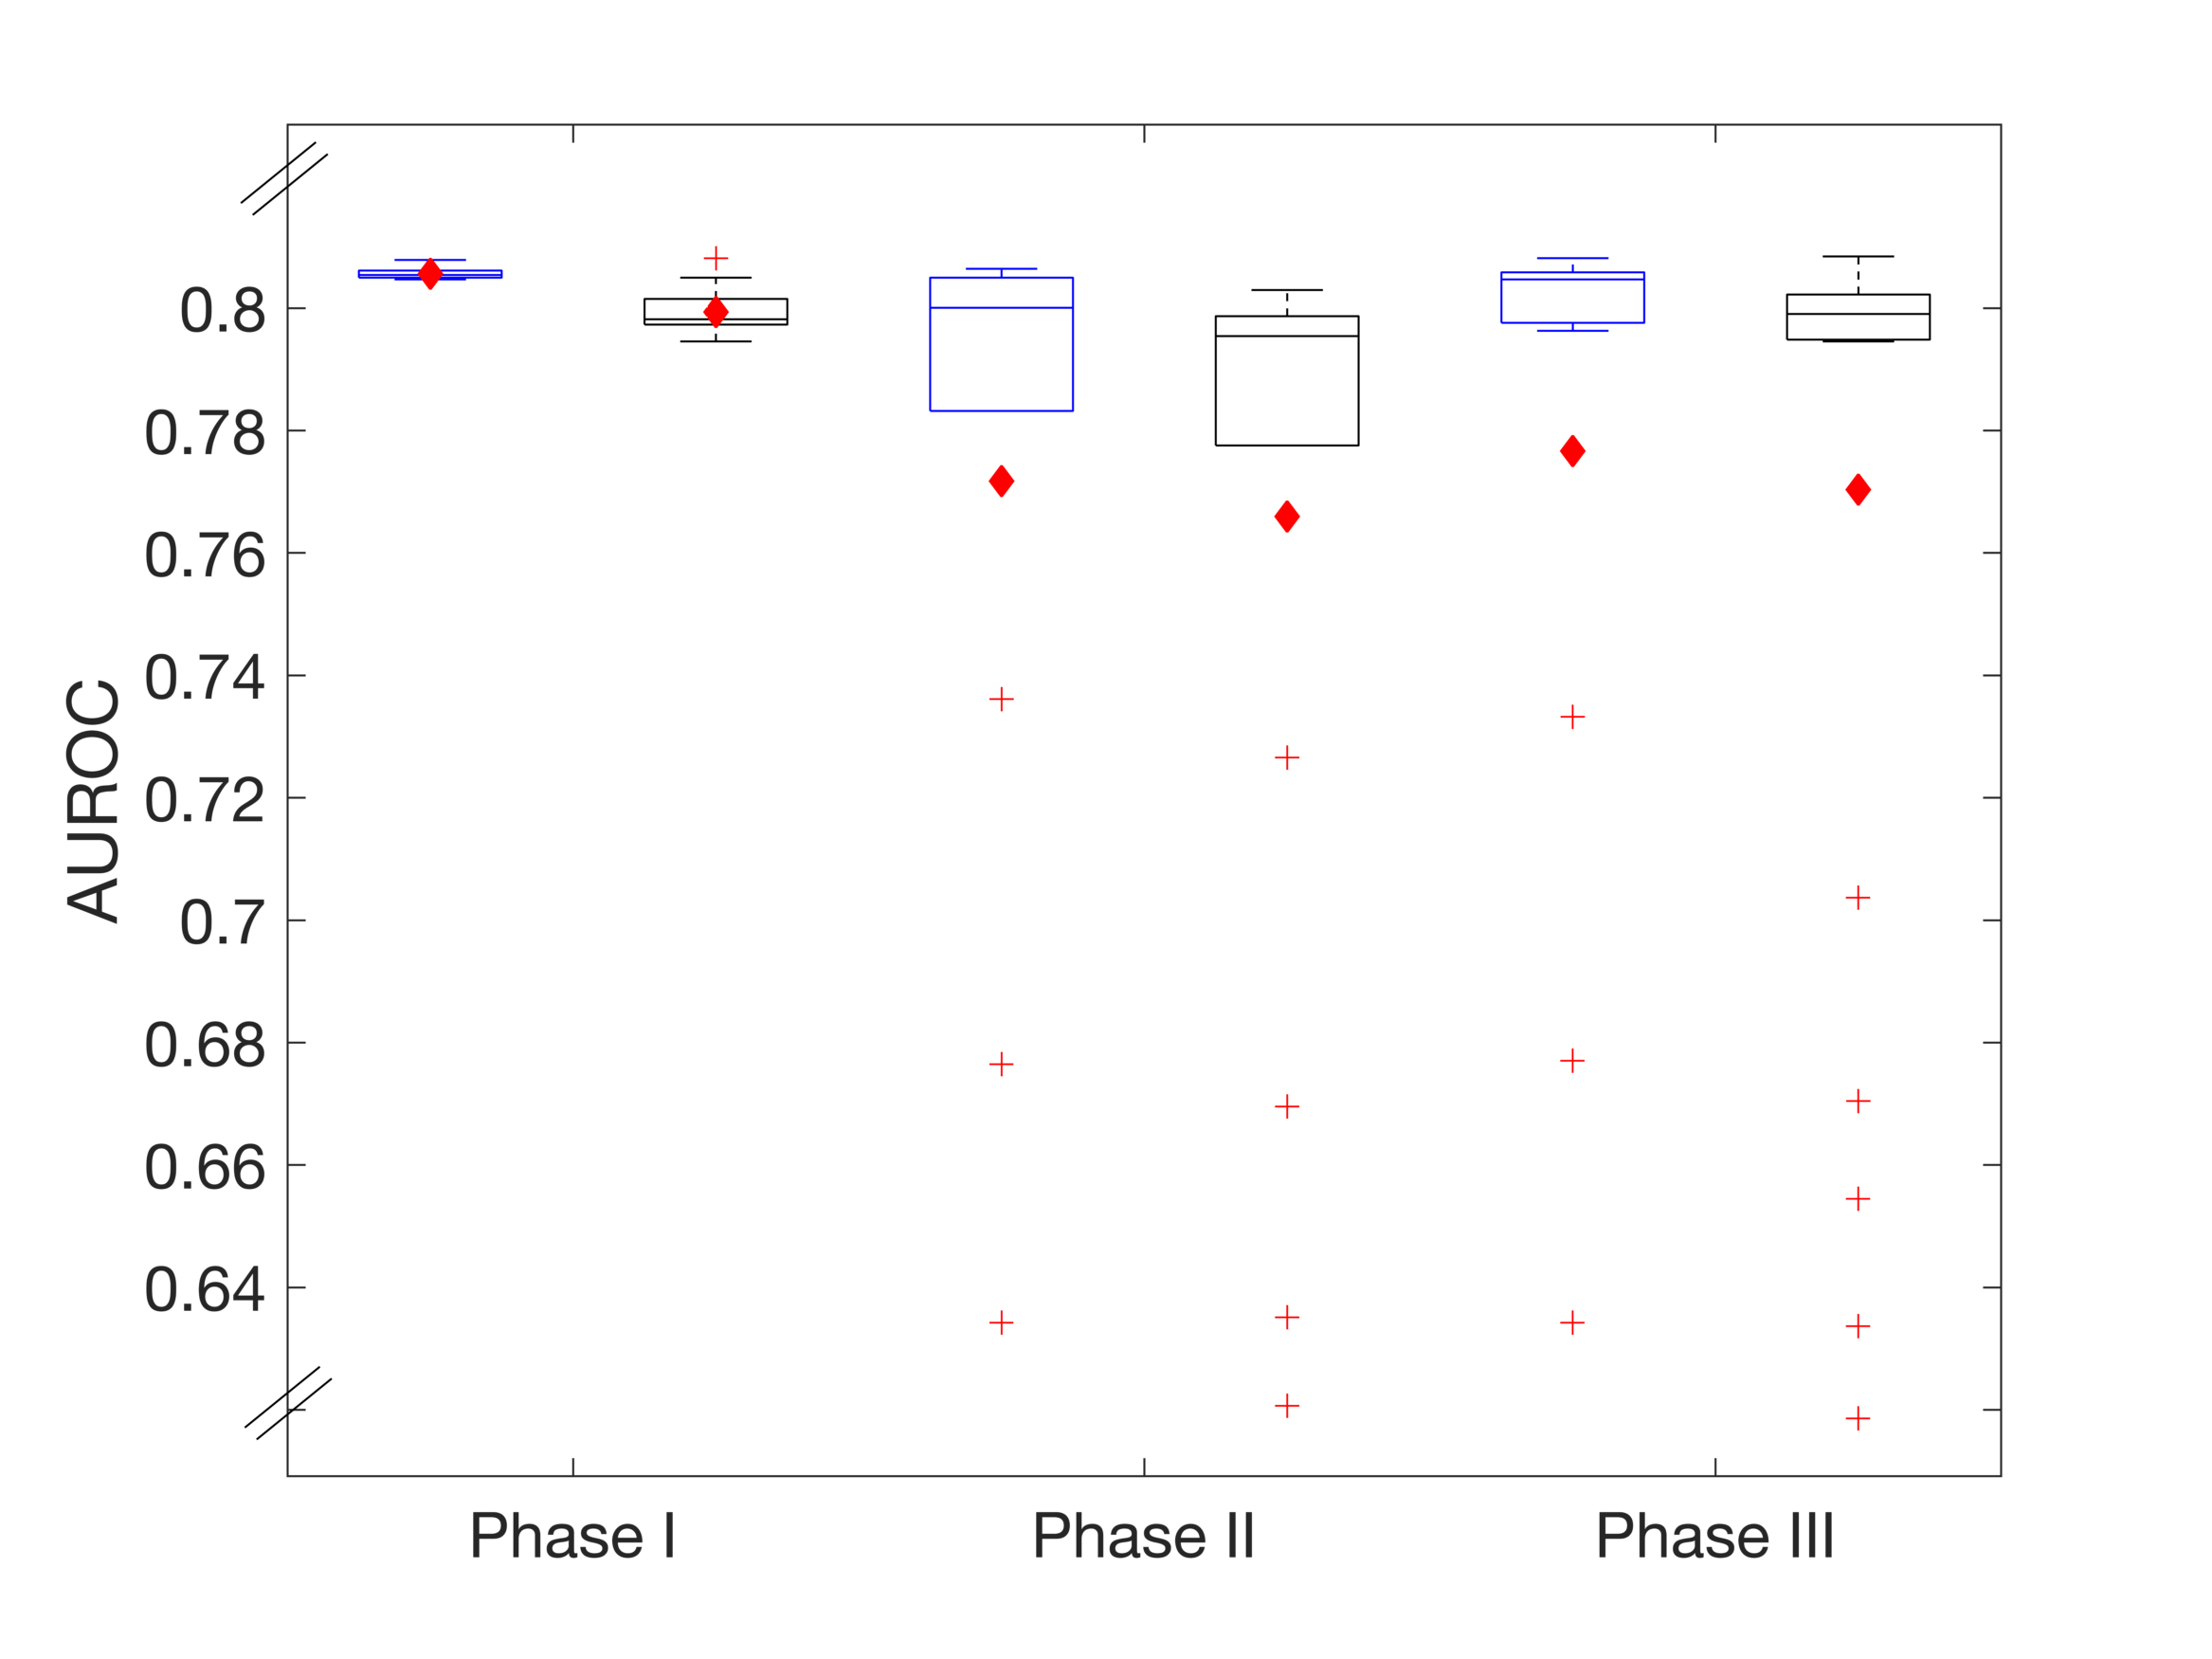
ROC results are summarized in Figures 2 (relative optimal thresholds) and 3 (AUROC). In general, the distribution of all boxplots in both figures increases for the disrupted BBB and when varying software packages are used. For Phase I, similar optimal thresholds (Fig. 2) are found across imaging protocols resulting in a tight distribution of AUROC (Fig. 3). For Phase II and III, a larger range of optimal thresholds are observed (Fig. 2) but the mean AUROC (Fig. 3) only decreases slightly when compared to Phase I. This indicates that although there are varying optimal thresholds, each threshold specific to IP and PM is able to classify tumor grade similarly.
Discussion/Conclusion:
Previous results1 demonstrated that variable IPs and PMs reduce rCBV reproducibility. Results from this study demonstrate that while variable PMs yield a range of optimal thresholds, their clinical performance is similar, highlighting the robustness of rCBV as a biomarker. However, the multi-site threshold heterogeneity underscores the motivation for current standardization efforts, since such heterogeneity would be expected to translate to other clinical performance applications, such as therapy response assessment. In particular, this study highlights that harmonizing PMs and benchmarking software packages are as important as using consistent IPs.Acknowledgements
We received funding from the following sources: NIH/NCI R01CA213158 (LCB, NBS, CCQ), NIH/NCI U01CA207091 (AJM, MCP), NIH/NCI U01CA166104 and P01CA085878 (DM, TLC), and NIH/NCI U01CA142565 (CW, AGS, TEY, NR)References
[1] Bell LC, Semmineh N, An H, et al.: Evaluating Multisite rCBV Consistency from DSC-MRI Imaging Protocols and Postprocessing Software Across the NCI Quantitative Imaging Network Sites Using a Digital Reference Object (DRO). Tomogr (Ann Arbor, Mich) 2019; 5:110–117.
[2] Semmineh NB, Stokes AM, Bell LC, Boxerman JL, Quarles CC. A Population-Based Digital Reference Object (DRO) for Optimizing Dynamic Susceptibility Contrast (DSC)-MRI Methods for Clinical Trials. Tomography 2017;3:41–49.
[3] Schmainda KM, Prah MA, Connelly JM, Rand SD. (2016). Glioma DSC-MRI Perfusion Data with Standard Imaging and ROIs. The Cancer Imaging Archive.
[4] Schmainda KM, Prah MA, Rand SD, et al.: Multisite Concordance of DSC-MRI Analysis for Brain Tumors: Results of a National Cancer Institute Quantitative Imaging Network Collaborative Project. AJNR Am J Neuroradiol 2018; 39:1008–1016.
[5] Semmineh N, Bell L, Stokes A, Hu L, Boxerman J, Quarles C. Optimization of Acquisition and Analysis Methods for Clinical Dynamic Susceptibility Contrast (DSC) MRI Using a Population-based Digital Reference Object. AJNR Am J Neuroradiol 2018.
[6] Boxerman JL, Schmainda KM, Weisskoff RM. Relative cerebral blood volume maps corrected for contrast agent extravasation significantly correlate with glioma tumor grade, whereas uncorrected maps do not. AJNR. Am. J. Neuroradiol. 2006;27:859–67.
[7] Welker K, Boxerman J, Kalnin A, et al. ASFNR recommendations for clinical performance of MR dynamic susceptibility contrast perfusion imaging of the brain. AJNR. Am. J. Neuroradiol. 2015;36:E41-51
Figures