0412
Pharmacokinetic analysis of DCE-MRI in pituitary adenoma: evaluation of tumor consistency and comparison with histological collagen content1Radiology, Kagoshima University Graduate School of Medical and Dental Sciences, Kagoshima, Japan, 2Neurosurgery, Kagoshima University Graduate School of Medical and Dental Sciences, Kagoshima, Japan, 3Clinical Engineering Department Radiation Sectio, Kagoshima University Hospital, Kagoshima, Japan, 4Siemens Healthcare K.K., Tokyo, Japan, 5Siemens Healthcare, Erlangen, Germany
Synopsis
Preoperative information of tumor consistency is important in patients with pituitary adenoma. Our aim was to evaluate the possible role of high-temporal and spatial resolution dynamic contrast enhanced MR imaging (DCE-MRI) and quantitative pharmacokinetic analysis in differentiation of a hard adenoma from soft adenoma. The hard adenoma showed significantly higher extravascular extracellular space per unit volume of tissue (ve) than soft adenoma and the ve was significantly correlated to collagen IV content of pituitary adenomas. This quantitative pharmacokinetic parameter ve may be useful for differentiation of the hard adenoma from soft adenoma.
INTRODUCTION
Preoperative evaluation of tumor consistency is important in patients with pituitary adenoma. Pituitary adenoma consistency was considered to be relevant to collagen content.1 High-temporal resolution dynamic contrast enhanced MR imaging (DCE-MRI) can evaluated volume of the extravascular extracellular space per unit volume of tissue (ve),2 and fibrosis content was positively correlated to ve in pancreatic cancer.3 Our aim was to evaluate the possible role of DCE-MRI in evaluation of tumor consistency in patients with pituitary adenoma. Furthermore, we evaluated the correlation between the ve and collagen IV content of the pituitary adenoma.METHODS
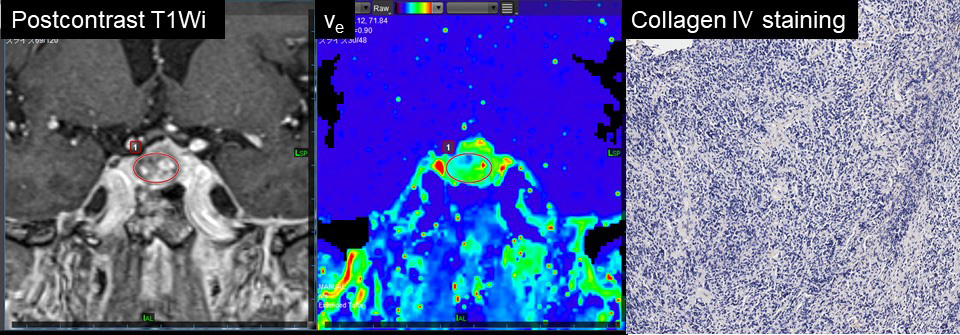
A prospective study was performed using 19 patients with pituitary adenoma (mean age, 57.2 ± 15.8 years). All patients underwent MR imaging with a 3T system (MAGNETOM Prisma; Siemens Healthcare, Erlangen, Germany). A 20-channel head/neck coil was used. Imaging protocol included a coronal prototype compressed sensing volumetric interpolated breath-hold examination (CS VIBE) sequence (TR/TE, 3.9/0.97 ms; in-plane resolution, 1.10 × 0.94 mm reconstructed into 0.9 × 0.9 mm; slice thickness, 0.9 mm; 48 slices; FOV, 180 mm; flip angle, 10.0°; bandwidth, 640 Hz/pixel; image matrix, 145 × 192; CS factor, 7; temporal resolution, 5.0 seconds; acquisition time, 200 seconds). Images were sent to the PACS and analyzed by using the software Vitrea (Canon Medical Systems Co.,Tochigi, Japan) to obtain volume of ve (Fig 1).2 Pituitary adenomas were classified into 2 groups according to the intraoperative findings: tumors with soft consistency and hard consistency. Region of interest measurements were performed in pituitary adenoma and normal white matter. We also evaluated ADC value and signal intensity ratios on T1-weighted images (rT1) and T2-weighted images (rT2). We compared ve, ADC, rT1 and rT2 between soft adenoma and hard adenoma using Mann-Whitney U test. In addition, the diagnostic performances of the parameters were compared using receiver operating characteristic (ROC) curve analysis. Furthermore, we evaluated the correlation between the ve and collagen IV content of the pituitary adenoma using Pearson correlation coefficient.RESULTS
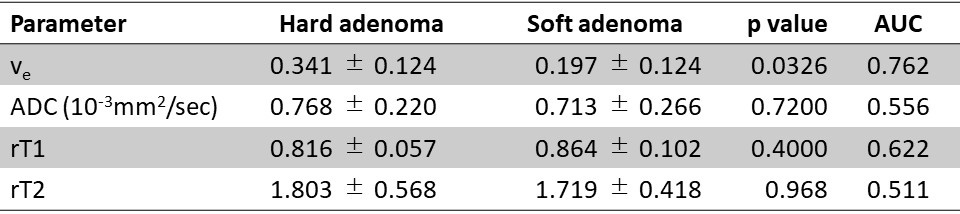
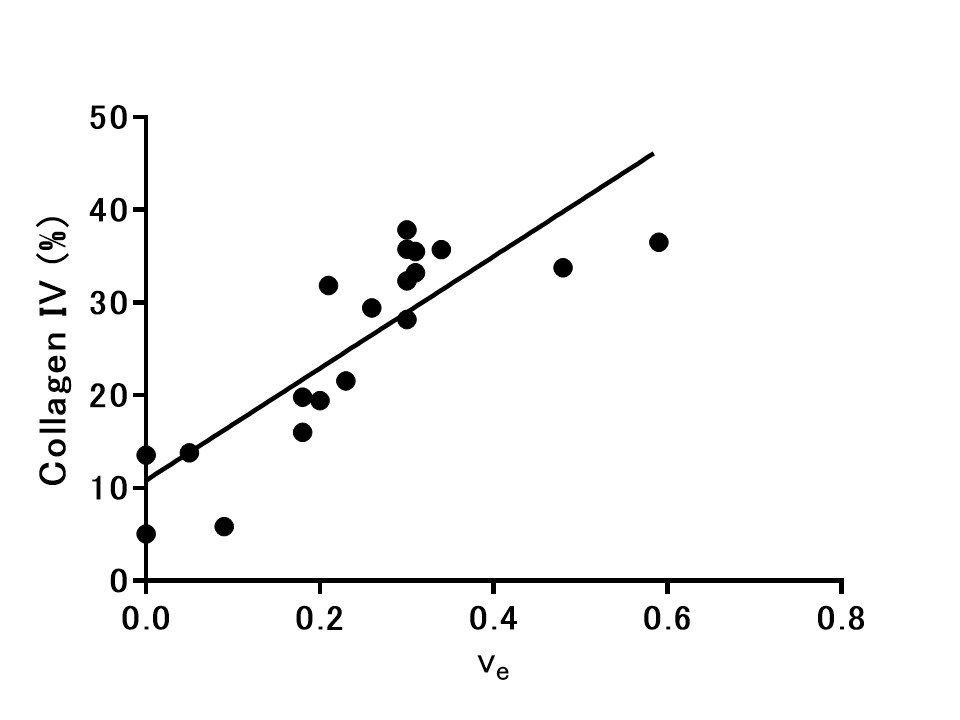
The hard adenoma showed significantly higher ve (0.341±0.124 vs. 0.197±0.124, p=0.0326) than soft adenoma, whereas no significant difference was found in ADC (10-3mm2/sec) (0.768±0.220 vs. 0.713±0.266, p=0.720), rT1 (0.816±0.057 vs. 0.864±0.102, p=0.400), or rT2 (1.80±0.57 vs. 1.72±0.42, p=0.968). The ROC curve analysis showed significance for ve (AUC=0.762, significance level p = 0.0256), and no significance for ADC, rT1 and rT2 (AUC=0.556, 0.622, 0.511, significance level p = 0.6957, 0.3851, 0.9395; respectively) (Fig 2). The collagen IV content of pituitary adenoma ranged from 5.08 to 61.57%. Pearson correlation coefficient analysis revealed a strong positive correlation between the ve and collagen IV content (r = 0.836, P < 0.0001) (Fig 3).DISCUSSION
The current study exploited the potential of the prototype CS VIBE sequence in evaluating the pituitary adenoma with a high spatial (0.9 mm isotropic) and temporal (5.0 seconds) resolution, allowing for the quantitative pharmacokinetic analysis. The hard adenoma showed significantly higher ve than the soft adenoma. Thus, this technique may be useful to predict the consistency of pituitary adenoma preoperatively. Our result of the significant positive correlation between the ve and collagen IV content of the pituitary adenoma is consistent with a previously reported significant positive correlation between collagen content and ve in pancreatic cancer.3 Collagen content was considered to be causally related to consistency of a pituitary adenoma.1 Thus, it is conceivable that higher ve in hard adenoma reflects higher collagen content.CONCLUSION
The hard adenoma showed significantly higher ve than soft adenoma. The ve of pituitary adenoma correlated to the collagen IV content. The ve derived from DCE-MRI can provide information about the consistency of pituitary adenomas.Acknowledgements
The authors would like to thank Tomoko Takajo (technical assistant) who helped with immunohistochemical staining for collagen IV to obtain collagen content of pituitary adenomas and the staff of Kagoshima University Hospital for their support.References
1. Yamamoto J, Kakeda S, Shimajiri S, et al. Tumor consistency of pituitary macroadenomas: predictive analysis on the basis of imaging features with contrast-enhanced 3D FIESTA at 3T. AJNR Am J Neuroradiol. 2014;35(2):297-303.
2. Tofts PS, Brix G, Buckley DL, et al. Estimating kinetic parameters from dynamic contrast-enhanced T(1)-weighted MRI of a diffusable tracer: standardized quantities and symbols. Journal of Magnetic Resonance Imaging. 1999;10(3):223–232.
3. Ma W, Li N, Zhao W, et al. Apparent Diffusion Coefficient and Dynamic Contrast-Enhanced Magnetic Resonance Imaging in Pancreatic Cancer: Characteristics and Correlation With Histopathologic Parameters. J Comput Assist Tomogr. 2016;40(5):709-16.
Figures