0408
Stereotactic tissue sampling and T1-, T2-relaxometry compared with ADC for tissue cell density quantification in gliomas imaging1Osaka University Graduate School of Medicine, Suita, Japan, 2Osaka International Cancer Institute, Osaka, Japan, 3Canon Medical Systems Corporation, Tochigi, Japan, 4National Hospital Organization Osaka National Hospital, Osaka, Japan
Synopsis
The authors attempted to elucidate the correlation of tumor cell density within the brain in glioma patients and T1-, T2-relaxometry and ADC. First, an exploratory study compared T1-, T2-relaxometry, and ADC with 11C-methionine PET followed by a validation study using intraoperative stereo-tactically obtained tissues. A range of T1 values indicative of high cell density was identified, which finding was confirmed by stereotactic tissue sampling. For T2 values and ADC, however, no statistically significant correlation was confirmed regarding tumor cell density. The proposed technique was further able to create predictive tumor cell density map by T1 supplemented by T2 values.
PURPOSE
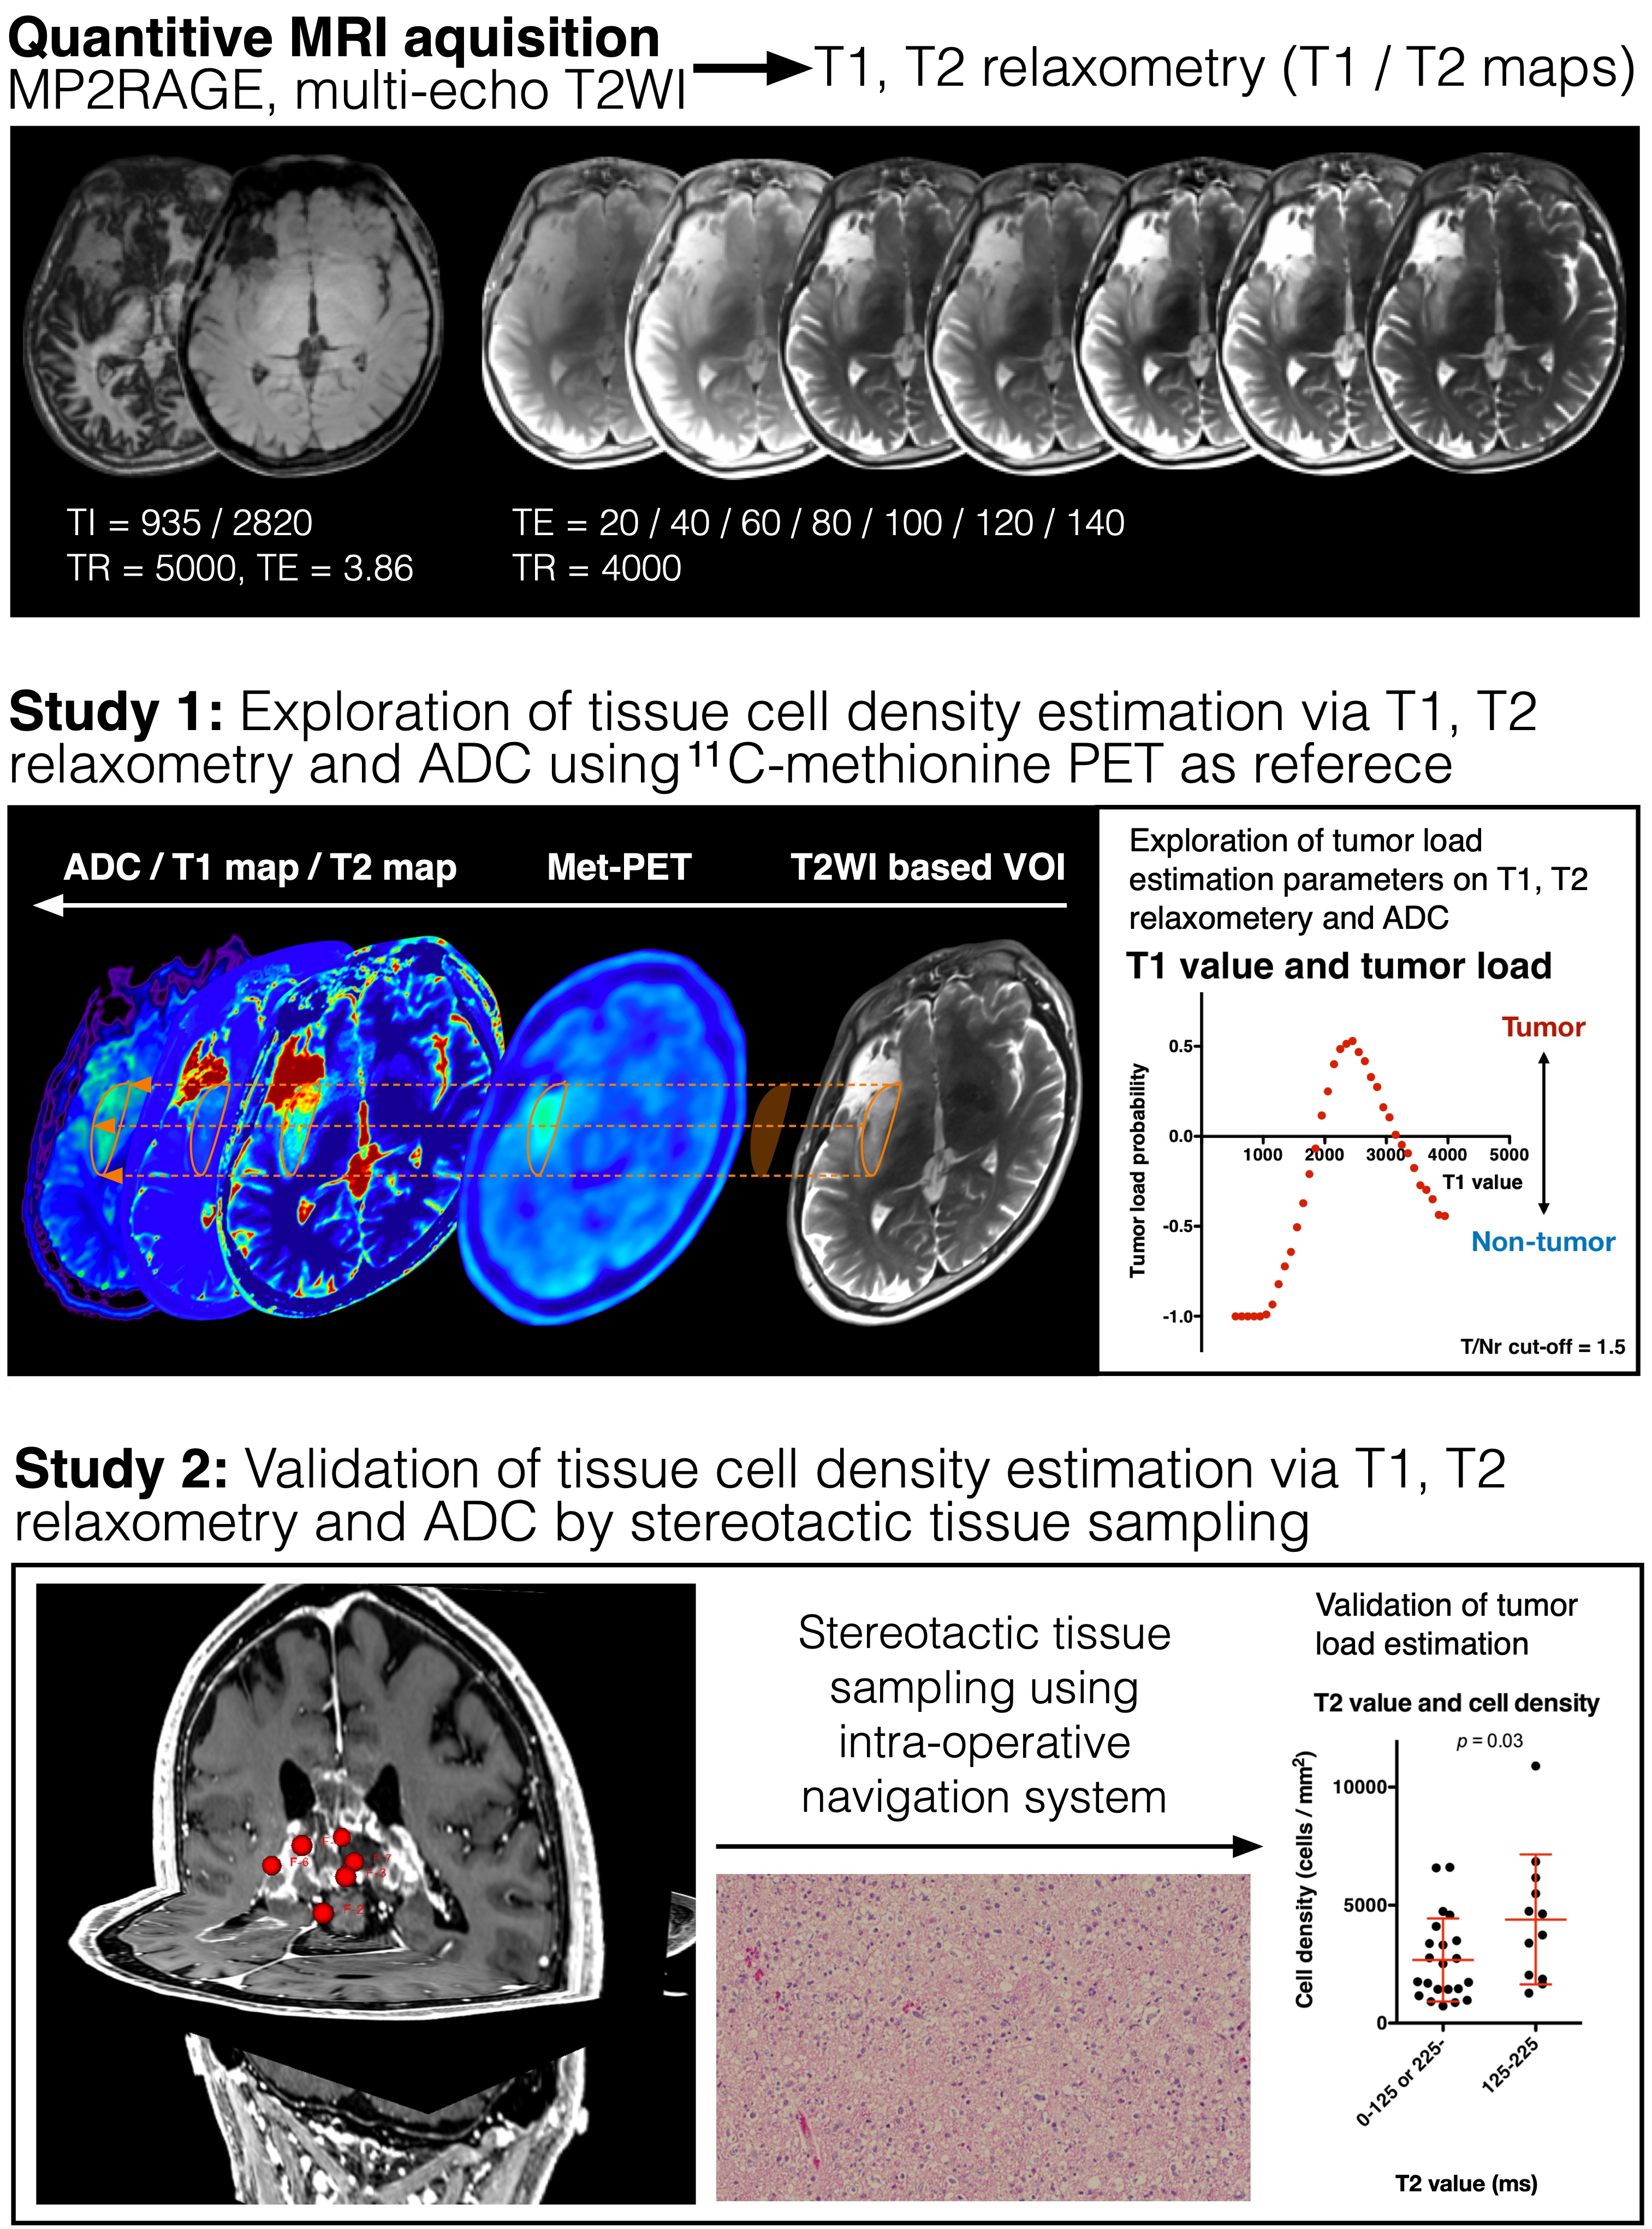
Visualization of tumor load into the brain tissue is a crucial process in glioma treatment. It has been suggested, however, that conventional T1-, T2-weighted and contrast-enhanced MRI is insufficient to obtain this information and metabolic imaging, such as amino acid PET, is desired to complete pre-treatment imaging study. It should also be noted, however, that these kinds of imaging are not easily accessible world-wide, and a more practical technique should be developed to (semi-) quantitatively visualize tissue tumor load in glioma patients. In this study, the authors attempted to achieve this objective using T1-, T2-relaxometry mapping in glioma patients. The authors further compared T1-, T2-relaxometry with ADC regarding their capability to predict tumor cell density. The study was conducted in two stages, first, as an exploratory study comparing T1-, T2-relaxometry, ADC with 11C-methionine PET and second as a validation study using intraoperative stereo-tactically obtained tissues (Figure 1). The developed technique was also challenged to visualize tissue cell density by T1-, T2-relaxometry.METHODS
Cohort for Study 1: Ten patients harboring gliomas (Low-grade glioma 6, High-grade glioma 4) were included. T1-, T2-relaxometry, ADC and 11C-methionine PET were available in all 10 cases.Cohort for Study 2: 81 stereotactically sampled tissues were obtained from five Low-grade and 16 High-grade glioma patients.
T1 and T2 relaxometry: MP2RAGE and multi-echo T2-weighted images were acquired using either a 3T (MAGNETOM Prisma, Siemens) or 1.5T (MAGNETOM Aera, Siemens) (Figure 1). These images were converted into T1-, T2-relaxometry using Olea Sphere, Olea Nova+ (Canon Medical Systems). A correction factor between 1.5 and 3T data was obtained using a normal volunteer brain scan data.
ADC measurement: ADC map was reconstructed by diffusion-weighted images with MPG applied in 64 directions with a b-value of 1000.
Lesion segmentation for Study 1: Lesion segmentation for analysis was handcrafted in 3D including the entire T2WI abnormal area. Defined lesion was then segmented into either area with high methionine uptake (tumor/normal ratio >1.5, assigned as Met-PET high) or low uptake (≤ 1.5, assigned as Met-PET low), which cut-off is considered reasonable in previous studies 1.
Tissue cell density measurement and image/tissue co-registration: The number of cells was counted on Hematoxylin Eosin staining. The locations of tissue sampling were identified on T1-, T2-relaxometry and ADC maps using the Dicom coordinates store in the navigation system which was created at the time of stereotactic tissue sampling. No manual adjustment was performed ensuring objectiveness of study.
Tumor load imaging via T1-, T2-relaxometry: Estimation of high probable cell density tissue was calculated from the data obtained in study 1, combining both data obtained by T1-, T2-relaxometry.
RESULTS
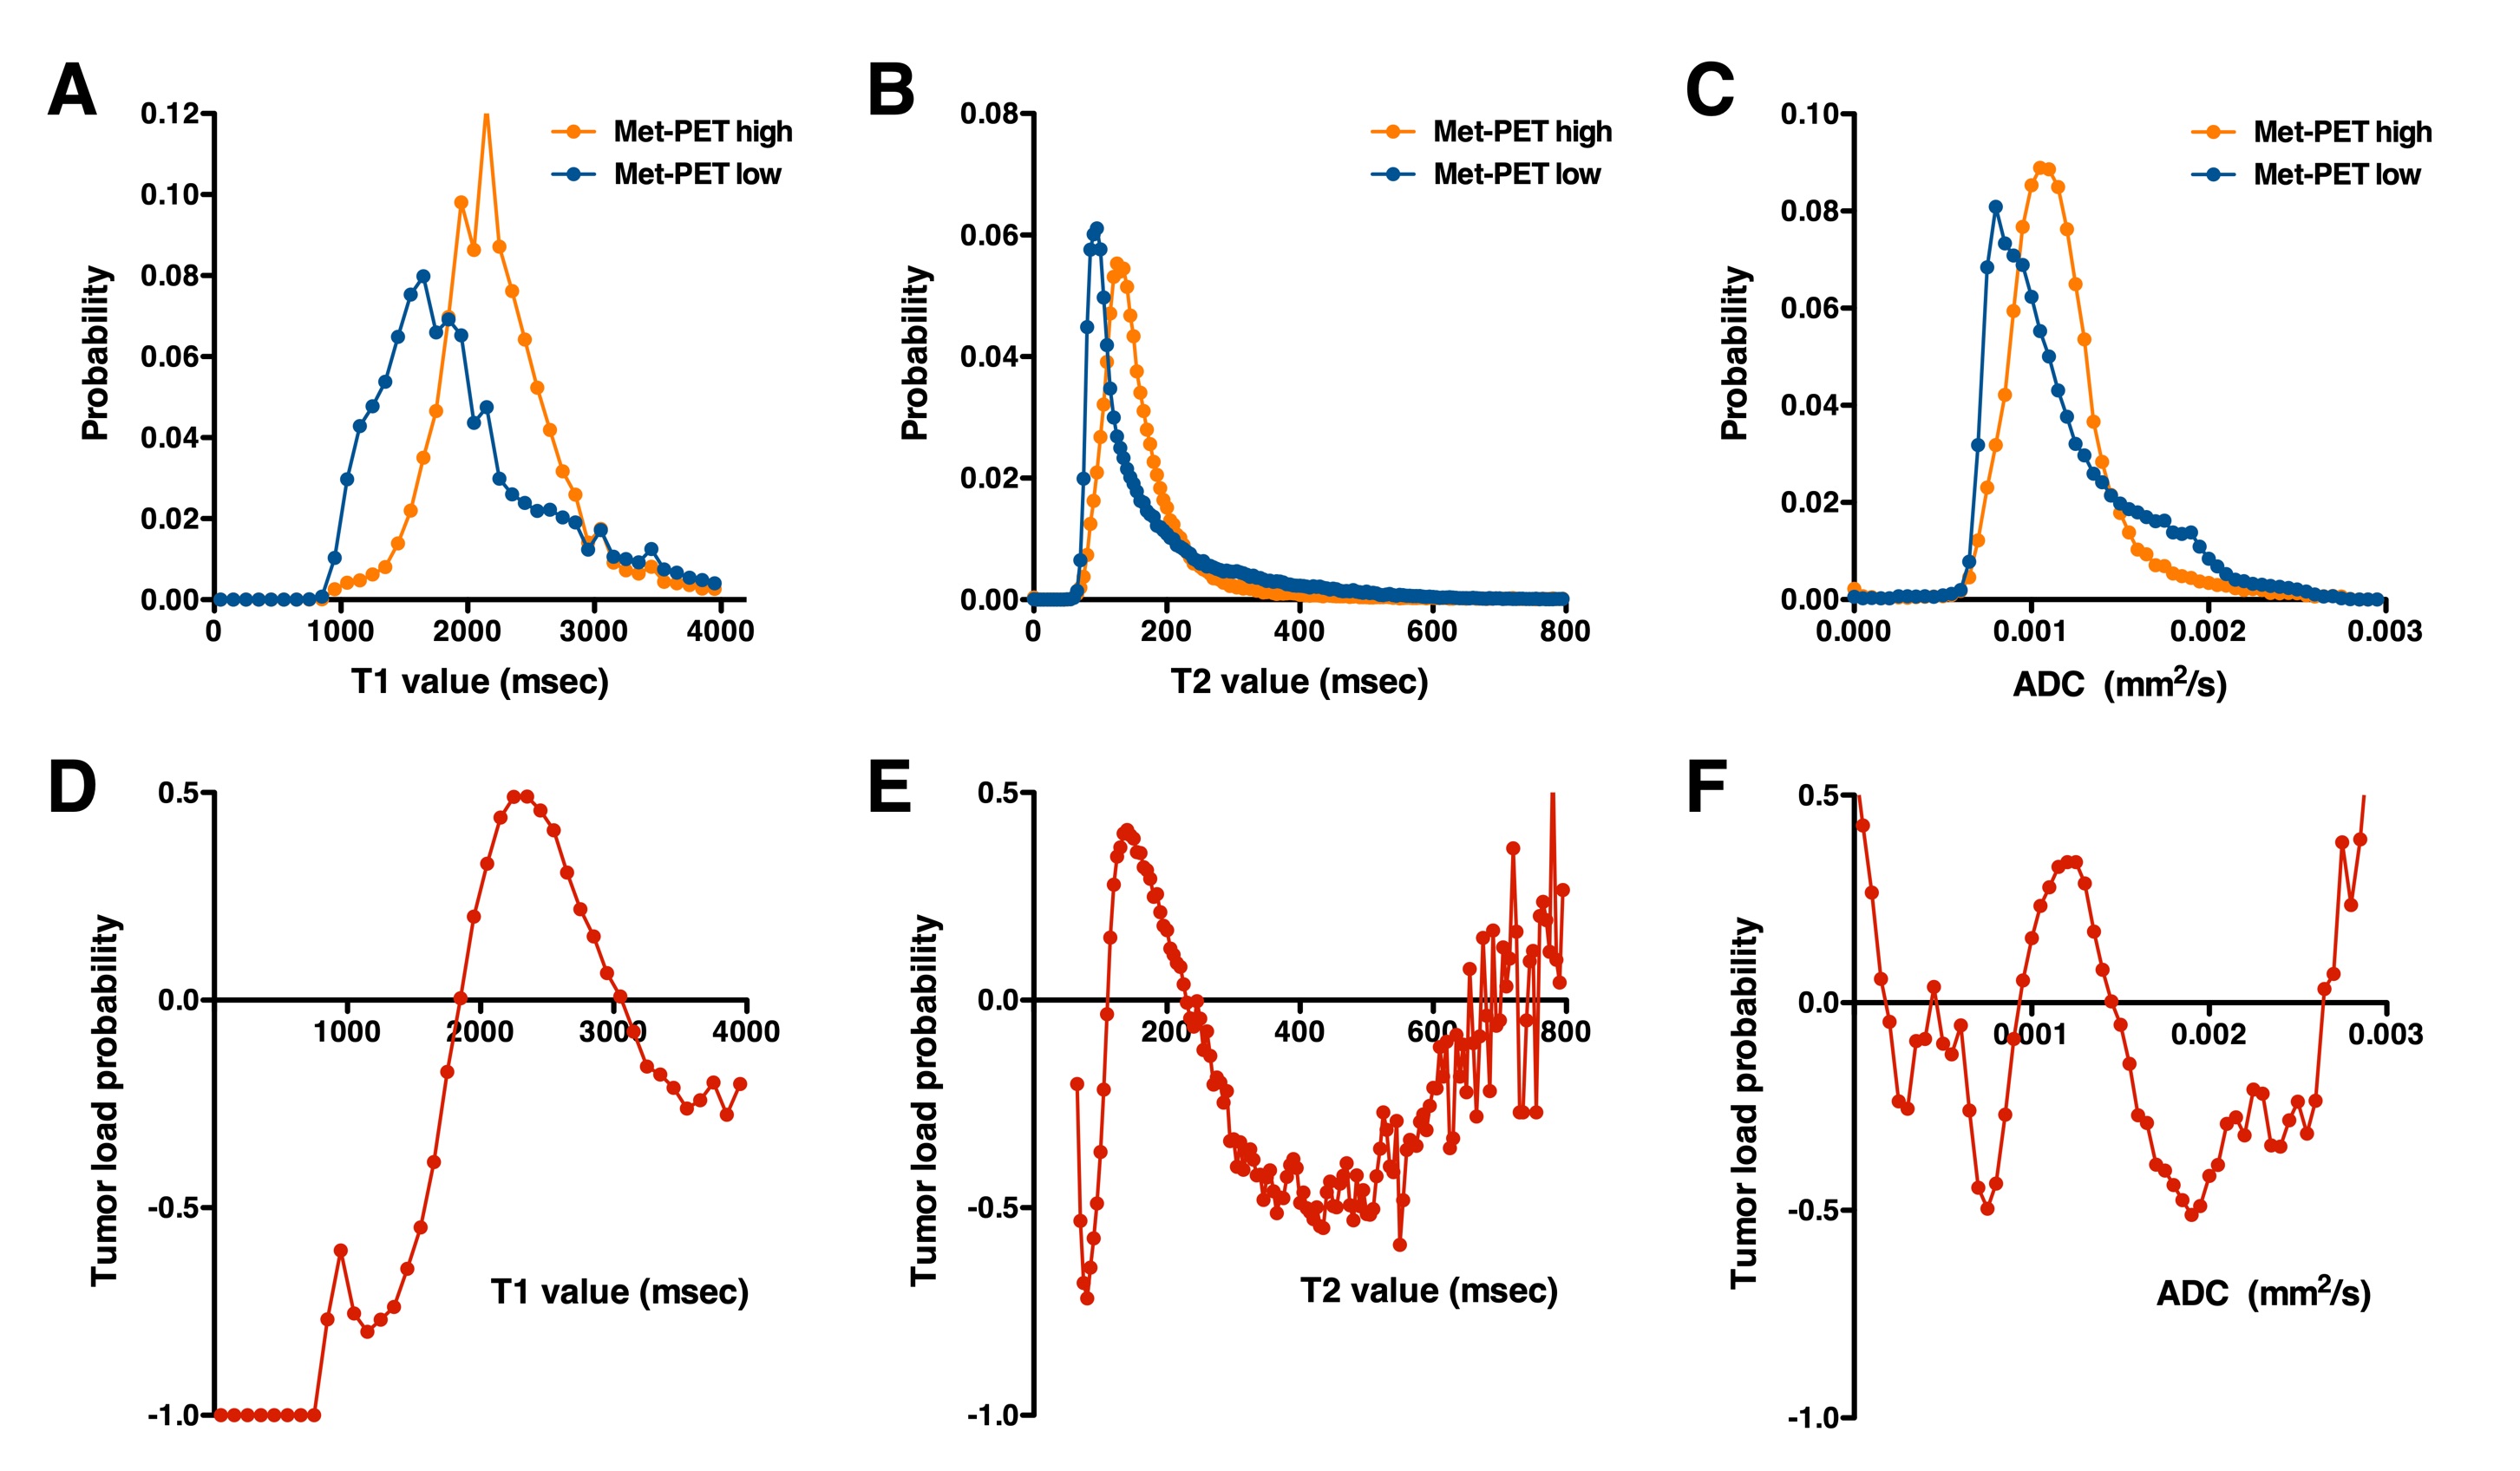
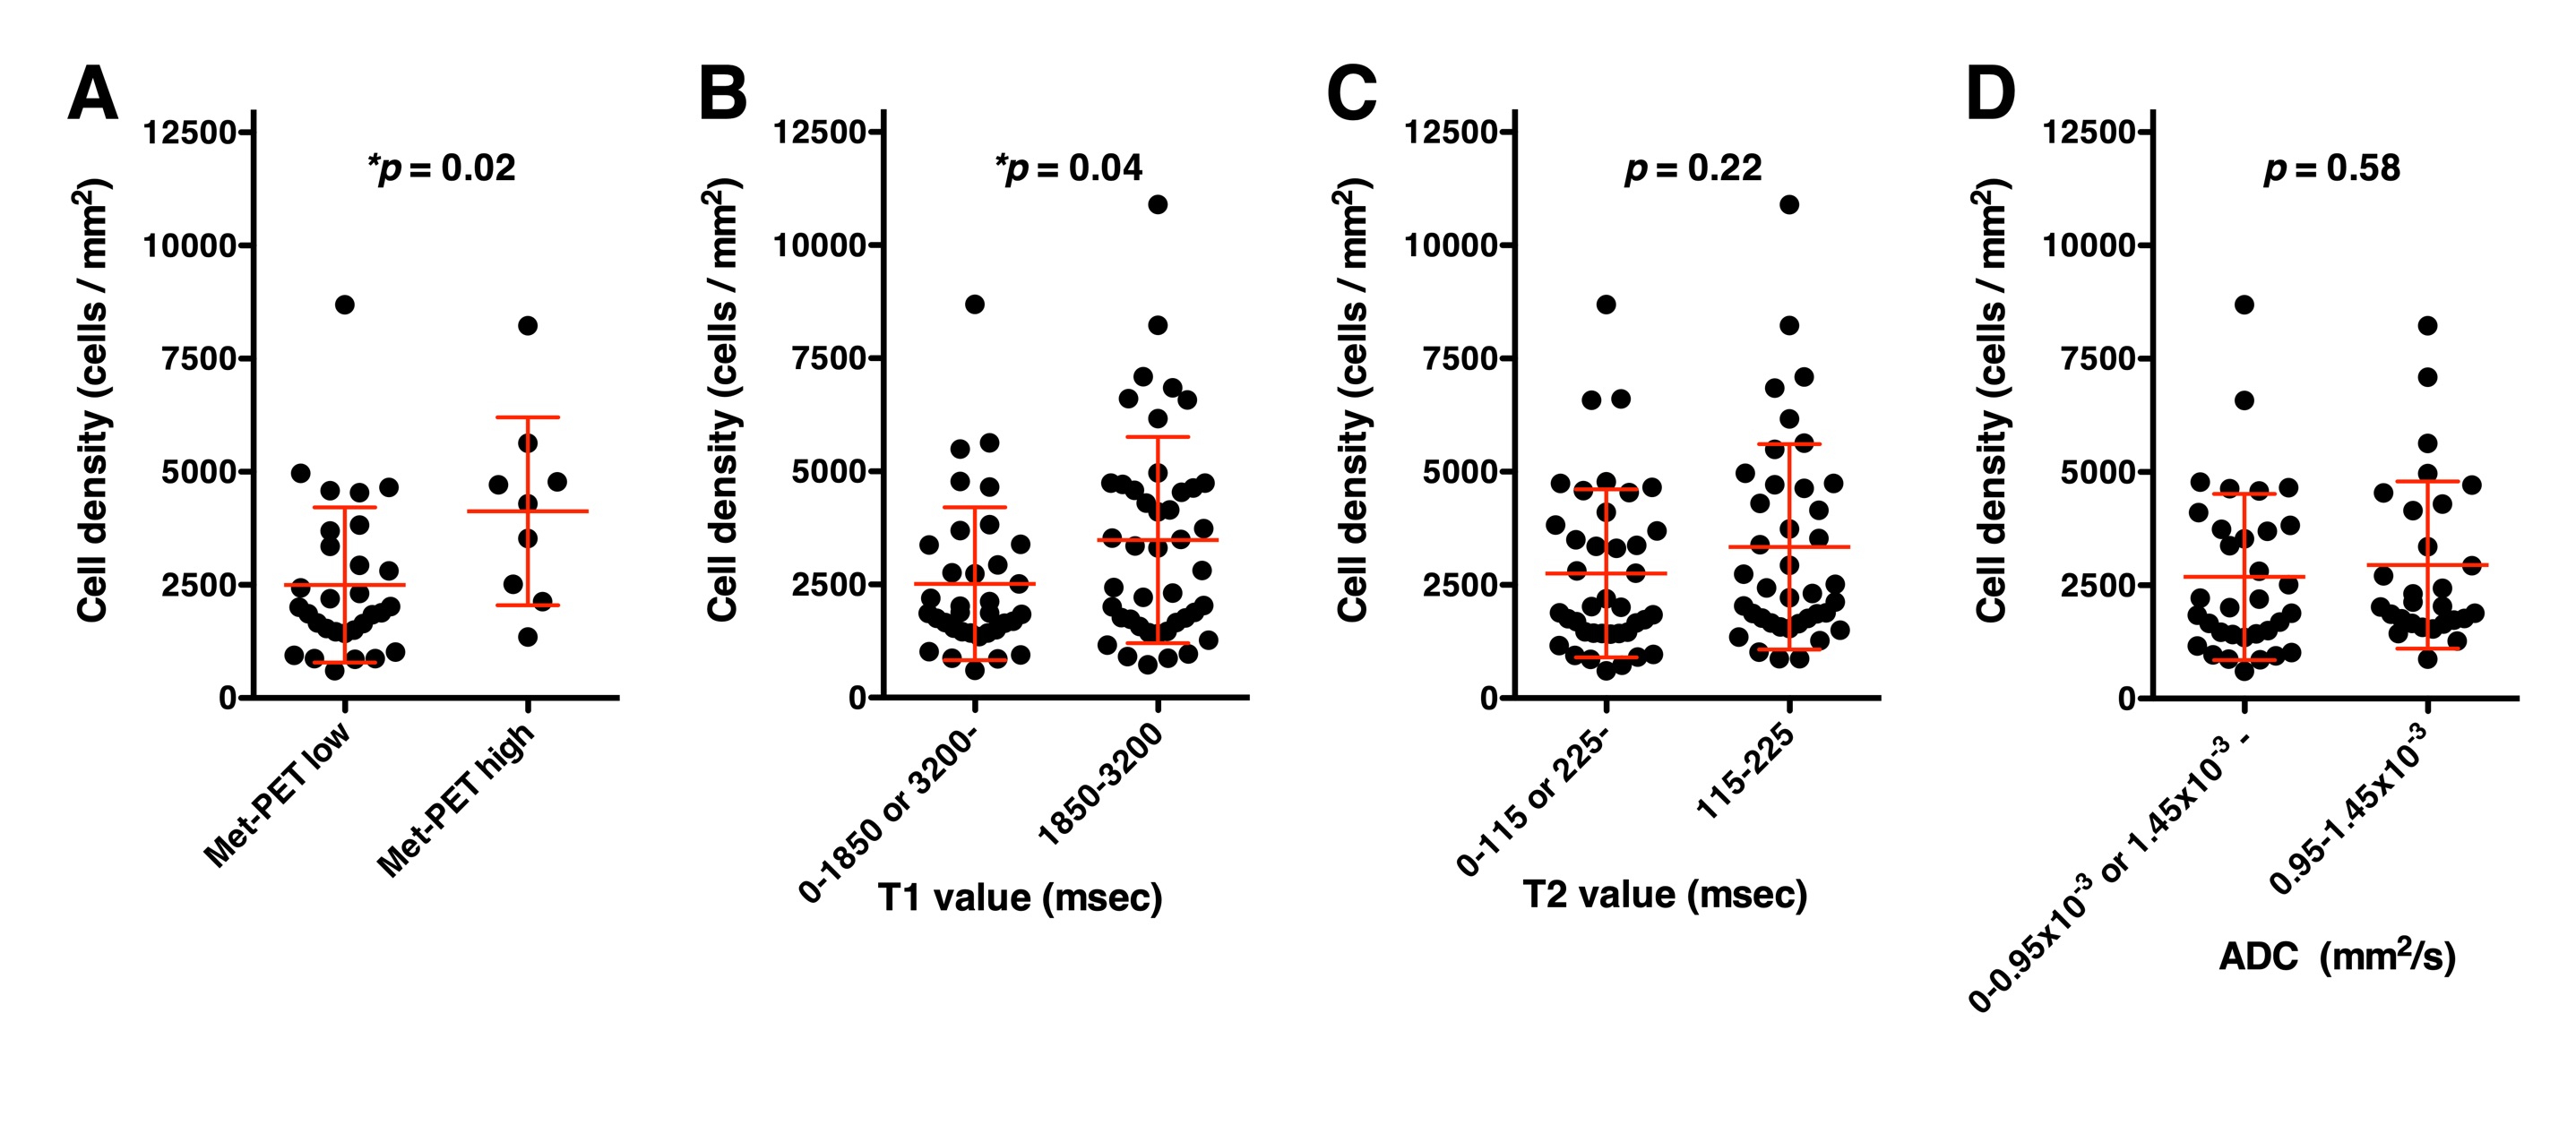
Exploration study (Study 1): As in Figure 2, Met-PET high and low segments were well separated in both T1-, T2-relaxometry. T1-relaxation time between 1850 and 3200 msec (in 3T) was indicative of Met-PET high, which can be interpreted as high cell density area. Similarly, T2-relaxation time between 115 and 225 msec (in 3T) was indicative of Met-PET high area. Met-PET high probability was highest at 2500 msec in T1 and 180 msec in T2 relaxometry (Figure 2D, E). On the other hand, ADC was unable to reliably discriminate the two (Figure 2F).Validation study (Study 2): Tissue obtained from above mentioned predictive high cell density area in T1-relaxometry showed statistically significantly higher tissue cell density than tissues obtained from predictive low cell density area (Figure 3B). This robust correlation was not confirmed in T2-relaxometry and ADC.
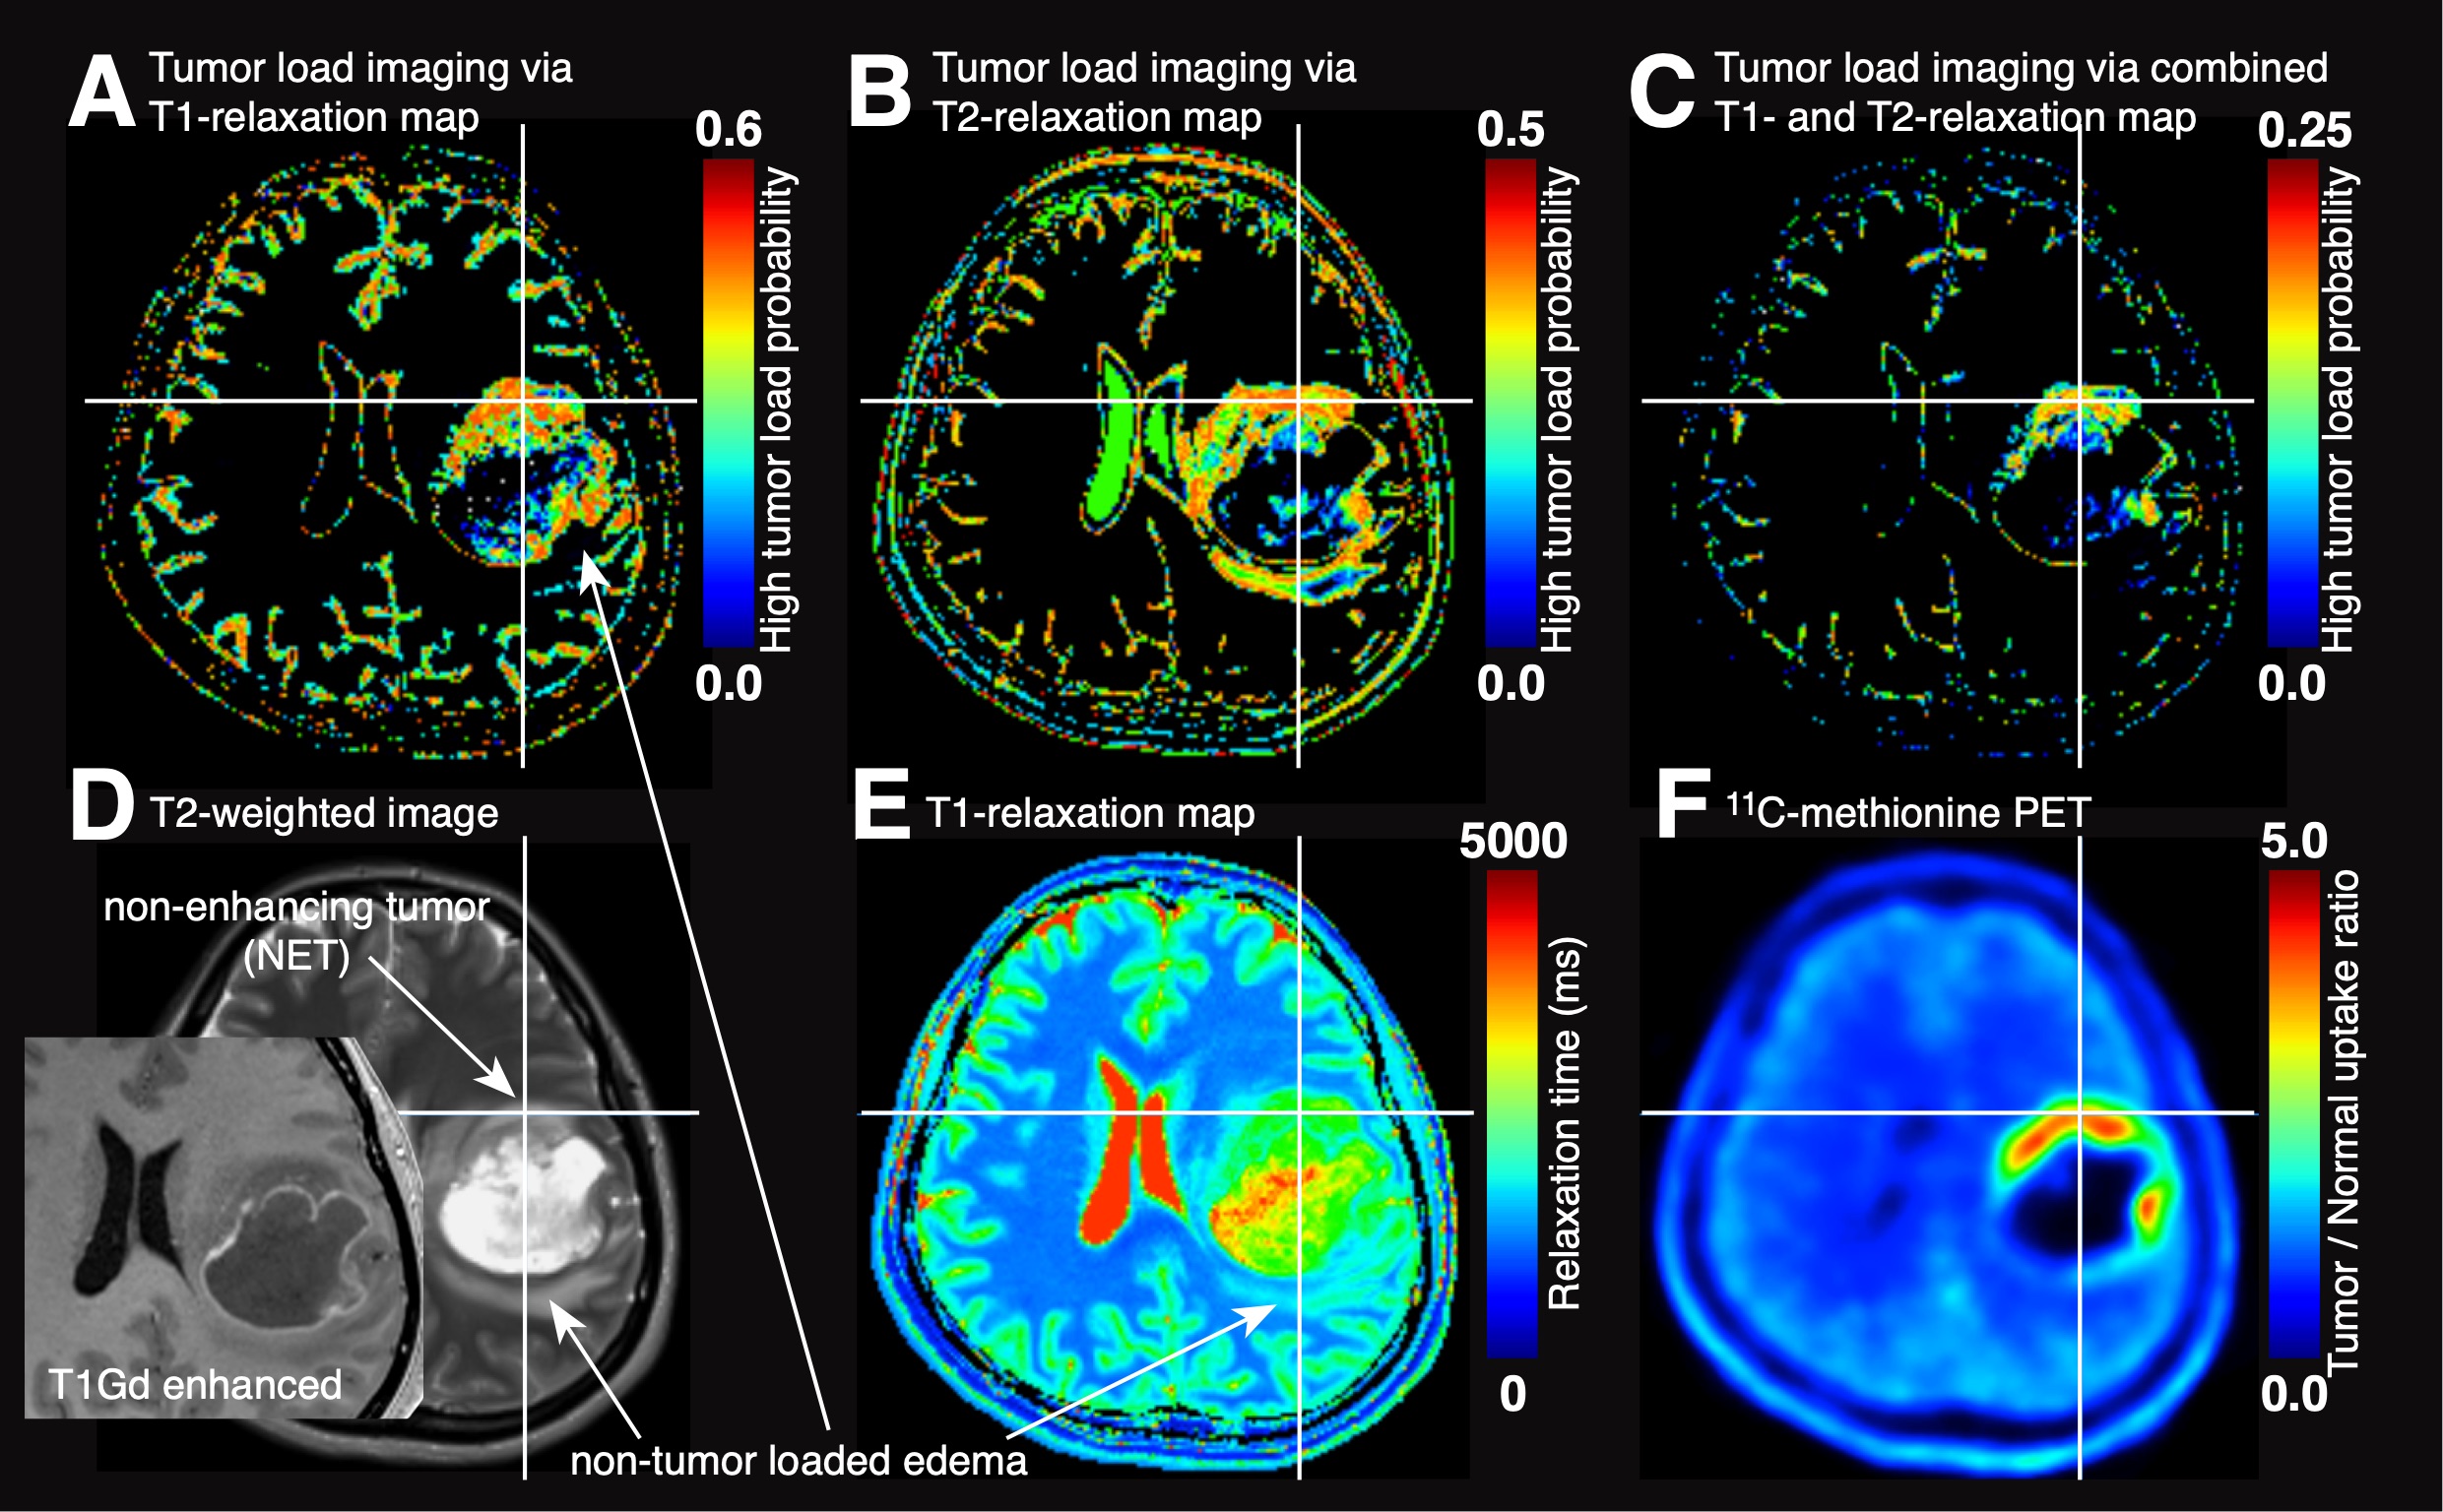
Cell density imaging via T1-relaxometry: Predictive cell density imaging based on T1-relaxometry showed reasonable correlation with 11C-methionine PET as can be seen in Figure 4A. It should be noted that two types of T2 hyper-intense lesions were recognized; i.e. that with high methionine uptake along with predicted high cell density via T1-relaxometry and the other with low methionine uptake along with predicted low cell density (Figure 4D).
DISCUSSION
This investigation tested the hypothesis that T1- and T2-relaxometry can be used as image surrogates to predict tissue tumor load in glioma imaging. This hypothesis was founded on the assumption that T1- and T2-relaxation time inhabit information on the tissue microarchitecture(s) in glioma. In fact, previous reports did suggest that T2-relaxation time between 125 and 250 msec can be suggested as areas of non-enhancing tumor lesions 2. Although the current study was able to confirm this trend, it was noted that T1-relaxation time was more robust than that of T2 as image surrogate for tumor cell density in glioma. Finally, ADC was not supported to correlate well with tissue microarchitecture in glioma.Acknowledgements
This research was supported by JSPS, Kakenhi and the Uehara Memorial FoundationReferences
1. Kinoshita M, Arita H, Okita Y, et al. Comparison of diffusion tensor imaging and 11C-methionine positron emission tomography for reliable prediction of tumor cell density in gliomas. J Neurosurg. 2016;125(5):1136-1142.
2. Ellingson BM, Lai A, Nguyen HN, Nghiemphu PL, Pope WB, Cloughesy TF. Quantification of Nonenhancing Tumor Burden in Gliomas Using Effective T2 Maps Derived from Dual-Echo Turbo Spin-Echo MRI. Clin Cancer Res. 2015;21(19):4373-4383.
Figures