0407
Long‑Term Monitoring of Brain Tumors Using MR Metabolic Phenotyping1Radiology, Brigham and Women's Hospital, Boston, MA, United States, 2Radiology, University of Texas Southwestern Medical Center, Dallas, TX, United States
Synopsis
This work introduces the concept of MR metabolic phenotyping (MRMP), a method that combines the high-resolution anatomical context of MRI and the highly specific metabolic information of MR spectroscopic imaging via unsupervised learning. The value of this technique was shown for the long‑term follow up of IDH‑mutated low‑grade gliomas where high sensitivity to changes in the metabolic composition of the major tissue compartments was achieved.
Introduction
MR Imaging is a powerful technique for the diagnosis, treatment planning and progression monitoring of brain tumors. Complementarily, MR Spectroscopy (MRS) and Spectroscopic Imaging (MRSI) measure the chemical composition of tissues non-invasively, providing metabolic markers that characterize the phenotype of healthy brain tissue and different types of tumor tissue. In the case of brain tumors, MRS and MRSI have been used to measure 2-hydroxy-glutarate (2HG) noninvasively1,2,3, an oncometabolite of gliomas with isocitrate dehydrogenase (IDH) mutations, which are typically low-grade tumors with good‑prognosis. Due to the relatively long survival of these patients, precise personalized monitoring is crucial to inform important clinical decisions, such as surgical planning, selection of treatment approach and evaluation of treatment response, which will impact the overall survival and quality of life for these patients. In clinical practice, MRI scans are performed periodically to monitor these cases. Increases in tumor volume or contrast enhancement are indications of tumor recurrence, which would then lead to changes in patient care. However, metabolic changes as measured by MRS could provide a more accurate prognosis, such as in pseudoprogression, and may also precede volumetric changes. This work introduces the concept of metabolic phenotyping (MP), a highly‑personalized method sensitive to metabolic changes in brain tissues. High-resolution anatomical context is obtained from MRI while the tissue metabolic information is extracted from MR spectroscopic imaging via unsupervised learning. This method uses a collection of over 50,000 tissue samples obtained from MRSI scans acquired at different resolutions and unsupervised machine learning to identify the normative ranges, tissue class probability and metabolic composition at voxel resolution. Moreover, the relevant metabolic information is effectively presented to complement the conventional imaging that allows for the identification of patient-specific progression of the disease and inform clinical decisions.Methods
Data collection: 52,400 voxels in 277 MRSI scans of 78 different subjects (70 glioma patients, 8 healthy subjects), were analyzed to identify the major tissue classes in which healthy and tumor brain tissue could be classified. All MRSI scans were acquired at 3T (Siemens Skyra, Erlangen, Germany) using PRESS localization, TE/TR=97/2000ms, a 2D 16x16 matrix, and a 10x10x15 mm3 (1.5 mL) voxel size. Three averages were acquired at increasing resolutions using weighted k-space sampling. For the long‑term progression monitoring using MRMP, a subset of 19 patients with at least 3 sequential MRI/MRSI scans was selected (Fig.-1).Data Processing and Quantification: MRSI scans were reconstructed using OpenMRS Lab4 and quantified using LCModel5. Individual k‑space averages were reconstructed as independent measurements for data augmentation. The quantified metabolite ratios to total creatine (tCr) were used, selecting only spectra with an SNR>3 and a creatine CRLB<20. Normative ranges for the most relevant creatine ratios were defined using the middle 95 percentile in the case of normally‑distributed metabolites and the left 95‑percentile for the right-skewed distributed metabolites (Fig.-2).
Unsupervised Clustering of Metabolic Phenotypes: All voxel samples were classified into 2, 3 and 4 different tissue classes using unsupervised k‑medoids algorithm6. The metabolite ratios used for the clustering were chosen from relevant tissue signatures of healthy brain tissue and tumor tissue, these included: N-acetyl-aspartate (tNAA). total choline (tCho), lactate (Lac), glutamate+glutamine (Glx) and the ratio of 2HG+glutamine over glutamate ((2HG+Gln)/Glu) known to be robust to false positive detection of 2HG7.
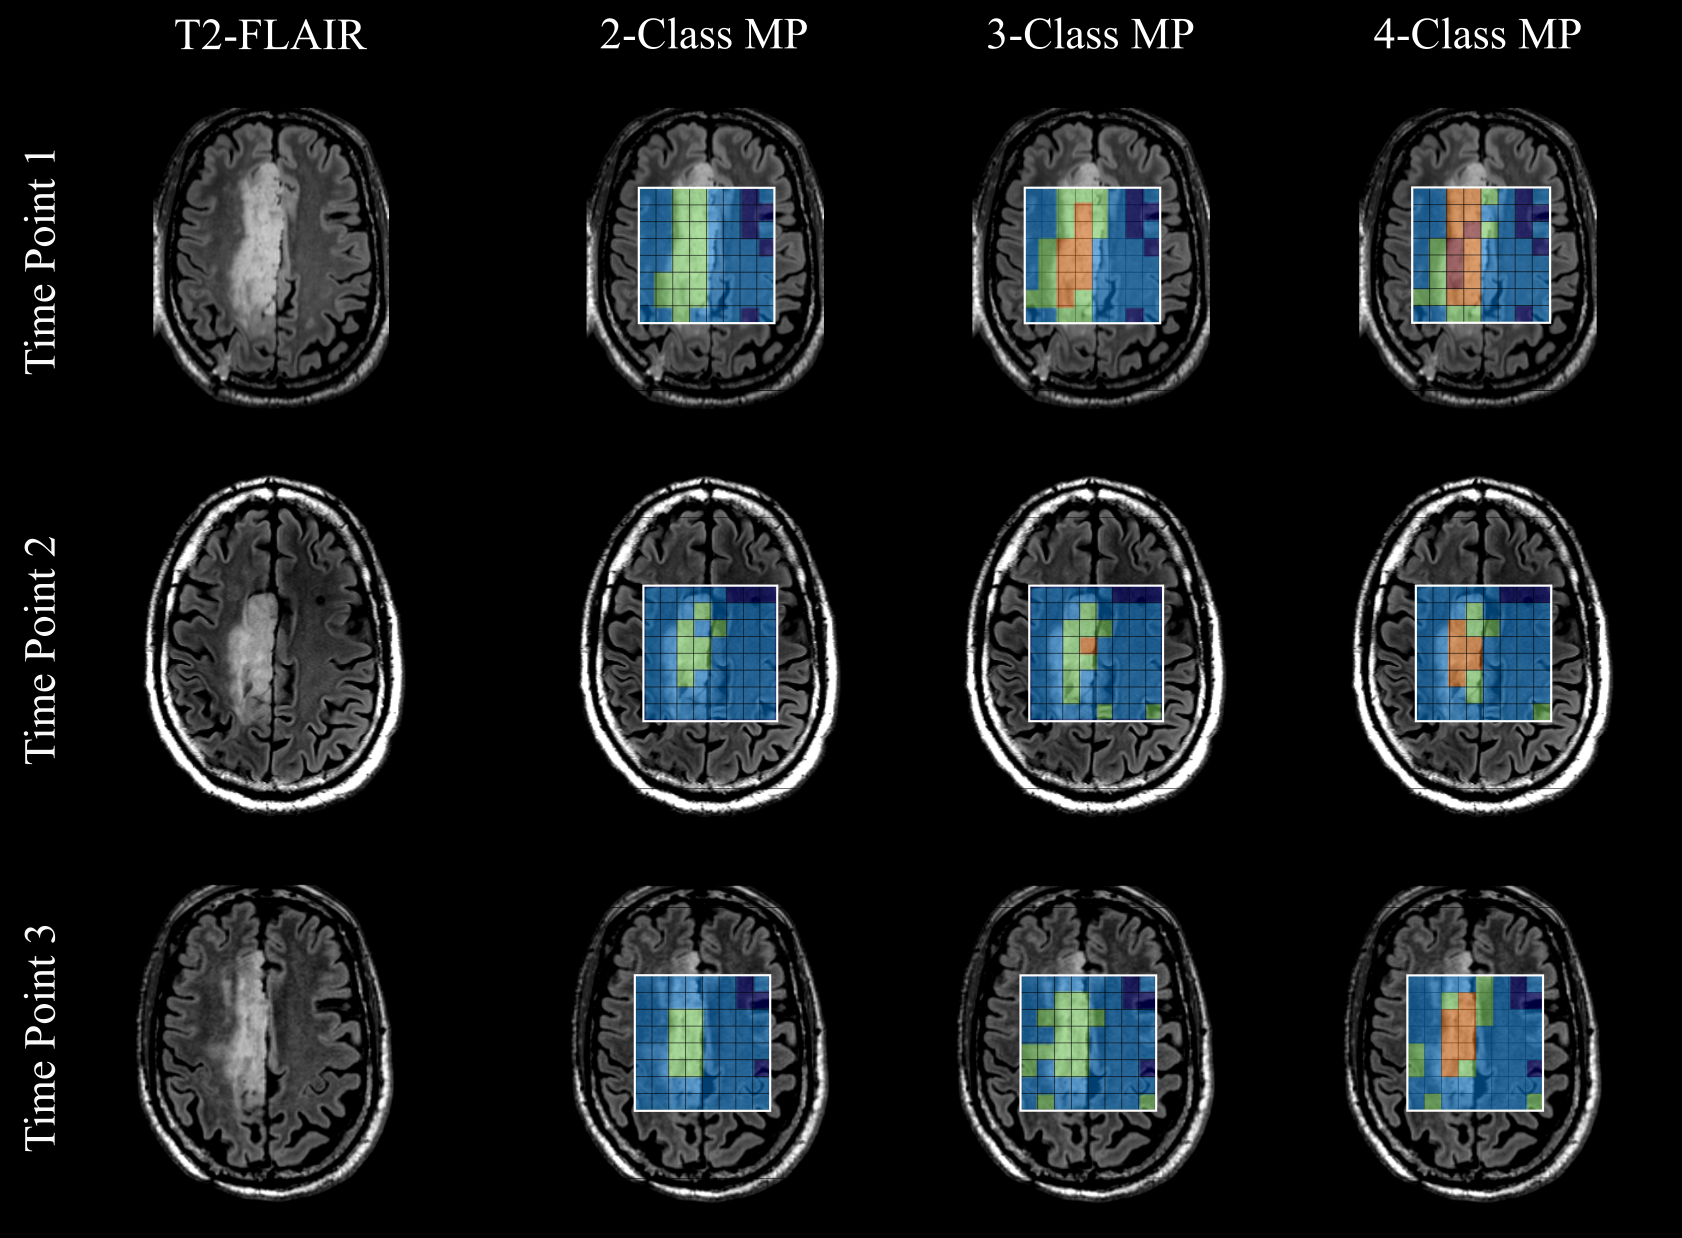
Data Visualization: The individual tissue classes were visualized using radar charts showing the different tissue classes and their metabolic composition using the median concentration of the voxels in each class (Fig.-3a). Furthermore, spatial context is obtained from the T2-FLAIR anatomical volumes.
Results and Discussion
The analyzed longitudinal data is presented in Fig.-1. The filtered data points with quality metrics allowed determining the range of values expected in these MRSI of acquisitions (Fig.-2). These normative values served as a reference for the unsupervised classification and the MRMP reports (Fig.-4). The unsupervised clustering (Fig.-3b) converged to different tissue classes with different levels of differentiation. For the 2-class analysis, signatures of healthy tissue and general tumor tissue were observed. The 3-class analysis introduced an additional compartment signature of tumor infiltration. Finally, the 4-class analysis captured two different signatures for healthy tissue, namely gray and white matter, and two different tumor signatures, showing the metabolically active tumor and necrotic tumor. Finally, the spatial distribution of tissue classes was validated overlaying the MRSI grid with the T2-FLAIR image (Fig.-5). The visualization of the different tissues classes provides a more dynamic display of metabolic activity that is not reflected in conventional imaging. This is especially evident in longitudinal scans (Fig.-4) where enhanced changes in the tumor metabolism can be detected and help inform patient management.Conclusion
MR metabolic phenotyping, a methodology for the diagnosis and long-term monitoring of brain tumors, was described in this work. The method showed high sensitivity to metabolic changes in brain tissue, complementing the detailed anatomical information obtained with MRI. Furthermore, the potential of this technology as a powerful clinical tool was shown effectively integrating the relevant information provided by MRI and MRSI to move towards a precise and highly‑personalized patient care in neuro-oncology.Acknowledgements
No acknowledgement found.References
[1] Choi C et al. 2-hydroxyglutarate detection by magnetic resonance spectroscopy in IDH-mutated patients with gliomas. Nat Med (2012).
[2] Jalbert LE, et al. Metabolic Profiling of IDH Mutation and Malignant Progression in Infiltrating Glioma. Nature Scientific Reports (2017).
[3] Shen X, et al. A Noninvasive Comparison Study between Human Gliomas with IDH1 and IDH2 Mutations by MR Spectroscopy. ISMRM (2019).
[4] Rowland B, et al. An open-source software repository for magnetic resonance spectroscopy data analysis tools. ISMRM MR Spectroscopy Workshop (2016).
[5] Provencher S. W. Automatic quantitation of localized in vivo 1H spectra with LCModel. NMR in Biomedicine 14, 260–264 (2001).
[6] Park, HS, and Jun, CH. A simple and fast algorithm for K-medoids clustering. Expert Systems with Applications (2009).
[7] Strasser B, et al. Whole-brain high-resolution 3D MRSI for measuring 2HG and tumor metabolism in mutant IDH glioma patients. ISMRM (2019).
Figures