0405
Differentiation between Glioblastomas and Cerebral Metastases using High-Resolution 3D MRSI1Institute for Medical Imaging Technology, School of Biomedical Engineering, Shanghai Jiao Tong University, Shanghai, China, 2Radiology Department, The Fifth People's Hospital of Shanghai, Fudan University, Shanghai, China, 3Beckman Institute for Advanced Science and Technology, University of Illinois at Urbana-Champaign, Urbana, IL, United States, 4Department of Electrical and Computer Engineering, University of Illinois at Urbana-Champaign, Urbana, IL, United States, 5Department of Radiation Oncology, Minhang Branch of Cancer Hospital, Fudan University, Shanghai, China, 6Radiology department, The Fifth People's Hospital of Shanghai, Fudan University, Shanghai, China, 7Department of Biomedical Engineering, Case Western Reserve University, Cleveland, OH, United States
Synopsis
Differentiation between glioblastomas (GBMs) and cerebral metastases based on MR structural images is often challenging due to the poor specificity. MRSI is a useful tool for mapping the metabolic fingerprints of tumors. In this study, we investigate the use of a high-resolution MRSI technique known as SPICE for differentiation between GBMs and cerebral metastases in 28 patients. Our results show the metabolic biomarkers are different between GBMs and metastases as well as in the enhancing ring and the core of neoplasms. SPICE potentially provides a non-invasive metabolic measure to differentiate GBMs from cerebral metastases with high resolution.
Introduction
Glioblastomas (GBMs) and brain metastases are the most common brain neoplasms but their therapeutic management is dramatically different. Therefore, accurate diagnosis is critical for effective oncological management. Differentiation between GBMs and cerebral metastases is challenging because conventional MRI methods are limited in their poor specificity 1. MR spectroscopic imaging (MRSI) has been well recognized as a potentially powerful tool for mapping the metabolic fingerprints of tumor tissue 2,3. However, existing MRSI methods have poor spatial resolution and thus limited capability to capture the heterogeneous nature of brain neoplasms. In this work, we investigate the use of a recently developed high-resolution MRSI technique known as SPICE (SPectroscopic Imaging by exploiting spatiospectral CorrElation) 4,5 for differentiation between GBMs and cerebral metastases. Our results show that the metabolic biomarkers could potentially differentiate the enhancing ring from the core region of neoplasms and distinguish GBMs from metastases.Methods
Twenty-eight patients with histopathologic diagnosis of glioblastomas (8 males, 4 females, mean age 56.7 years) and brain metastases (6 males, 10 females, mean age 60.1 years) were included in this study, which was approved by the Institutional Review Board of the Fifth People's Hospital of Shanghai, China.The MRSI data were obtained using the SPICE sequence 6,7, which has the following features: (1) extended EPSI-based readout with large echo-space (1.76 ms); (2) FID-based acquisition with ultra-short TE (1.6 ms) and short TR (160 ms); (3) elimination of water and lipid suppression; and (4) embedded navigators for field drift correction and head motion detection. In a 5-minute scan, the MRSI data were acquired at a nominal resolution of 2.0 × 2.4 × 3.0 mm3 with whole brain coverage (FOV = 230 × 230 × 72 mm3). Reconstruction of the spatiospectral distribution of the metabolites was performed using a union-of-subspaces model, incorporating pre-learned spectral basis functions 4,6-8. Then, the spectral quantification was performed using a subspace-based method 8. As part of the experimental protocol, brain structural images were obtained using 3D contrast-enhanced MPRAGE imaging (1.0 × 1.0 × 1.0 mm3, FOV = 256 mm, TR/TE = 2400/2.13 ms), and T2-weighted fluid attenuated inversion recovery (FLAIR) imaging (0.5 × 0.5 × 2.0 mm3, FOV = 240 mm, TR/TE = 9000/89 ms).
The neoplastic mass and edema masks were obtained using a level set based semi-automatic segmentation method 10. The neoplastic mass for each patient was segmented into two sub-regions: the contrast-enhanced region (ER) representing the solid part of the tumor, and the central region (CR) corresponding to the necrotic core of the tumor. ER was defined as the region with intensity higher than mean+3SD of the signal intensity from contralateral normal white matter, while the tissue inside the enhancing region represented CR 11.
The SPICE and FLAIR images were coregistered to T1-weighted images using linear affine transformation 9. In the statistical analysis, we compared the concentrations of choline (Cho), N-acetylaspartate (NAA) and relatively ratio Cho/NAA in the regions of ER, CR, edema and contralateral normal areas. We also investigated the neurometabolic differences within each region between GBMs and brain metastases. Finally, a logistic regression method was used to compare the differentiation performance of the MRSI markers to distinguish GBMs from brain metastases.
Results and Discussion
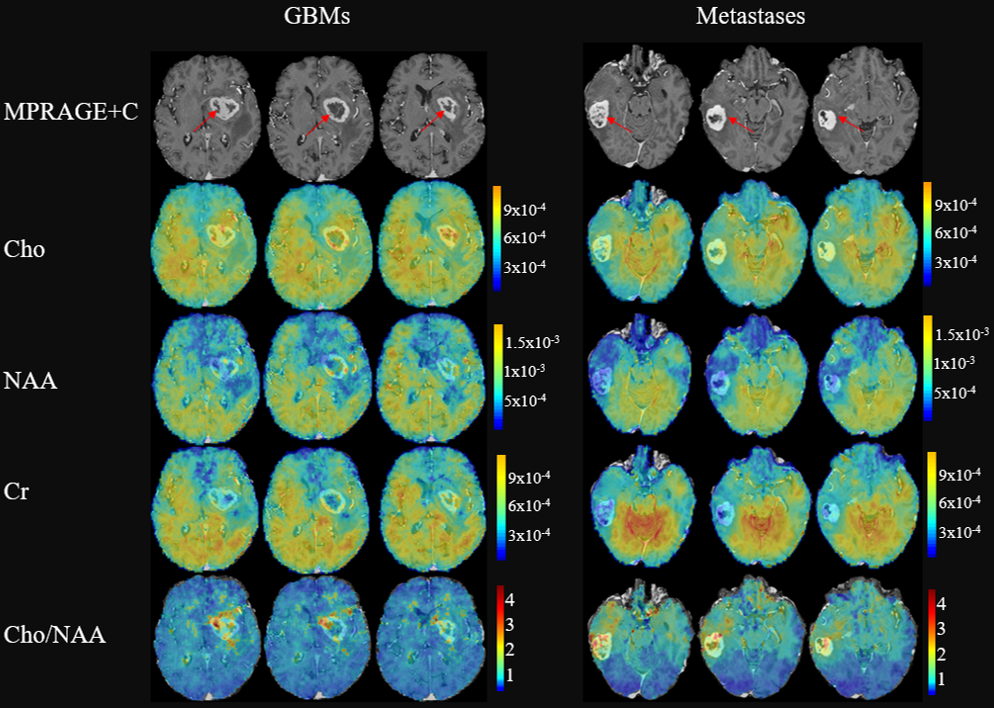
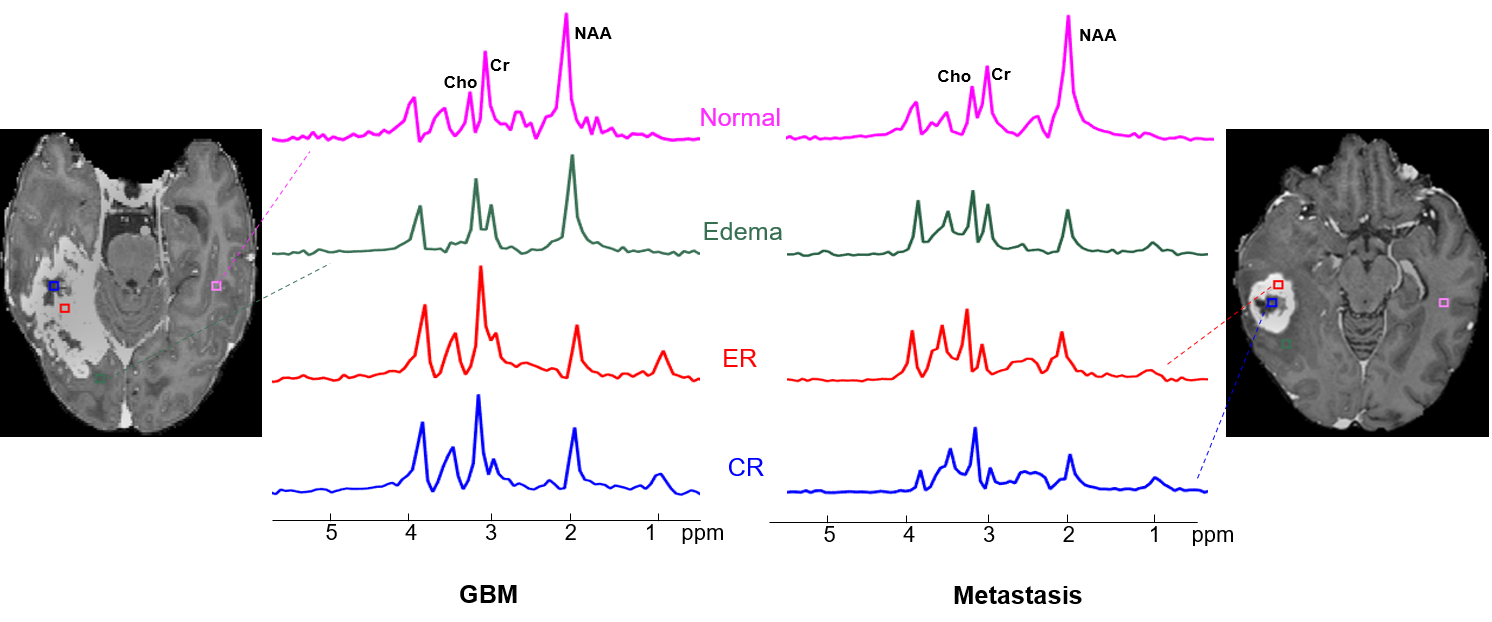
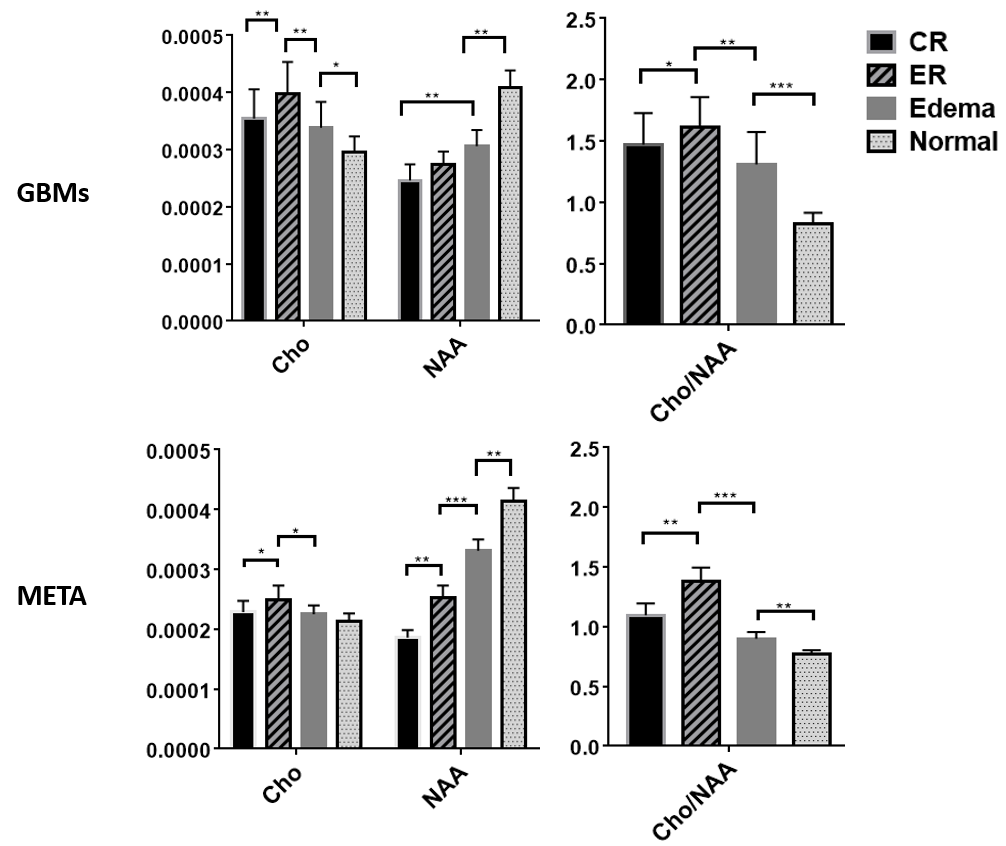
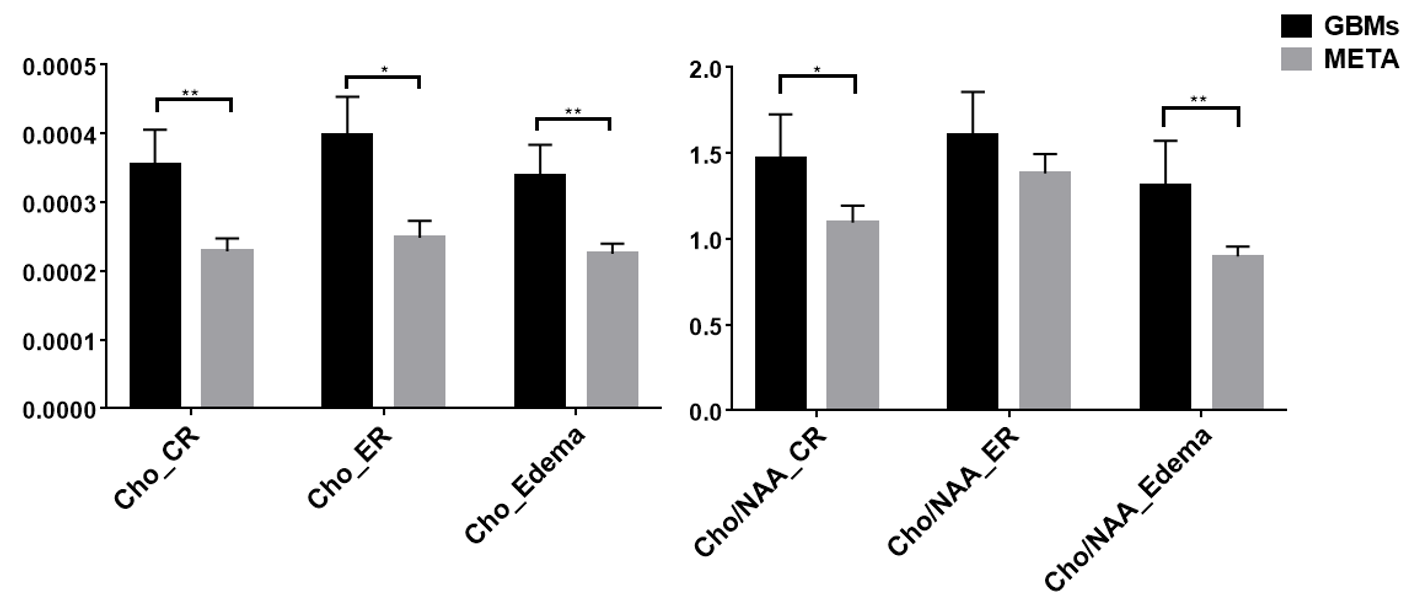
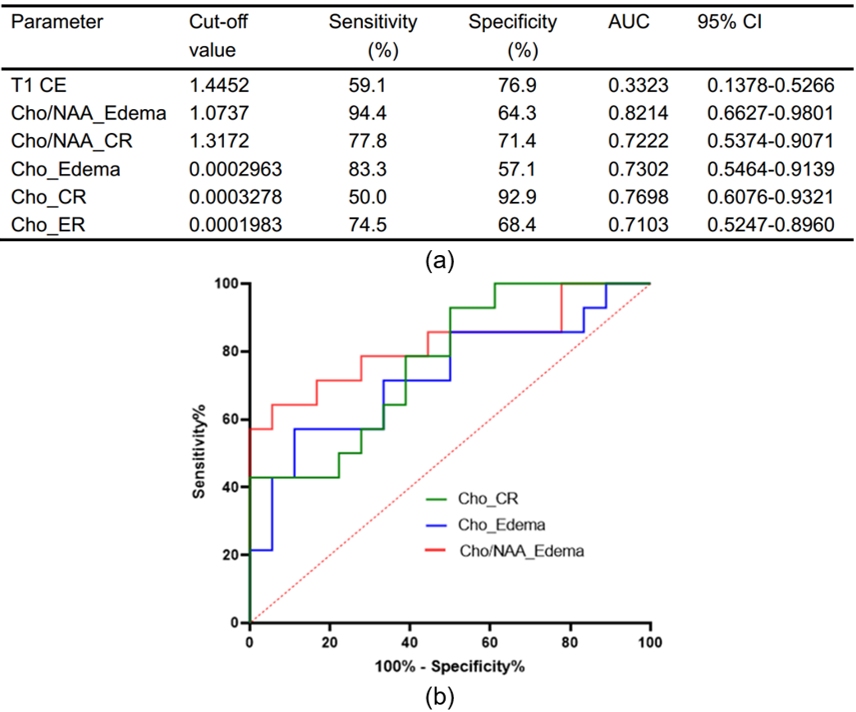
Figure 1 shows a set of representative metabolite maps (including Cho, NAA, Cr, Cho/NAA) from patients with GBM and cerebral metastasis, respectively. Figure 2 compares the spatially resolved spectra within the ER, CR, edema and contralateral normal regions. In both cases, decreased NAA as well as increased Cho can be clearly observed within the lesion, indicating neuronal loss and increased cell membrane turnover. Figure 3 summarizes the statistical comparison of the metabolite concentrations among different regions of GBMs and brain metastases. Cho in GBMs, NAA in metastases and Cho/NAA in both GBMs and metastases showed significant differences across all four regions (ANOVA, p < 0.05), which is consistent with previous studies 12. A region-wise comparison between GBM and metastasis is shown in Figure 4. The concentrations of Cho in ER, CR and edema area showed significant differences between GBMs and metastases, in line with previous literature 13. The Cho/NAA from CR and edema also showed significant differences. Figure 5 show the ROC analysis results using T1CE, Cho and Cho/NAA to differentiate GBMs and metastases. Cho/NAA in edema (AUC = 0.82) was the best parameter for the classification compared to the others.Conclusion
This paper reports a first study on the use of high-resolution MRSI for differentiation of GBMs from cerebral metastases. The high spatial resolution enabled by SPICE allow us to quantify metabolic heterogeneity in different regions of tumor. Based on the results from 28 patients, metabolic biomarkers such as Cho/NAA, NAA and Cho obtained were significantly different in ER and CR of neoplasms. Moreover, Cho/NAA in edema showed the best differentiation capability to distinguish GBMs from metastases. This study may lay a foundation for further investigation of the heterogeneous neurometabolic features of brain neoplasms using high-resolution MRSI.Acknowledgements
This work is supported by National Science Foundation of China (No.61671292 and 81871083).References
1. Tsougos I, Svolos P, Kousi E, et al. Differentiation of glioblastoma multiforme from metastatic brain tumor using proton magnetic resonance spectroscopy, diffusion and perfusion metrics at 3 T. Cancer Imaging. 2012;12(3):423–436.
2. Horská A and Barker PB. Imaging of brain tumors: MR spectroscopy and metabolic imaging. Neuroimag Clin. 2010;20(3):293-310.
3. De Graaf RA. In vivo NMR spectroscopy: principles and techniques. John Wiley & Sons. 2013.
4. Lam F, Ma C, Clifford B, et al. High‐resolution 1H‐MRSI of the brain using SPICE: data acquisition and image reconstruction. Magn Reson Med. 2016;76(4):1059-1070.
5. Peng X, Lam F, Li Y, et al. Simultaneous QSM and metabolic imaging of the brain using SPICE. Magn Reson Med. 2018;79(1):13-21.
6. Ma C, Lam F, Johnson CL, et al. Removal of nuisance signals from limited and sparse 1H MRSI data using a union‐of‐subspaces model. Magn Reson Med. 2016;75(2):488-497.
7. Lam F and Liang ZP. A subspace approach to high‐resolution spectroscopic imaging. Magn Reson Med. 2014;71(4):1349-1357.
8. Li Y, Lam F, Clifford B, et al. A subspace approach to spectral quantification for MR spectroscopic imaging. IEEE Trans Biomed Eng. 2017;64(10):2486-2489.
9. Smith SM, Jenkinson M, Woolrich MW, et al. Advances in functional and structural MR image analysis and implementation as FSL[J]. NeuroImage, 2004, 23(supp-S1).
10. Li C, Xu C, Gui C, et al. Level set evolution without re-initialization: A new variational formulation[C]// Computer Vision and Pattern Recognition, 2005. CVPR 2005. IEEE Computer Society Conference on. IEEE, 2005.
11. Wang S, Kim S, Chawla S, et al. Differentiation between glioblastomas and solitary brain metastases using diffusion tensor imaging[J]. NeuroImage, 2009, 44(3):653-660.
12. Ricci R, Bacci A, Tugnoli V, et al. Metabolic Findings on 3T 1H-MR Spectroscopy in Peritumoral Brain Edema[J]. American Journal of Neuroradiology, 2007, 28(7):1287-1291.
13. Hiwatashi, Akio. (2003). High-grade Gliomas and Solitary Metastases: Differentiation by Using Diffusion, Perfusion, and Proton Spectroscopic MR Imaging.
Figures