0403
Differentiation of IDH Mutant from IDH wild-type High-grade Gliomas using Combined Analysis of Diffusion and Perfusion MRI1Research, Sidra Medicine, Doha, Qatar, 2Department of Radiology, Perelman School of Medicine at the University of Pennsylvania, Philadelphia, PA, United States, 3Department of Pathology and Lab Medicine, Perelman School of Medicine at the University of Pennsylvania, Philadelphia, PA, United States, 4Department of Neurosurgery, Perelman School of Medicine at the University of Pennsylvania, Philadelphia, PA, United States
Synopsis
Accurate identification of isocitrate dehydrogenase (IDH) mutant high-grade glioma is clinically important. We investigated the combined utility of diffusion (DTI) and perfusion (DSC-PWI) MR imaging in distinguishing IDH mutant from IDH wild-type high-grade gliomas. Treatment naïve patients (n=30) with IDH-mutant (n=14) and IDH-wild-type (n=16) high-grade gliomas were recruited. A classification model comprising of mean diffusivity, coefficient of planar anisotropy and maximum relative cerebral blood volume differentiated two genotypes of gliomas with an accuracy of 85%, a sensitivity of 87.2%, and a specificity of 81.5%. Combined analysis of DTI and DSC-PWI may be helpful in distinguishing IDH profiles of high-grade gliomas.
Introduction
Mutations in isocitrate dehydrogenase (IDH) gene occurs in 70% of WHO grade II/III gliomas and 10-15% glioblastomas (GBMs).1 Accurate identification of IDH-mutation is clinically important.2 Using MR spectroscopy, some studies3,4 including from our group5 have identified low-grade gliomas harboring IDH mutation by detecting 2-hydroxyglutarate (2-HG). However, not all IDH mutant gliomas show neomorphic activity of 2-HG production.6 Moreover, use of MR spectroscopy requires development of sophisticated pulse sequences and post-processing tools. Therefore, it is essential to develop alternative imaging biomarkers to distinguish IDH-mutant from IDH-wild-type gliomas. These biomarkers may also provide additional insights into the tumor microenvironment as targeted therapeutic agents are developed. Anecdotal studies7,8 have employed MR diffusion and perfusion imaging techniques to differentiate these two genotypes in low-grade gliomas. Although incidence rates of IDH mutation in glioblastomas (GBMs) and high-grade gliomas is low, it is equally important to develop imaging biomarkers to understand their tumor microenvironment and to discriminate their IDH profiles. Therefore, present study was performed to investigate the potential of diffusion tensor imaging (DTI) and dynamic-susceptibility contrast-perfusion weighted imaging (DSC-PWI) in differentiating IDH-mutant from IDH-wild-type high-grade gliomas.Material and Methods
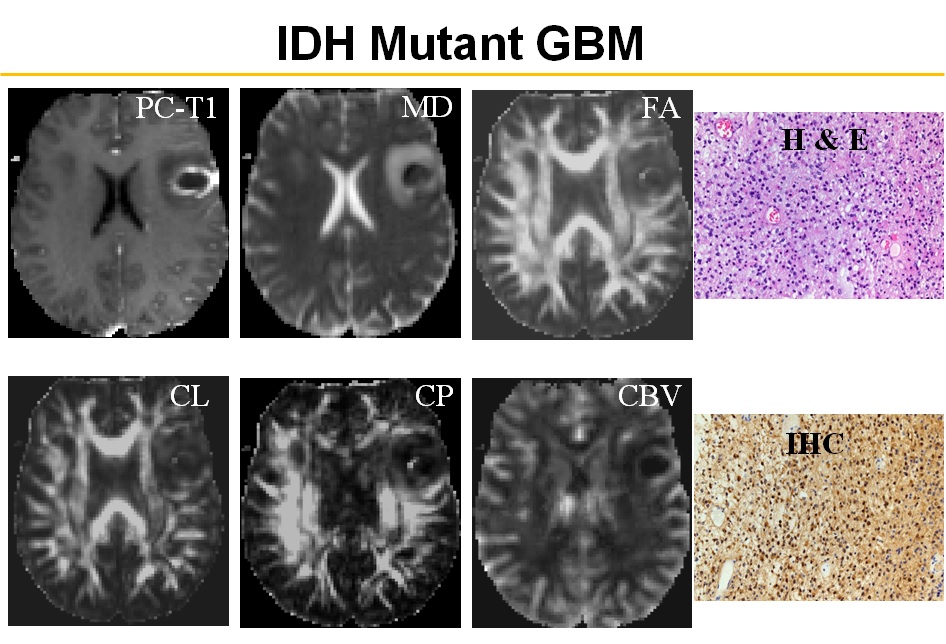
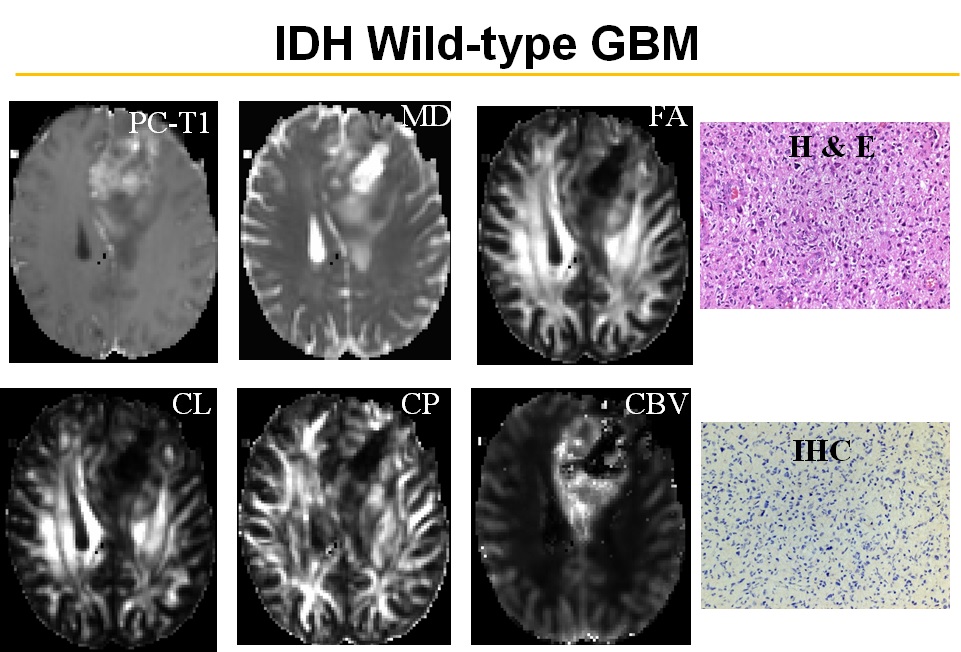
A cohort of 30 treatment naïve patients with IDH-mutant (n=14) and IDH-wild-type (n=16) high-grade gliomas [GBM and anaplastic astrocytoma (WHO-grade-III)] underwent anatomical imaging, DTI and DSC-PWI on a 3T MR system with standard parameters. Motion and eddy current corrected DTI derived maps [mead diffusivity (MD), fractional anisotropy (FA), coefficient of linear (CL), planar (CP) and spherical anisotropy (CS)] and DSC-perfusion imaging derived cerebral blood volume (CBV) maps and T2-FLAIR images were co-registered to post-contrast T1-weighted images as described previously.9,10 A semi-automatic method was used to segment the contrast enhancing region (CER)/solid regions of each lesion. The CBV were normalized to the contralateral normal white matter to obtain rCBV. Median values of DTI indices [MD (mm2/s), FA, CL, CP and CS], and rCBV were computed from CER of lesions. In addition, the 90th percentile of rCBV values was reported as rCBVmax. Mann-Whitney U-tests were performed to look for differences in DTI and DSC parameters between IDH mutant and IDH wild-type high-grade gliomas. A probabilistic (P) value of less than 0.05 was considered significant. Additionally, all DTI and DSC-PWI parameters with a high predictive power (P < 0.20, Wald test) using univariate analysis were selected and incorporated into multivariate logistic regression analyses to determine the best classification model. The receiver operating characteristic (ROC) analyses were also performed.Results
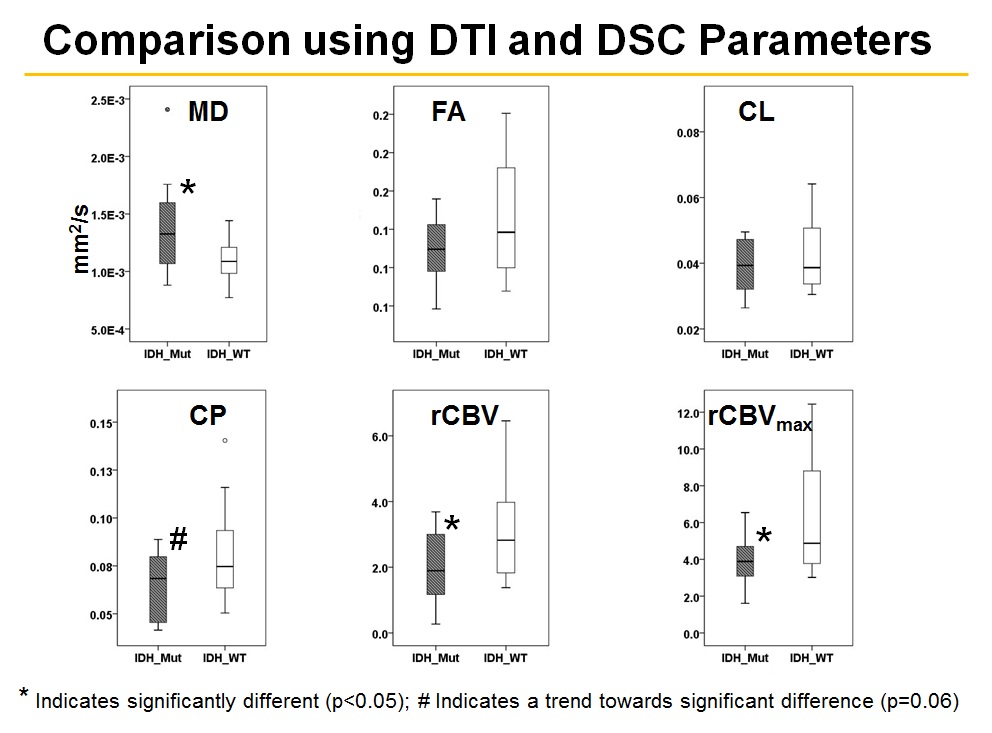
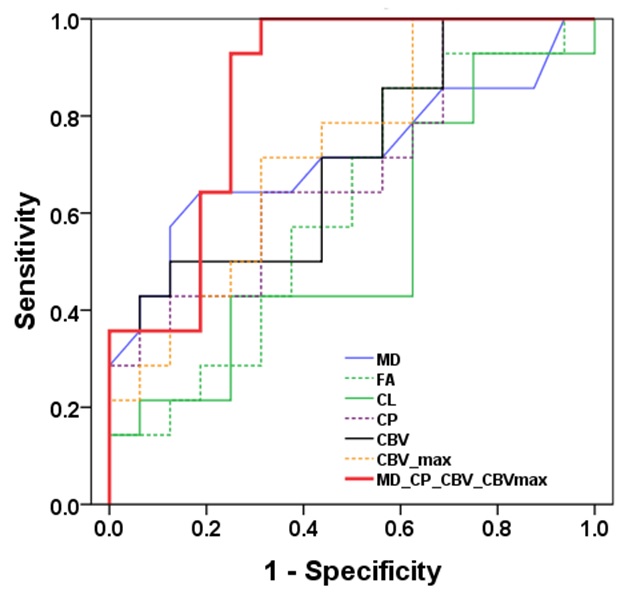
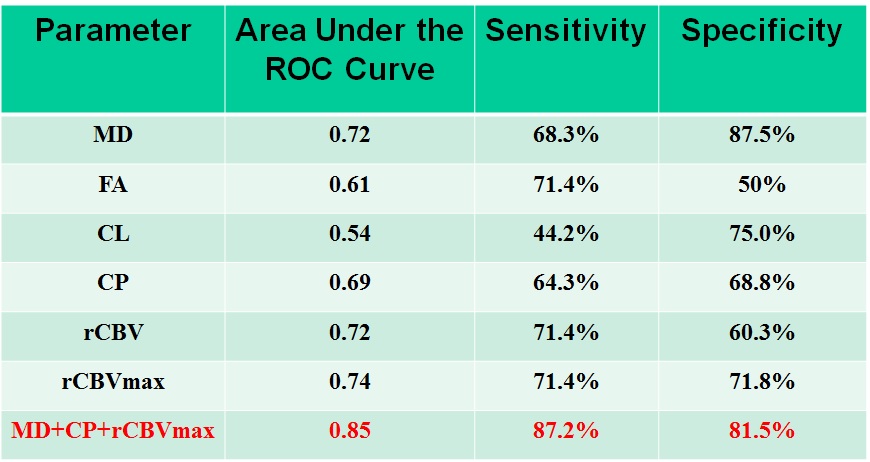
Representative anatomical images, DTI and CBV maps from IDH mutant and IDH wild-type high-grade gliomas are shown in Figures 1 and 2 respectively. Distributions of DTI indices, rCBV and rCBVmax between two groups of patients are shown as box-whisker plots (Figure 3). From DTI, significantly higher MD (1.5±0.3x10⁻³ vs. 1.1±0.1x10⁻³mm2/s, p=0.02), and diminished CP (0.06±0.01 vs. 0.09±0.03, p=0.04) were observed in IDH-mutant than in IDH-wild-type high-grade gliomas. Additionally, there were trends of higher FA and CL in IDH-wild type gliomas. From DSC-PWI, reduced rCBV (1.78±0.84 vs. 4.03±1.01, p=0.03) and rCBVmax (2.85±1.06 vs. 6.43±2.06, p=0.02) were observed in IDH-mutant compared to IDH-wild-type gliomas. Using multivariate logistic regression analyses, MD, CP and rCBVmax were the best parameters that were selected in a backward stepwise method. This classification model distinguished two groups of gliomas with an accuracy (AUC) of 0.85, a sensitivity of 87.2%, and a specificity of 81.5% (Figure 4). The summary of sensitivity and specificity for individual parameters and for the best classification model in distinguishing IDH mutant and IDH wild-type high-grade glioma is presented in Table 1.Discussion
In this study, we evaluated the combined utility of DTI and DSC-PWI in distinguishing IDH mutant and IDH wild-type high-grade gliomas. Our results revealed that a classification model comprising of DTI and DSC derived parameters can distinguish these two genotypes of high-grade gliomas with a high accuracy of 85%. Because of unique molecular signatures and signaling pathways, IDH mutated gliomas are associated with relatively indolent phenotypes with lower glucose metabolism and are known to grow at a slower rate than IDH wild-type gliomas.11 Observation of lower rCBV from IDH mutated high-grade gliomas compared to IDH wild-types suggest that these two genotypes are associated with distinct angiogenesis transcriptome signatures.7 Interestingly, we observed lower CP from IDH mutant gliomas compared to IDH wild-type counterparts. Using DTI, we have previously12 reported that high CP may indicate hardness in meningiomas. It has also been reported that extracellular matrix of IDH mutant GBMs is softer than that of IDH wild-type GBMs.13 Taken together, these studies and our findings may provide a notion that IDH mutant gliomas tend to be soft in nature. However, correlative studies with MR Elastography, DTI and histopathology are required to ascertain the degree of softness in gliomas.Conclusion
Our findings suggest that a combined analysis of DTI and DSC-PWI data from enhancing regions of lesions is promising in distinguishing IDH mutant from IDH wild-type high-grade gliomas.Acknowledgements
No acknowledgement found.References
1. Yan H, Parsons DW, Jin G, et al. IDH1 and IDH2 mutations in gliomas. New Eng J Med. 2009 Feb 19;360(8):765-73.
2. Yan W, Zhang W, You G, et al. Correlation of IDH1 mutation with clinicopathologic factors and prognosis in primary glioblastoma: a report of 118 patients from China. PLoS One. 7 2012;7(1):e30339. doi: 10.1371/journal.pone.0030339.
3. Andronesi OC, Rapalino O, Gerstner E, et al. Detection of oncogenic IDH1 mutations using magnetic resonance spectroscopy of 2-hydroxyglutarate. J Clin Invest. 2013 Sep;123(9):3659-63.
4. An Z, Tiwari V, Baxter J, et al. 3D high-resolution imaging of 2-hydroxyglutarate in glioma patients using DRAG-EPSI at 3T in vivo. Magn Reson Med. 2019 Feb;81(2):795-802.
5. Verma G, Mohan S, Nasrallah MP, et al. Non-invasive detection of 2-hydroxyglutarate in IDH-mutated gliomas using two-dimensional localized correlation spectroscopy (2D L-COSY) at 7 Tesla. J Transl Med. 2016 Sep 22;14(1):274-82.
6. Ichimura K, Pearson DM, Kocialkowski S, et al. IDH1 mutations are present in the majority of common adult gliomas but rare in primary glioblastomas. Neuro Oncol. 2009 Aug;11(4):341-7.
7. Leu K, Ott GA, Lai A, et al. Perfusion and diffusion MRI signatures in histologic and genetic subtypes of WHO grade II-III diffuse gliomas. J Neurooncol. 2017 Aug;134(1):177-88.
8. Xing Z, Yang X, She D, et al. Noninvasive Assessment of IDH Mutational Status in World Health Organization Grade II and III Astrocytomas Using DWI and DSC-PWI Combined with Conventional MR Imaging. Am J Neuroradiol. 2017 Jun;38(6):1138-44.
9. Wang S, Kim S, Chawla S, et al. Differentiation between glioblastomas and solitary brain metastases using diffusion tensor imaging. NeuroImage. 2009;44:653-60.
10. Chawla S, Wang S, Mohan S, et al. Differentiation of brain infection from necrotic glioblastoma using combined analysis of diffusion and perfusion MRI. J Magn Reson Imaging. 2019 Jan;49(1):184-94.
11. Victor RR, Malta TM, Seki T, et al. Metabolic Reprogramming Associated with Aggressiveness Occurs in the G-CIMP-High Molecular Subtypes of IDH1mut Lower Grade Gliomas. Neuro Oncol. 2019 Oct 30. pii: noz207. doi: 10.1093/neuonc/noz207.
12. Wang S, Kim S, Zhang Y, et al. Determination of grade and subtype of meningiomas by using histogram analysis of diffusion-tensor imaging metrics. Radiology. 2012; 262:584-92.
13. Miroshnikova YA, Mouw JK, Barnes JM, et al. Tissue mechanics promote IDH1-dependent HIF1α-tenascin C feedback to regulate glioblastoma aggression. Nat Cell Biol. 2016; 18: 1336-45.
Figures