0402
Sodium MRI at 7 Tesla as quantitative biomarker to assess tumor heterogeneity and histologic subtypes in glioma patients1Radiology, German Cancer Research Center, Heidelberg, Germany, 2Radiooncology, University Hospital Heidelberg, Heidelberg, Germany, 3Medical Physics in Radiology, German Cancer Research Center, Heidelberg, Germany
Synopsis
23Na MRI provides information on physiologic and pathophysiologically altered tissue sodium concentrations in vivo. In this prospective trial, we investigated the potential of 23Na MRI at 7.0 Tesla to predict the tumor grade and genetic subtypes (such as isocitrate dehydrogenase (IDH) mutation and O6-methylguanine DNA methyltransferase (MGMT) promotor methylation) in a study cohort of 28 glioma patients. We show that that the quantitative 23Na signal correlates with tissue-specific tumor subcompartments and that the contrast may allow non-invasive assessment of the tumor grade and IDH mutation.
Introduction
In patients with glioma, individual prognosis strongly dependents on tumor grade (1) and genetic features, such as the isocitrate dehydrogenase (IDH) status and the O6-methylguanine DNA methyltransferase (MGMT) promotor methylation (2, 3). While IDH mutation is currently regarded as the predominant prognostic factor (2), MGMT promotor status predicts the efficacy of chemotherapy and is therefore used in planning of therapy strategies (4, 5). Hence, the development of imaging methods that yield non-invasive predictors of histopathological features are highly desirable to support clinical decision making and to aid image-guided therapy strategies. In this context, Sodium (23Na) MRI adds information on physiologic and pathophysiologically altered tissue sodium concentration and, therefore, yields complementary information to conventional imaging techniques. Pilot studies reported a correlation of tumor 23Na concentration and the IDH mutation status in glioma patients (6, 7). The purpose of this work was to investigate 23Na MRI at 7 Tesla (T) in a large prospective cohort of 30 glioma patients prior to chemoradiotherapy (CRT) and to correlate the quantitative 23Na signal intensities with the tumor grade, the IDH mutation status, and the MGMT promotor methylation.Methods
This study has received approval by the local ethics committee. 28 glioma patients (median 53.5 years, IQR: 20.31, 16 male) underwent quantitative 23Na MRI on a 7 T scanner (Siemens Healthineers, Erlangen, Germany) prior to chemoradiotherapy. A density-adapted 3D radial projection pulse sequence (8) (TE=0.35ms, TR=160ms, alpha=90°, 4000 radial projections) with consecutive iterative 3D-DLCS reconstruction (9) was employed. External references of known concentrations are used to determine tissue sodium concentrations. Standard clinical MRI was performed at 3T during clinical routine. Areas of Gadolinium-contrast enhancement (gdce), non-enhancing T2-hyperintensity (regarded as edema), necrosis, and normal-appearing white matter (nawm) regions were segmented on anatomical 1H images. All segmentations were co-registered to the 23Na images (MITK, Heidelberg, Germany). The median 23Na concentrations of all areas were compared pairwise using two-sided paired t-tests. Whitney-Mann-U-tests were used to compare 23Na signals of the whole tumor volume between glioblastoma (GBM) and lower-grade-glioma WHO I-III (LGG), IDH-mutated (mut) and IDH wild-type (wt) gliomas as well as MGMT methylated GBM versus unmethylated GBM. All diagnoses were histopathologically confirmed (LGG: 7, GBM: 21; IDH-mut: 7, IDH-wt: 18, n/a: 3; MGMT methylated: 14, unmethylated: 4, n/a: 10). Additionally, receiver operating characteristic (ROC) curves were calculated for the tumor grade, IDH mutation, and MGMT methylation. ROC analysis encompassed calculation of the area under the curve (AUC) as well as the best thresholds according to Youden’s index with corresponding sensitivity and specificity values.Results
The 23Na concentration increased successively from nawm to necrosis (mean ± sd [mM]: nawm = 37.84 ± 5.87, edema = 54.69 ± 10.64, gdce = 61.72 ± 12.95, necrosis = 81.88 ± 17.53). The differences between all pairwise comparisons were statistically significant (p<0.01) (Fig. 1). Furthermore, 23Na concentrations were significantly increased in LGG compared to GBM (23Na signal median [IQR]: GBM = 54.18 mM [46.86 – 58.77mM], LGG = 66.73 mM [62.39-67.66 mM], p=0.0074). Correspondingly, IDH-mut gliomas showed significantly increased 23Na concentrations compared to IDH-wt tumors (23Na signal median [IQR]: IDH-wt = 52.37 mM [45.98 – 58.56mM], IDH-mut = 65.02 mM [58.87-67.05 mM], p=0.0391). ROC analyses yielded AUC= 0.89 [95% CI: 0.75 – 1], (sensitivity 85.7%, specificity 90.5%) for tumor grade, and AUC=0.85 [95% CI: 0.67 – 1], (sensitivity 100%, specificity 78%) for IDH mutation status. No significant differences were observed between MGMT methylated and MGMT unmethylated tumors (23Na signal median [IQR]: MGMT methylated = 57.59 mM [50.70 – 59.17mM], MGMT unmethylated = 48.78 mM [45.88 – 53.91 mM], p>0.05). Corresponding ROC analysis for MGMT promotor methylation status yielded AUC = 0.63 [95% CI: 0.23 – 1]).Discussion
In this study we showed that that the quantitative 23Na signal correlates with tissue specific tumor subcompartments and that the contrast enabled a non-invasive differentiation of the tumor grade and IDH mutation status. An elevation of the total 23Na signal in gliomas is generally well known (10-12) and could be explained by the increased intracellular 23Na content due to malignant growth (13) as well as the elevated extracellular volumes in gliomas (14). The continuous gradient of 23Na signal intensity from central necrosis to white matter suggests a correlation with tumor infiltration. This hypothesis, however, requires forthcoming studies with region-specific histopathological correlation. The result of significantly increased 23Na signals in LGG (WHO I-III) and correspondingly IDH mutant gliomas are supported by earlier studies (6-8). Therefore, histopathologic subtypes of glioma may cause different alterations of tumor sodium concentration; with higher total 23Na concentrations possibly reflecting more favorable tumor biology.Conclusion
23Na MRI at 7 Tesla might serve as non-invasive biomarker for the assessment of tumor grade and IDH mutation in gliomas. Hence, 23Na imaging might aid clinical decision making and treatment planning in patients with glioma.Acknowledgements
No acknowledgement found.References
1.Ohgaki H, Kleihues P. Population-based studies on incidence, survival rates, and genetic alterations in astrocytic and oligodendroglial gliomas. J Neuropathol Exp Neurol. 2005;64(6):479-89.
2.Olar A, Wani KM, Alfaro-Munoz KD, et al. IDH mutation status and role of WHO grade and mitotic index in overall survival in grade II-III diffuse gliomas. Acta Neuropathol. 2015;129(4):585-96.
3.Hegi ME, Diserens AC, Gorlia T, et al. MGMT gene silencing and benefit from temozolomide in glioblastoma. N Engl J Med. 2005;352(10):997-1003.
4.Wick W, Platten M, Meisner C, et al. Temozolomide chemotherapy alone versus radiotherapy alone for malignant astrocytoma in the elderly: the NOA-08 randomised, phase 3 trial. Lancet Oncol. 2012;13(7):707-15.
5.Perry JR, Laperriere N, O'Callaghan CJ, et al. Short-Course Radiation plus Temozolomide in Elderly Patients with Glioblastoma. N Engl J Med. 2017;376(11):1027-37.
6.Biller A, Badde S, Nagel A, et al. Improved Brain Tumor Classification by Sodium MR Imaging: Prediction of IDH Mutation Status and Tumor Progression. AJNR Am J Neuroradiol. 2016;37(1):66-73.
7.Shymanskaya A, Worthoff WA, Stoffels G, et al. Comparison of [(18)F]Fluoroethyltyrosine PET and Sodium MRI in Cerebral Gliomas: a Pilot Study. Mol Imaging Biol. 2019.
8.Nagel AM, Bock M, Hartmann C, et al. The potential of relaxation-weighted sodium magnetic resonance imaging as demonstrated on brain tumors. Invest Radiol. 2011;46(9):539-47.
9.Behl NG, Gnahm C, Bachert P, et al. Three-dimensional dictionary-learning reconstruction of (23)Na MRI data. Magn Reson Med. 2016;75(4):1605-16.
10.Turski PA, Houston LW, Perman WH, et al. Experimental and human brain neoplasms: detection with in vivo sodium MR imaging. Radiology. 1987;163(1):245-9.
11.Hashimoto T, Ikehira H, Fukuda H, et al. In vivo sodium-23 MRI in brain tumors: evaluation of preliminary clinical experience. Am J Physiol Imaging. 1991;6(2):74-80.
12.Ouwerkerk R, Bleich KB, Gillen JS, et al. Tissue sodium concentration in human brain tumors as measured with 23Na MR imaging. Radiology. 2003;227(2):529-37.
13.Zhu W, Carney KE, Pigott VM, et al. Glioma-mediated microglial activation promotes glioma proliferation and migration: roles of Na+/H+ exchanger isoform 1. Carcinogenesis. 2016;37(9):839-51.
14.Zamecnik J, Vargova L, Homola A, et al. Extracellular matrix glycoproteins and diffusion barriers in human astrocytic tumours. Neuropathol Appl Neurobiol. 2004;30(4):338-50.
Figures
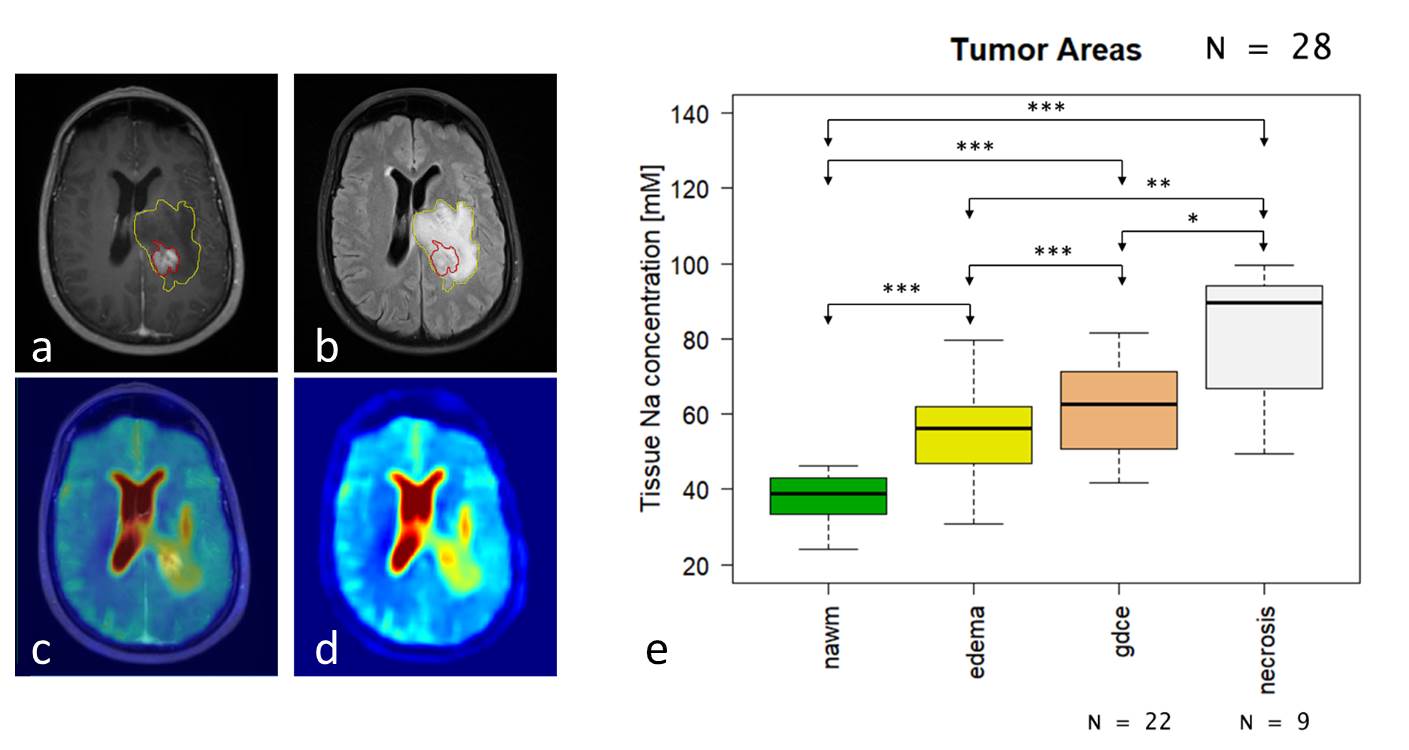
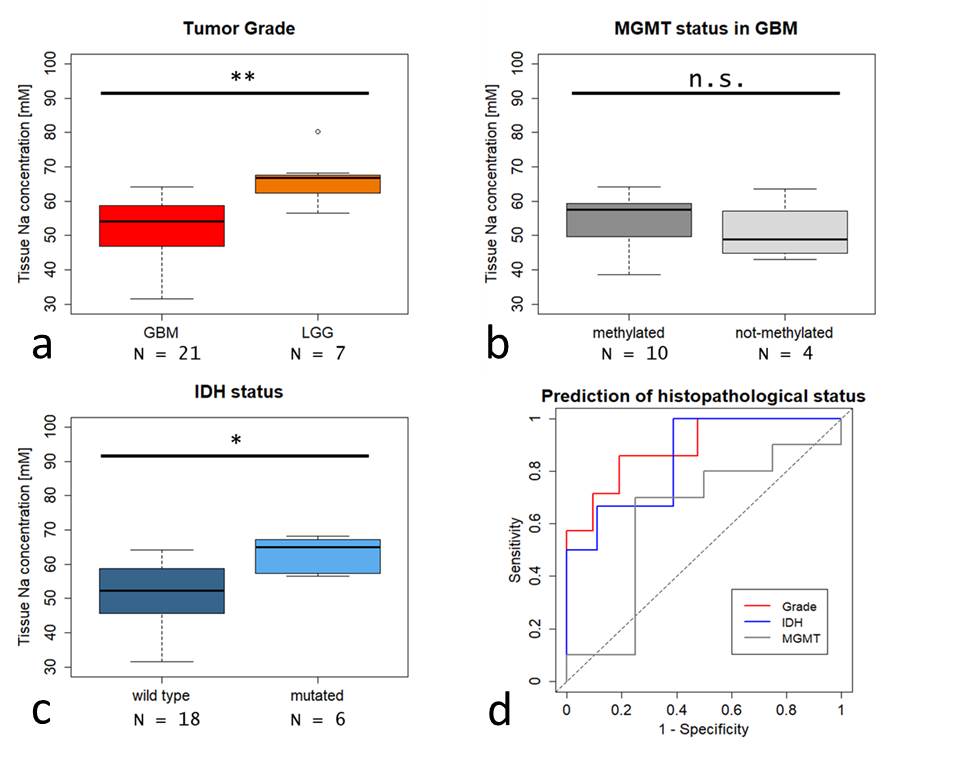
Fig.2: Comparison of 23Na concentration with respect to different histopathological grade (a), MGMT-promotor methylation (b), and IDH-mutation status (c). 23Na concentrations differed significantly between glioblastoma WHO IV (GBM) and lower grade gliomas WHO I-III (LGG) Significantly higher 23Na concentrations were also observed in IDH mutated gliomas. There were no significant differences according to MGMT methylation status in GBM. Corresponding ROC curves (d) for prediction of tumor grade, IDH mutation, and MGMT status.(** = p<0.01, * = p<0.05, n.s. = not significant).