0401
Radiomics profiling identifies the incremental value of MRI features to key molecular biomarkers for risk stratification of high-grade gliomas1Department of Radiology, First Clinical Medical College, Shanxi Medical University, Taiyuan, Shanxi Province, China, 2Key Laboratory of Molecular Imaging, Institute of Automation, Chinese Academy of Sciences, Beijing, China, 3School of Economics and Management, Shanxi University, Taiyuan, Shanxi Province, China
Synopsis
To identify the incremental value of MRI features to the key molecular biomarkers for risk stratification of high-grade gliomas (HGGs). A comprehensive radiomics analysis integrated MRI features, clinical characteristics and genetic information was performed on 137 patients from TCGA/TCIA dataset and our institution. The combined model integrated radiomics signature with age and IDH genotype holds the best prognostic value. The radiomics signature has incremental prognostic value beyond the key molecular biomarkers, and could identify risk subgroups in various clinical and molecular subgroups. Our comprehensive radiomics analysis provided a potential tool to guide an individual diagnosis and treatment decisions for HGGs.
Introduction
High-grade gliomas (HGGs) are the most common primary adult brain malignancy of the central nervous system (CNS)1. Some HGGs with the same pathological grade have significant differences in curative efficacy and prognosis, and this is closely related to tumor genotyping. At present, Isocitrate dehydrogenase (IDH) and O6-methylguanine-DNA methyltransferase (MGMT) are the most important molecular biomarkers for prognosis evaluation of HGGs2. Tumors with IDH mutation and methylated MGMT carry a better survival outcome3, 4. Parallel to the developments in the molecular classification of HGGs, Radiomics based on magnetic resonance imaging (MRI) provides a potential opportunity for the preoperative risk evaluation of HGGs5, 6. In previous studies, the prognostic value of the radiomics signature was only demonstrated in GBM, grade III gliomas have not been involved, and the key molecular biomarkers (IDH and MGMT) have not been integrated in the radiomics analysis.In the present study, we retrospectively investigated 137 patients with HGGs from a TCGA/TCIA dataset and our institution. We explored the possibility of using radiomic features extracted from MRI for the risk stratification of HGGs, and investigated the incremental prognostic value of the radiomics signature beyond key molecular biomarkers and clinical characteristics.
Methods
A total of 137 patients were retrospectively collected including the preoperative MR images, clinical and genetic data from TCGA/TCIA dataset and our institution as shown in Fig. 1. The TCGA/TCIA dataset was randomly divided into a training set (n=74) and internal validation set (ValidationSet1; n=32) at a ratio of 7:3. Our dataset was used as an external validation set (ValidationSet2). Manual segmentation of the tumor and edema ROI was performed both on the CE-T1 and T2FLAIR MR images using ITK-SNAP. Image resampling and image intensity normalization were conducted. A total of 1976 radiomic features were extracted for each patient. The univariate Cox regression analysis and least absolute shrinkage and selection operator (LASSO) method were used to select effective features. The univariate and multivariate Cox model was built to explore the advantage of clinical characteristics, molecular biomarkers, and radiomic features. The Kaplan-Meier survival analysis was used to evaluate the prognostic models, and a stratified analysis was conducted to demonstrate the incremental value of the radiomics signature. A nomogram was developed to predict the 1-year, 2-year and 3-year overall survival (OS) of HGGs. Decision curve analysis was performed to compare the clinical usefulness of radiomics nomogram and clinic-genetic model.Results
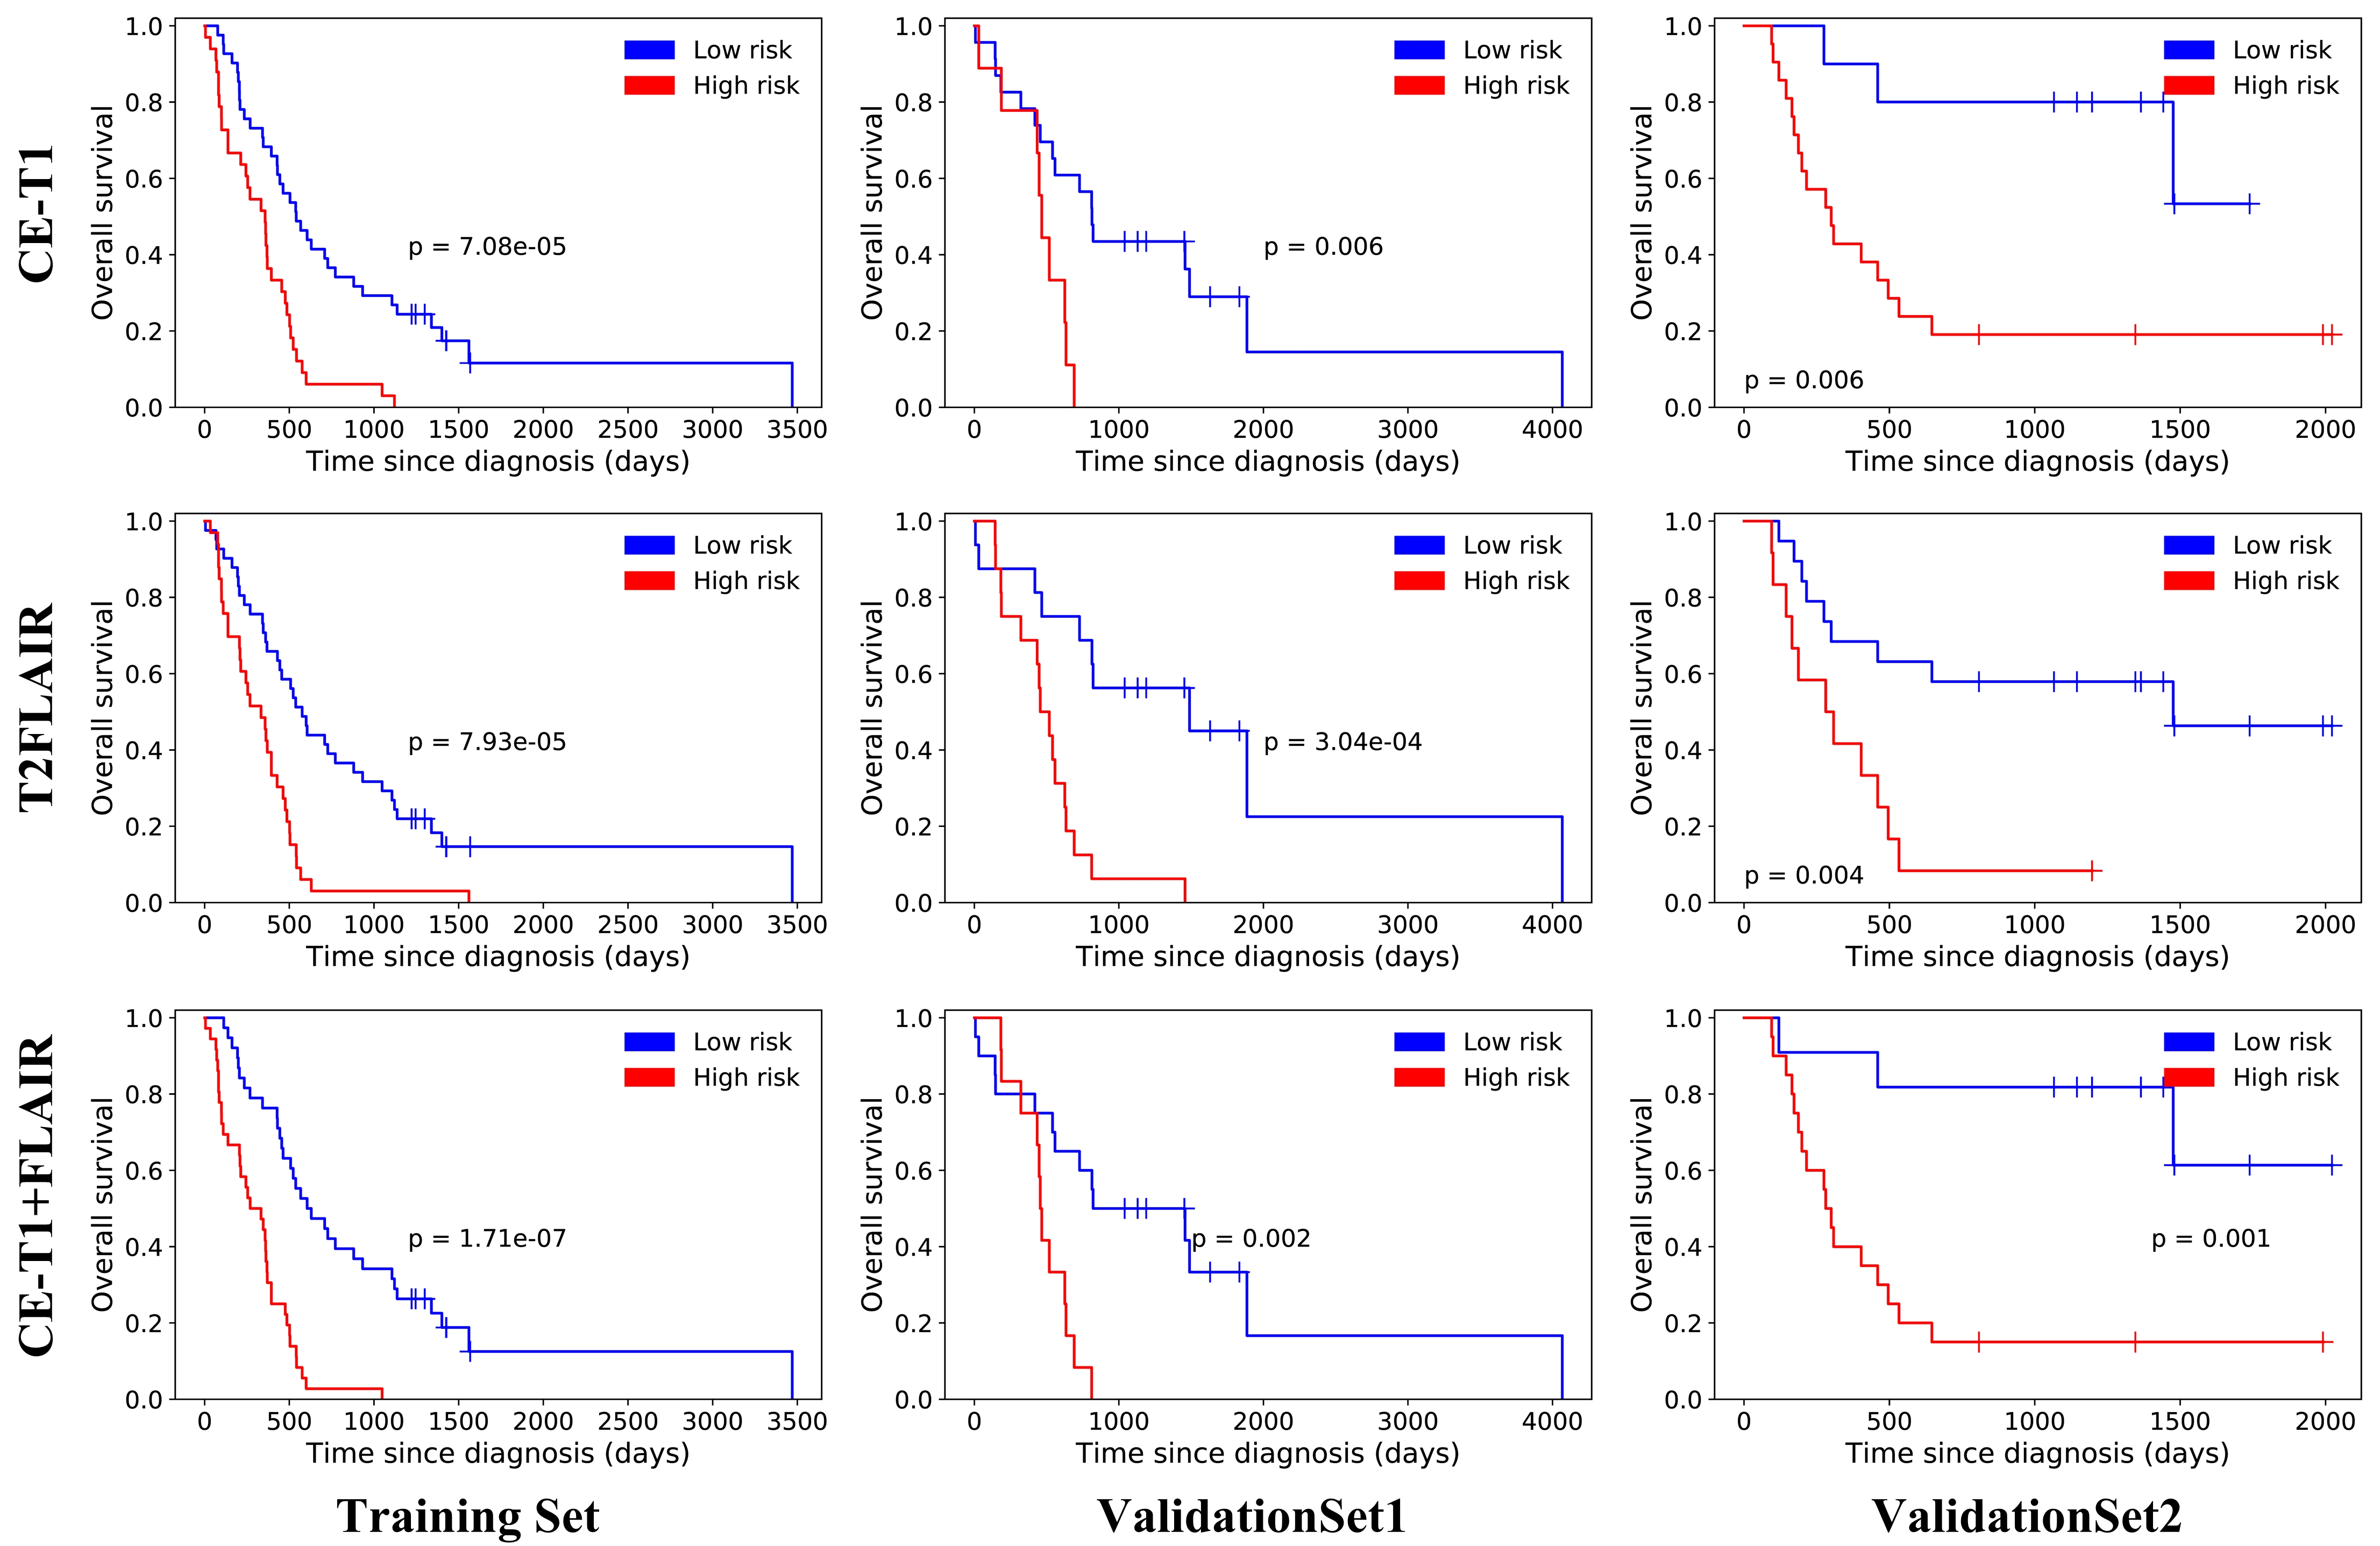
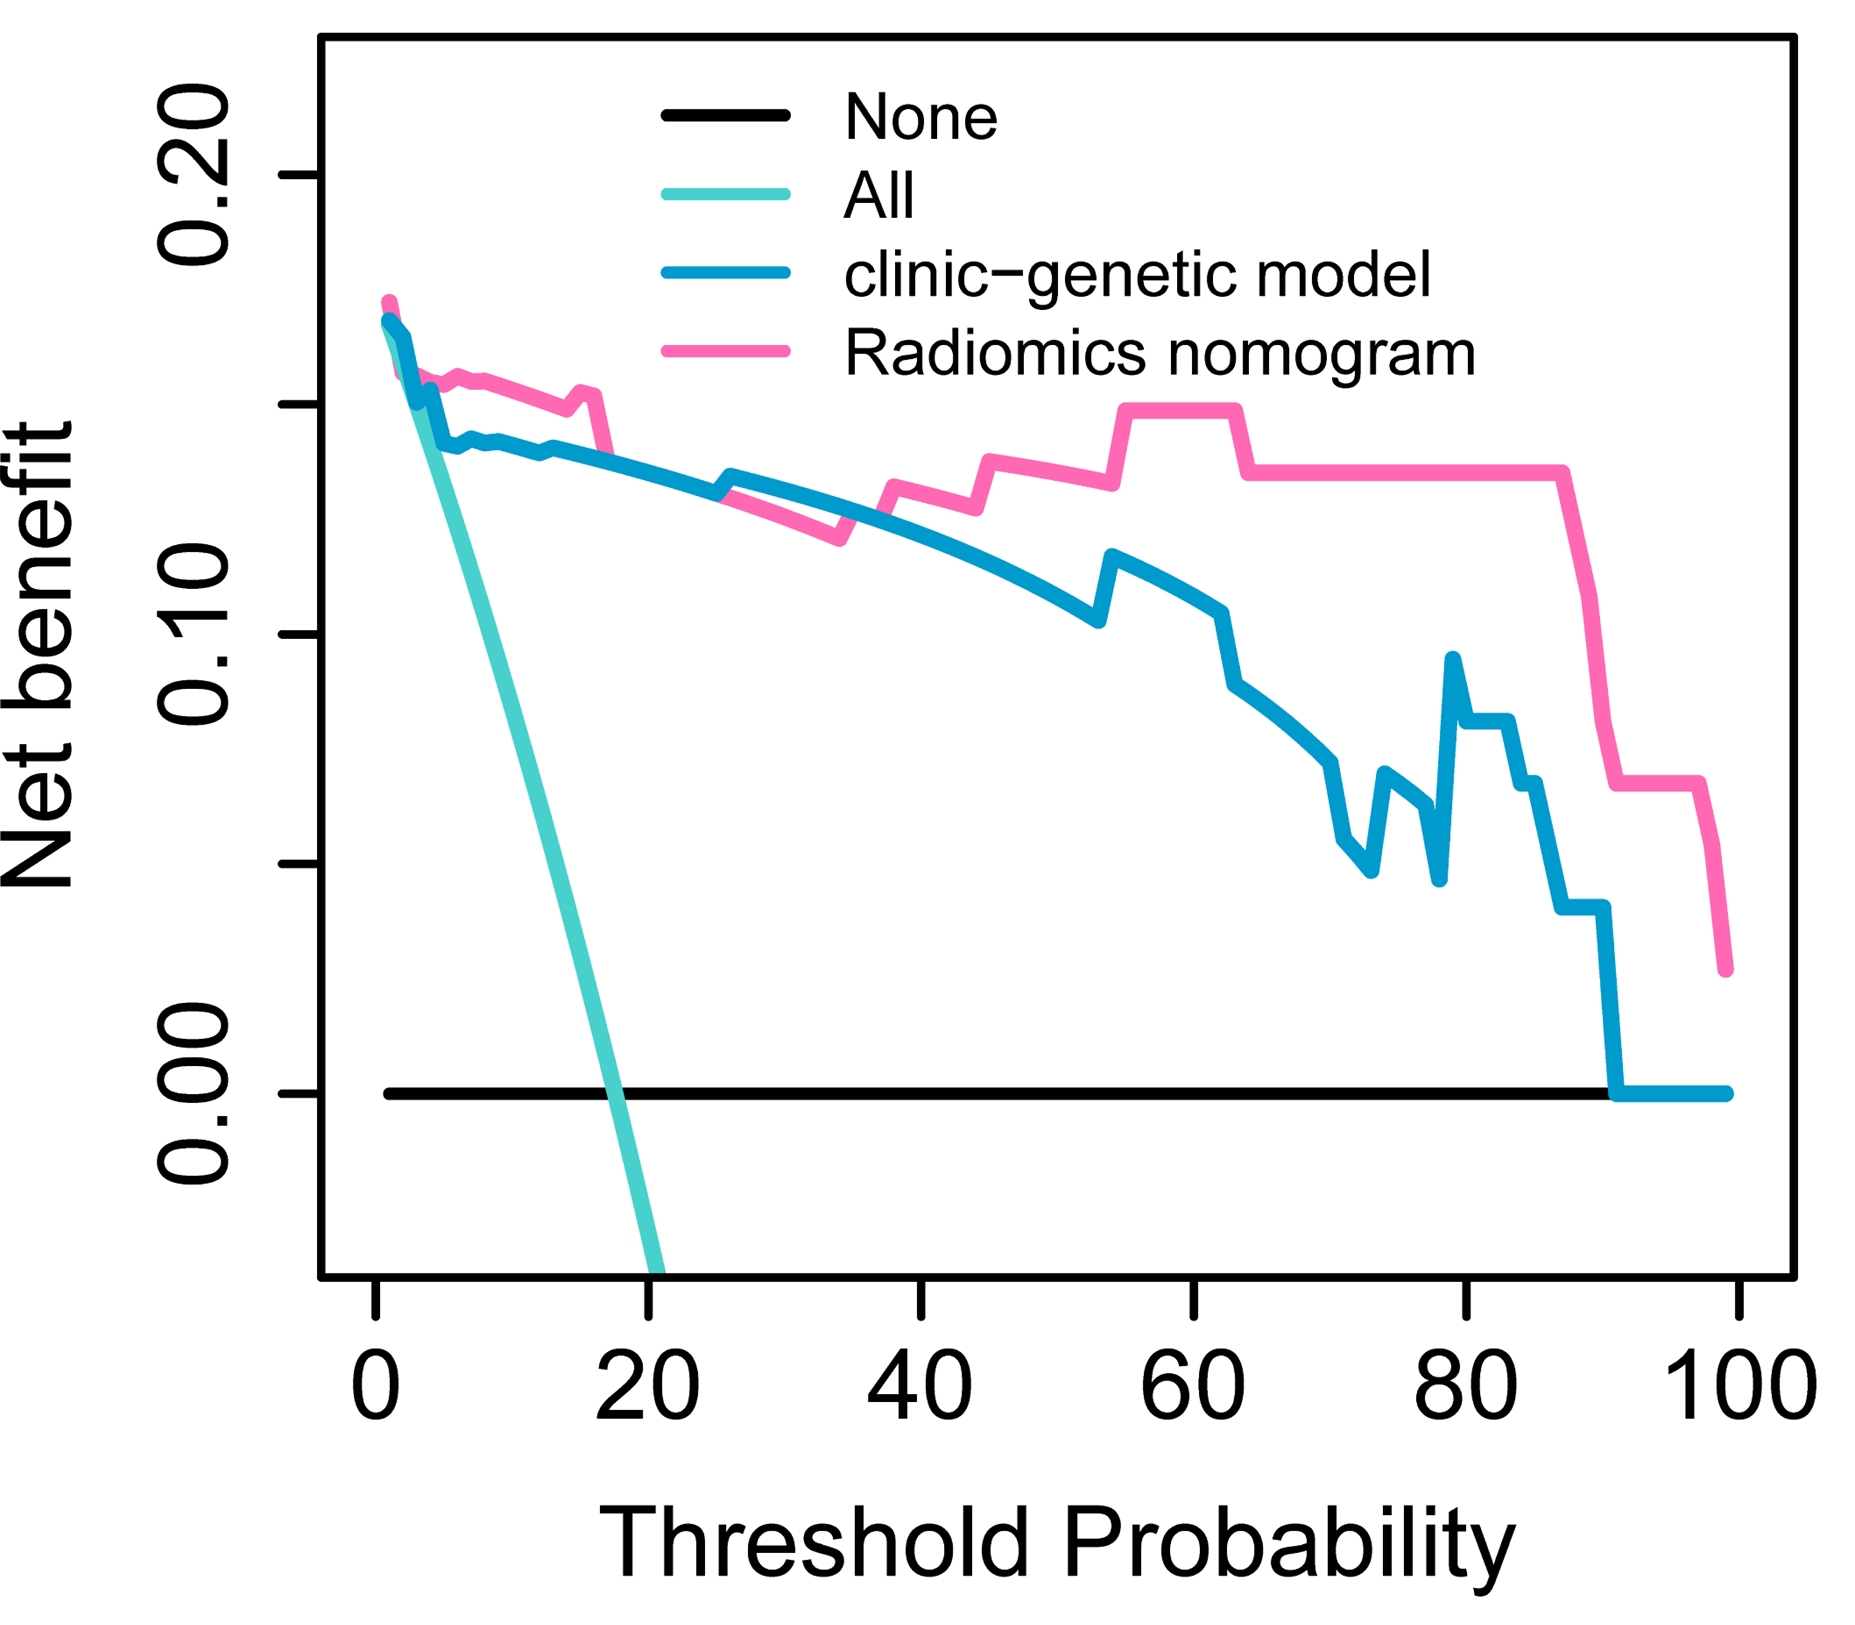
Seven CE-T1 features and six T2FLAIR features were identified with prognostic value using LASSO, based on which, seven features were selected to build the CE-T1+T2FLAIR signature. Kaplan-Meier survival analysis showed that CE-T1, T2FLAIR, and CE-T1+T2FLAIR radiomics signatures could provide statistically significant discrimination between high-risk and low-risk groups (Fig. 2). When the stratified analysis was performed based on different clinical and molecular risk factors, the CE-T1+T2FLAIR radiomics signature could further stratify high-risk and low-risk groups (Fig. 3).The univariate Cox model showed that younger age, non-GBM, IDH mutation, and MGMT promoter methylation were associated with a better prognosis (p = 0.010 for MGMT; p < 0.001 for others). The clinical-genetic model yielded C-index values of 0.735, 0.709 and 0.725 on the training set, ValidationSet1 and ValidationSet2 respectively. The radiomics nomogram incorporating CE-T1+T2FLAIR radiomics signature, IDH genotype, and age for OS was illustrated in Fig. 4. Compared with the clinic-genetic model, the radiomics nomogram showed a better discrimination performance with higher C-indexes on the training, internal validation, and external validation sets (C-index = 0.764, 0.731, and 0.761). The decision curve analysis showed that using the radiomics nomogram for survival added more benefit than using the clinic-genetic model if the threshold probability was higher than 40% (Fig. 5).
Discussion
In our study, a comprehensive radiomics analysis integrated MRI features, clinical characteristics and genetic information was performed to preoperatively predict the risk stratification of HGGs. The results showed that radiomics signature provided significant prognostic value for HGGs. This observation emphasizes that using a fusion signature combining different MRI features that describe different aspects of tumor appearance might capture hidden characteristics and offer insight into the heterogeneity of the microenvironment in tumors, and then create a more accurate model to predict the prognosis of HGGs. Compared with the clinical-genetic risk factors, our radiomics signature exhibited similar prognostic values. However, this technique has some special advantages such as noninvasive, lower cost and real-time prediction, which made it more suitable for clinical practice than the clinical-genetic model based on molecular testing.Our observation emphasizes that incorporating a radiomics analysis into clinical practice with clinical characteristics and genetic information could further improve the prognostic evaluation performance for patients with HGGs. Moreover, the incremental prognostic value of the radiomics signature beyond the key molecular biomarkers and clinical characteristics was also confirmed through a stratified analysis. Finally, to assist clinicians in predicting the survival of HGGs in a more convenient and quantitative manner, a nomogram was established to predict 1-year, 2-year and 3-year overall survival using age, IDH genotype, and CE-T1+T2FLAIR radiomics signature.
Conclusion
The radiomics signature allows risk stratification of patients with HGGs, and has incremental value to the key molecular biomarkers, providing a preoperative basis for individualized diagnosis and treatment decision-making of HGGs.Acknowledgements
This study was funded by the National Natural Science Foundation (81771824, 81471652, 11705112, 81701681, 81227901, 61231004, 81501616, 81671854 and 81771924); the Social Development Projects of Key R&D Program in Shanxi Province (201703D321016); the China Postdoctoral Science Foundation (2017M621108); the Precision Medicine Key Innovation Team Project (YT1601); the Natural Science Foundation of Shanxi Province (201601D021162); the National Key R&D Program of China (2017YFA0205200, 2017YFC1308700, 2017YFC1308701 and 2017YFC1309100); and the Science and Technology Service Network Initiative of the Chinese Academy of Sciences (KFJ-SW-STS-160).References
1. Louis DN, Ohgaki H, Wiestler OD, et al. The 2007 WHO classification of tumours of the central nervous system. Acta Neuropathol. 2007; 114:97-109.
2. Molenaar RJ, Verbaan D, Lamba S, et al. The combination of IDH1 mutations and MGMT methylation status predicts survival in glioblastoma better than either IDH1 or MGMT alone. Neuro-Oncology. 2014; 16:1263-1273.
3. Parsons DW, Jones S, Zhang X, et al. An integrated genomic analysis of human glioblastoma multiforme. Science. 2008; 321:1807-1812.
4. Hegi ME, Diserens AC, Gorlia T, et al. MGMT gene silencing and benefit from temozolomide in glioblastoma. New England Journal of Medicine. 2005; 352:997-1003.
5. Kickingereder P, Burth S, Wick A, et al. Radiomic profiling of glioblastoma: Identifying an imaging predictor of patient survival with improved performance over established clinical and radiologic risk models. Radiology. 2016; 280:880-889.
6. Kickingereder P, Neuberger U, Bonekamp D, et al. Radiomic subtyping improves disease stratification beyond key molecular, clinical and standard imaging characteristics in patients with glioblastoma. Neuro-Oncology. 2018; 20:848-857.
Figures