0400
Initial experience: detection of aberrant HP-13C metabolism in patients with glioblastoma prior to resection1Department of Radiology and Biomedical Imaging, University of California San Francisco, San Francisco, CA, United States, 2Department of Neurological Surgery, University of California San Francisco, San Francisco, CA, United States
Synopsis
Detection of [1-13C]pyruvate metabolism in GBM using hyperpolarized carbon-13 echo-planar imaging in a post-recurrence and pre-surgical setting
Introduction
Glioblastomas (GBM) are clinically recognized as the most malignant and heterogeneous brain tumors, whose conventional imaging is complicated by treatment-related changes that mimic disease progression1. In response to this challenge, hyperpolarized 13C (HP-13C) MR studies were designed to probe real-time [1-13C]pyruvate metabolism, which is enzymatically upregulated in GBM. While demonstrating safety and feasibility in treated patients2,3 and healthy controls4, HP-13C metabolic imaging techniques have thus far not been reported in the literature to distinguish primary GBM. This study relates the initial experience of detecting aberrant [1-13C]pyruvate metabolism in patients with pathologically-confirmed tumor prior to surgery.Methods
HP-13C and 1H Imaging. Dynamic HP-13C imaging was acquired from two patients with recurrent GBM after informed consent as part of a pre-operative MRI. A frequency-specific 2-D multislice EPI sequence5 (TR/TE=62.5ms/21.7ms, eight slices, 20 timepoints, 3s temporal resolution, 3 frequencies) utilizing SPSP excitation was run on a 3T MR750 scanner with 1.5 cm isotropic (3.38 cm3) spatial resolution and a constant through time 𝛼pyruvate/𝛼lactate/𝛼bicarbonate = 20o/30o/30o flip angle scheme. A dual-tuned 24/8-channel 13C/1H phased-array receiver (RAPID Biomedical, Germany) with integrated 13C birdcage transmitter enabled seamless integration of HP-13C to SOC preoperative MRI (Figure 1A). Transmit gains were calibrated on an ethylene glycol head phantom using a FID sequence and an embedded 1mL 8M 13C-urea sample provided in vivo frequency referencing: fpyruvate = furea + 270 Hz. Proton imaging included DSC perfusion, atlas-based long-echo MRSI, and DWI with b=2000s/mm2.Polarization and injection. Dynamic nuclear polarization of [1-13C]pyruvate was performed on a SPINlab system (Figure 1B), as previously described methods2. In brief, 1.47g [1-13C]pyruvic acid and 15mM trityl radical were polarized in a sterile fluid path for 2.5 hr. At the time of dissolution, an integrated quality control (QC) system measured the pH, temperature, EPA concentration, and polarization parameters. Upon pharmacist release, a 0.43mL/kg dose of [1-13C]pyruvate was injected intravenously at 5mL/s, followed by a 20mL saline flush. Imaging began after a 5s delay.
Post-processing. EPI data were prewhitened6 and channel-combined using complex weights derived from fully sampled pyruvate signal7. After phasing the complex data, summing the dynamic metabolite series through time, and thresholding SNR>5, AUC ratio maps of lactate-to-pyruvate were calculated. Non-enhancing lesion (NEL), contrast-enhancing lesion (CEL), and normal-appearing white matter (NAWM) were segmented9 from 3-D FLAIR and T1-weighted images. Carbon-13 data voxels containing >20% CEL, >50% NEL, and >50%NAWM were considered in the subsequent analysis.
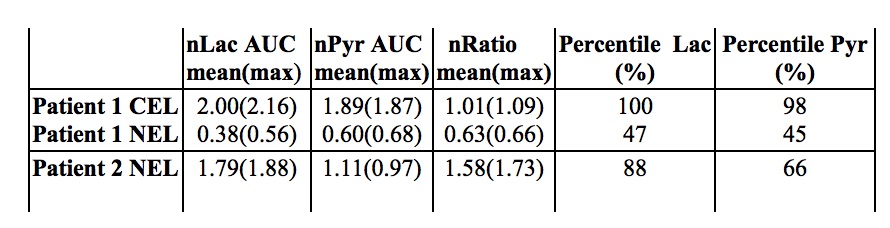
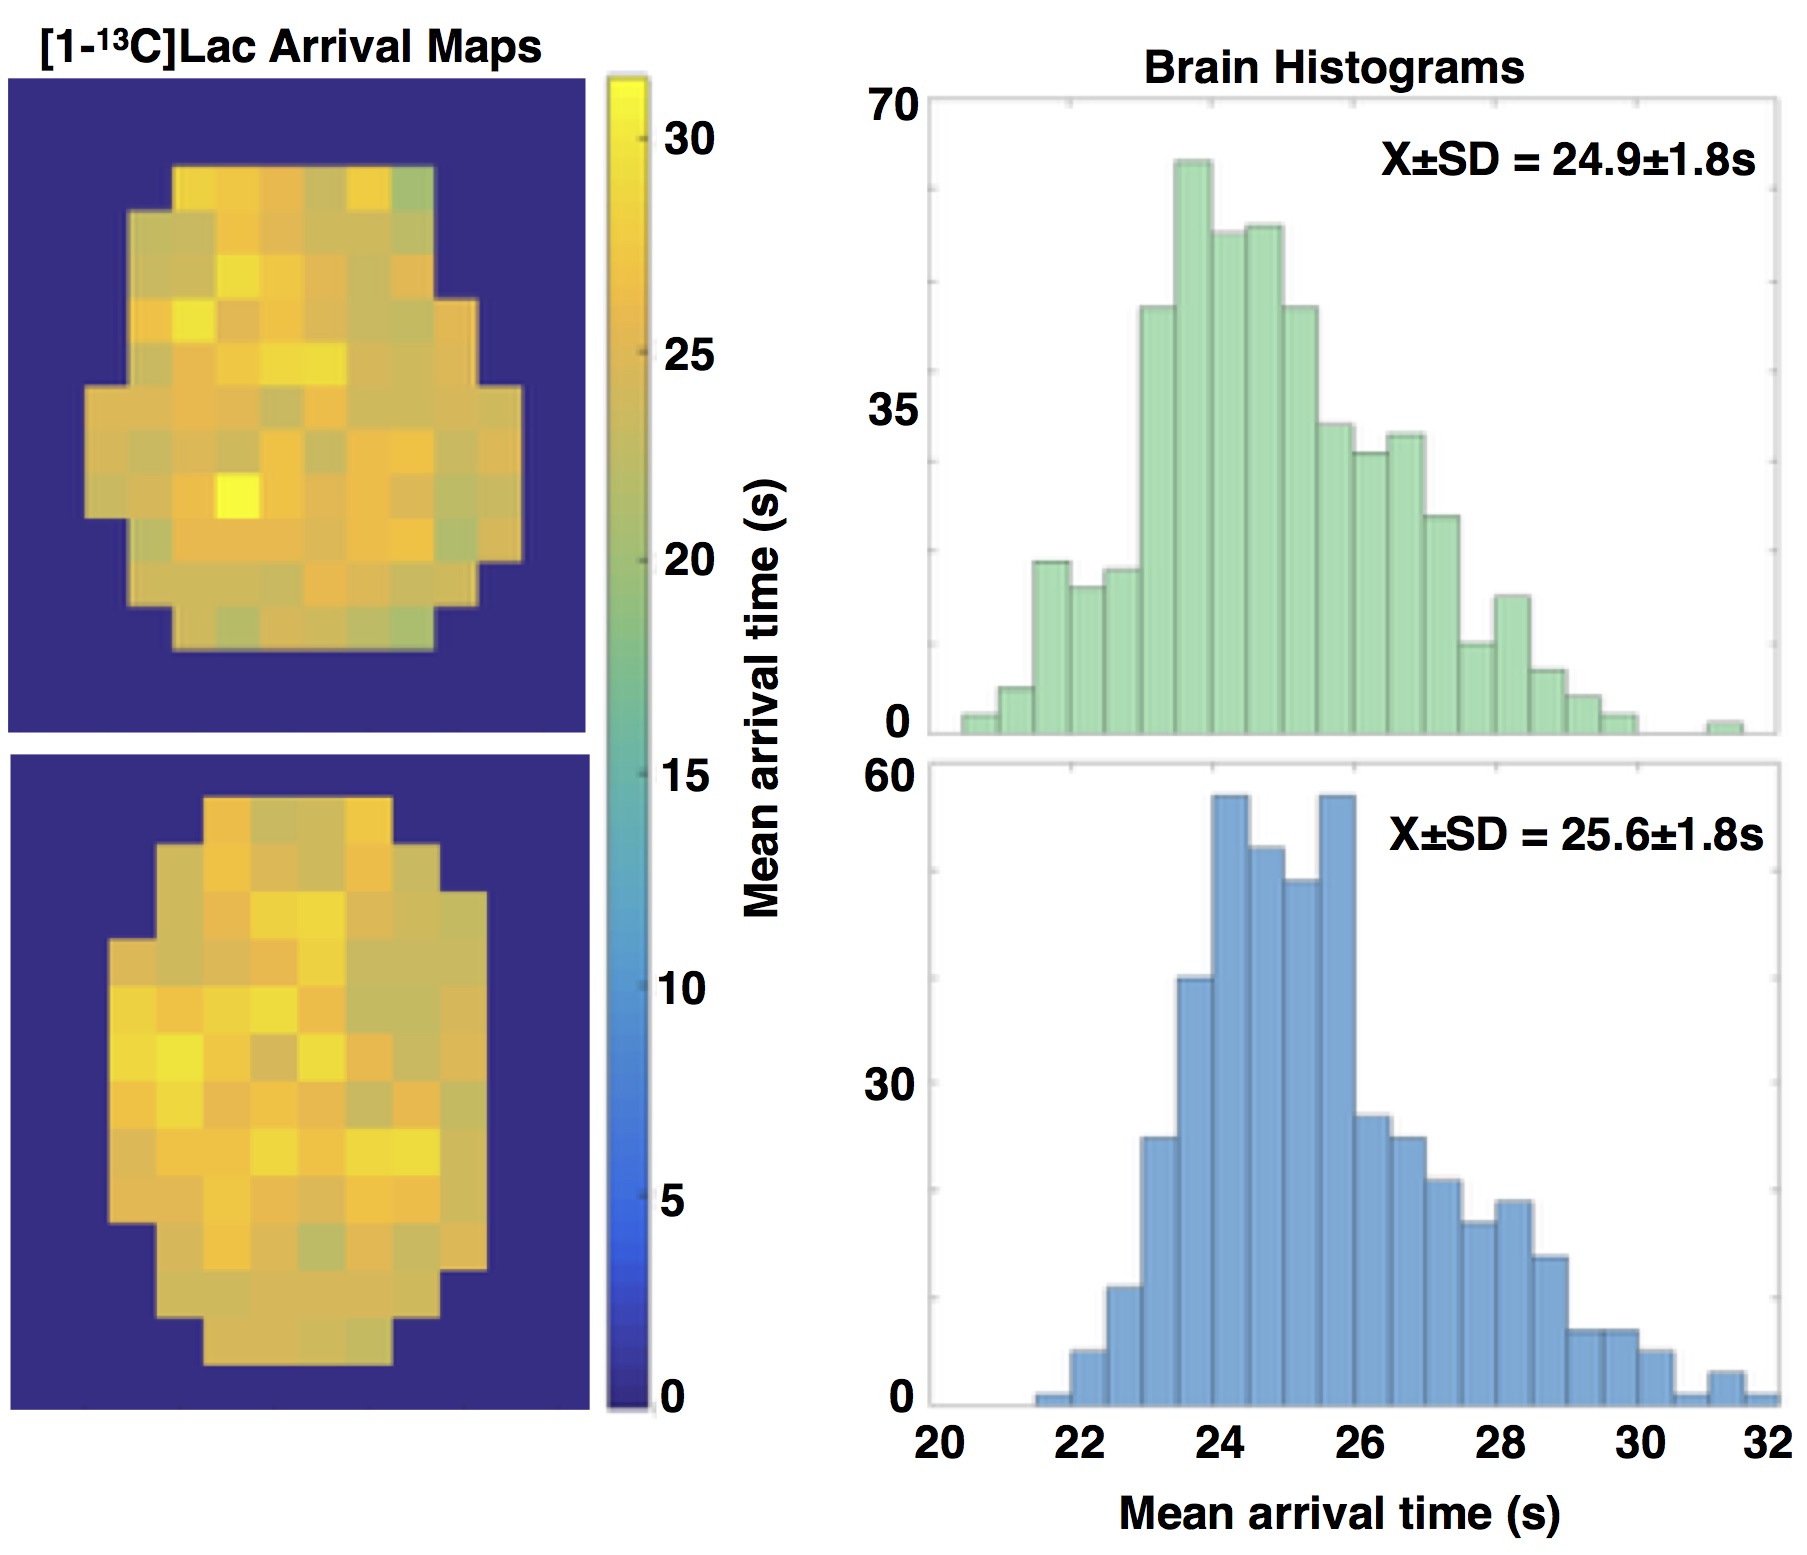
Analysis. HP-13C metabolite data within the CEL and NEL were normalized (nLac, nPyr, nRatio) with respect to matching regions of interest in the contralateral hemisphere of the brain to enable comparisons. Percentile values for AUC data were also calculated over the entire brain volume as a measure of irregular features. Mean arrival time maps were estimated from the dynamic data.
Results
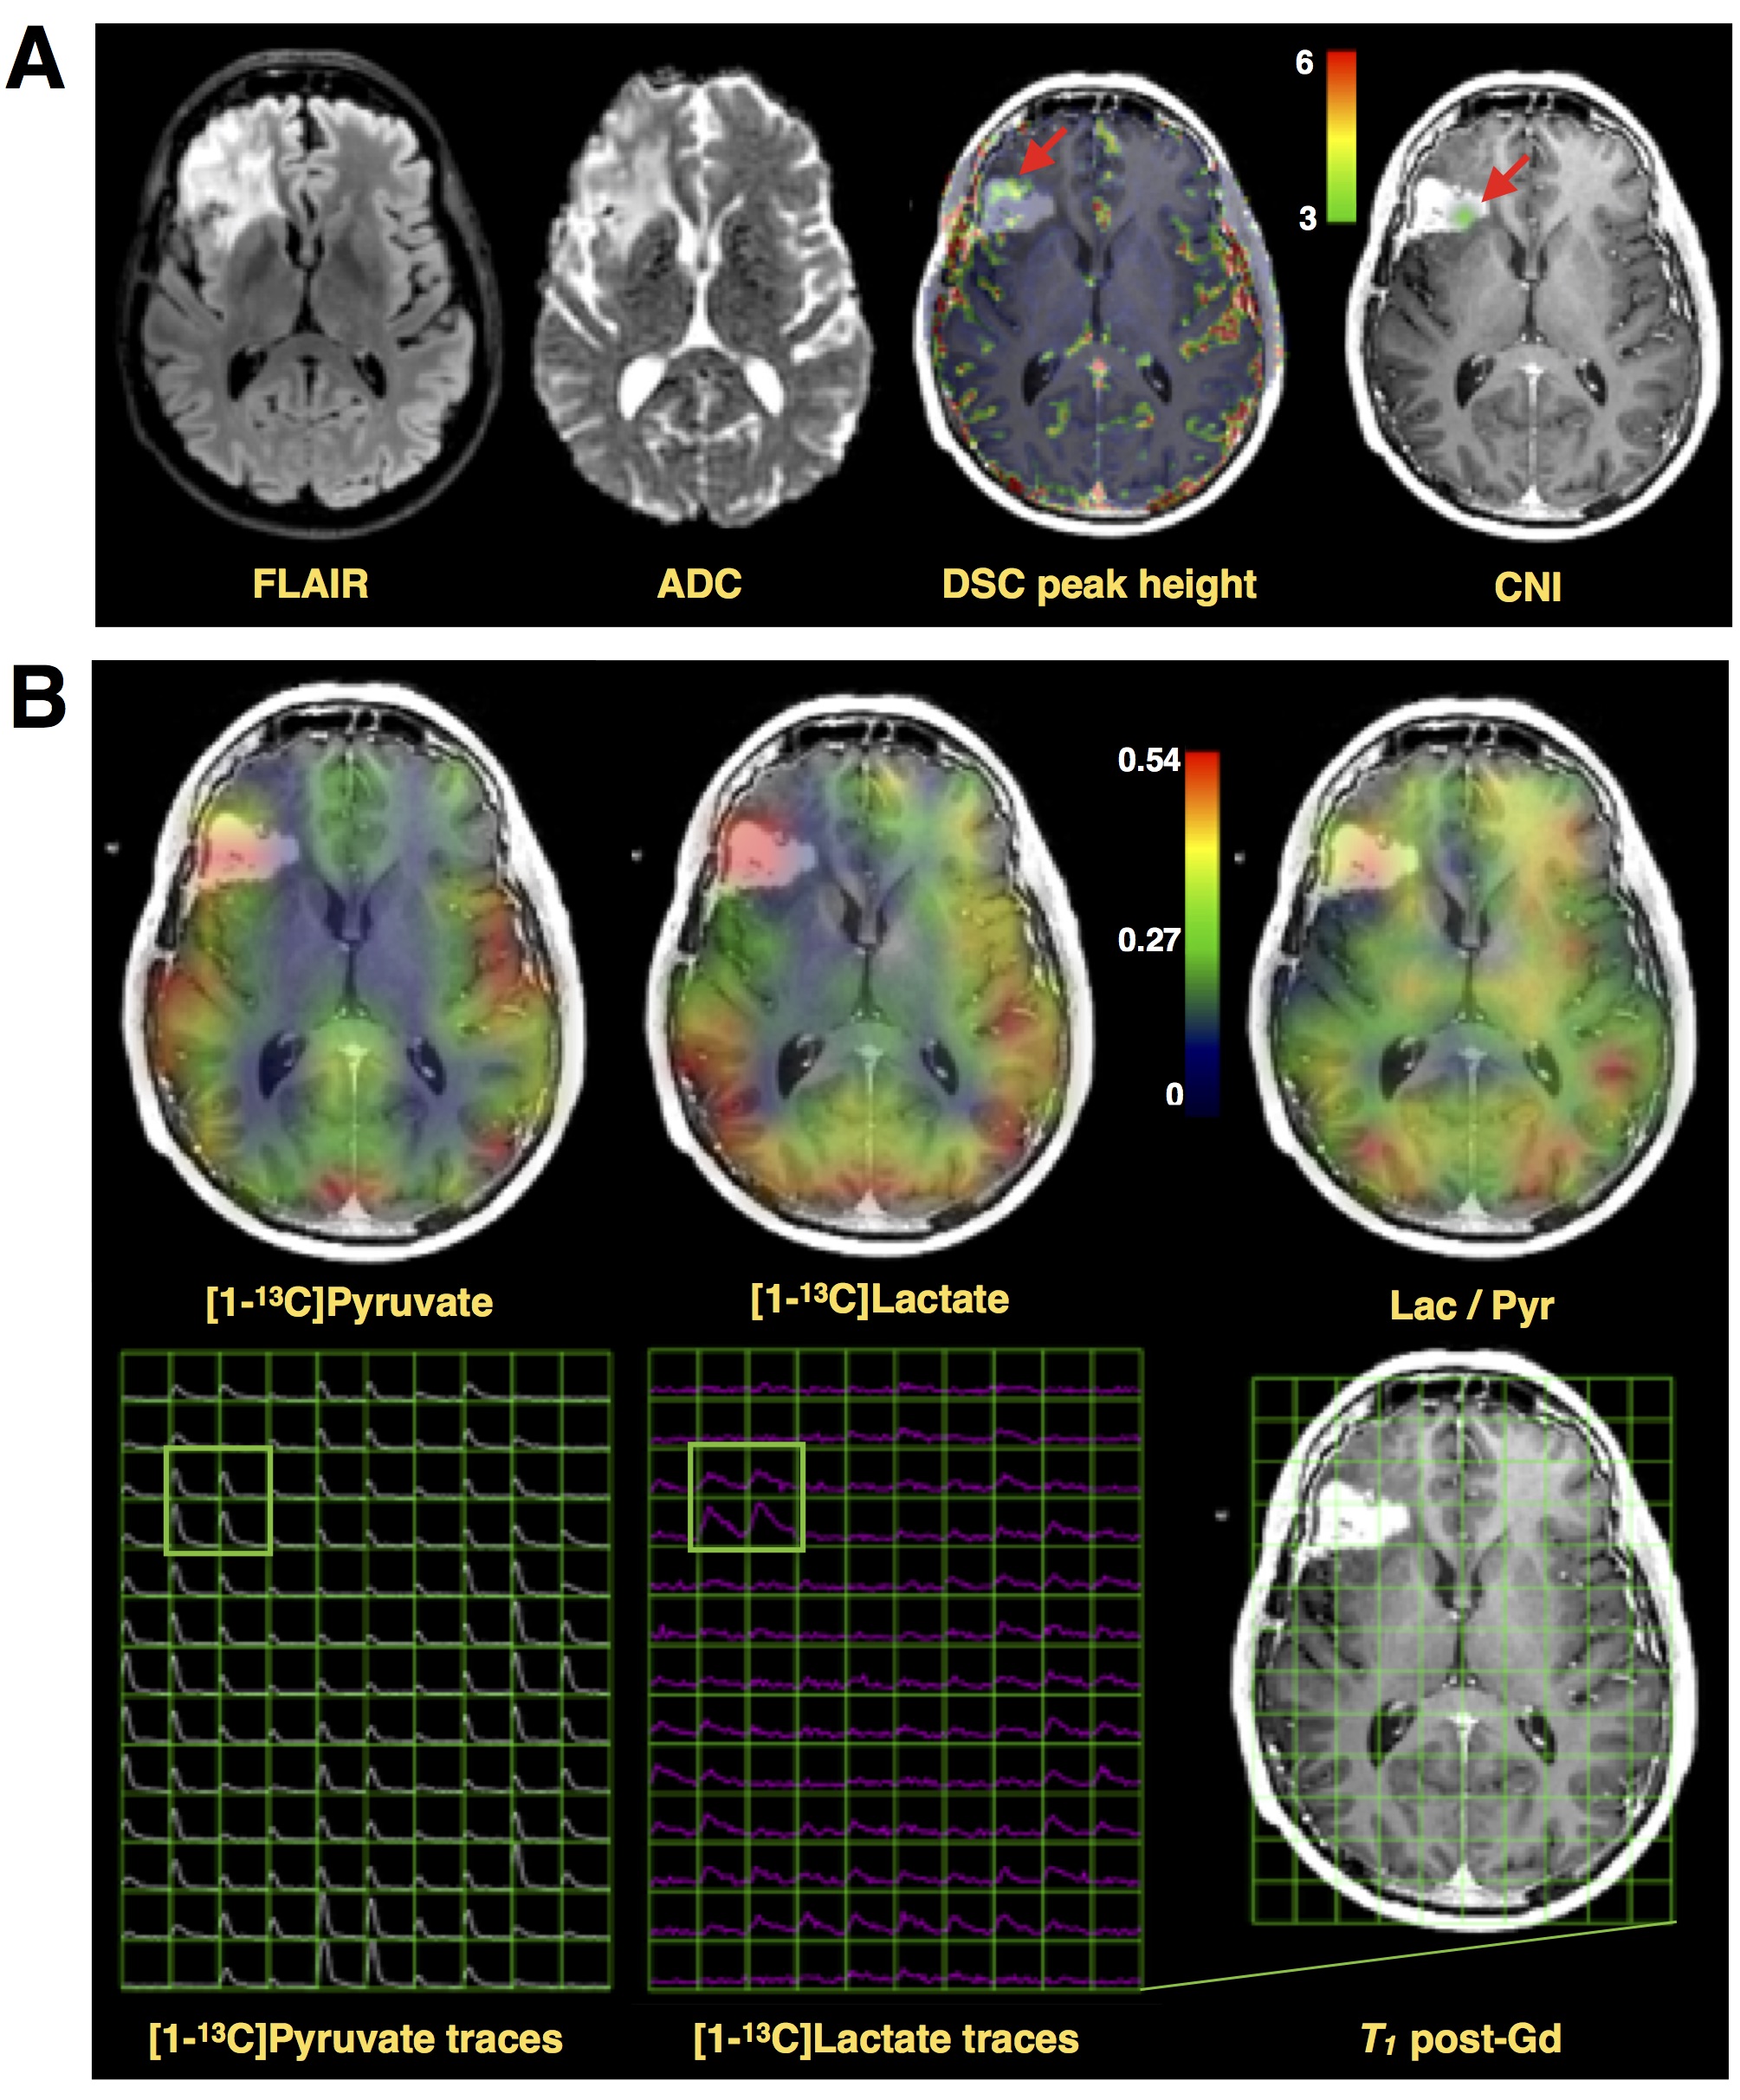
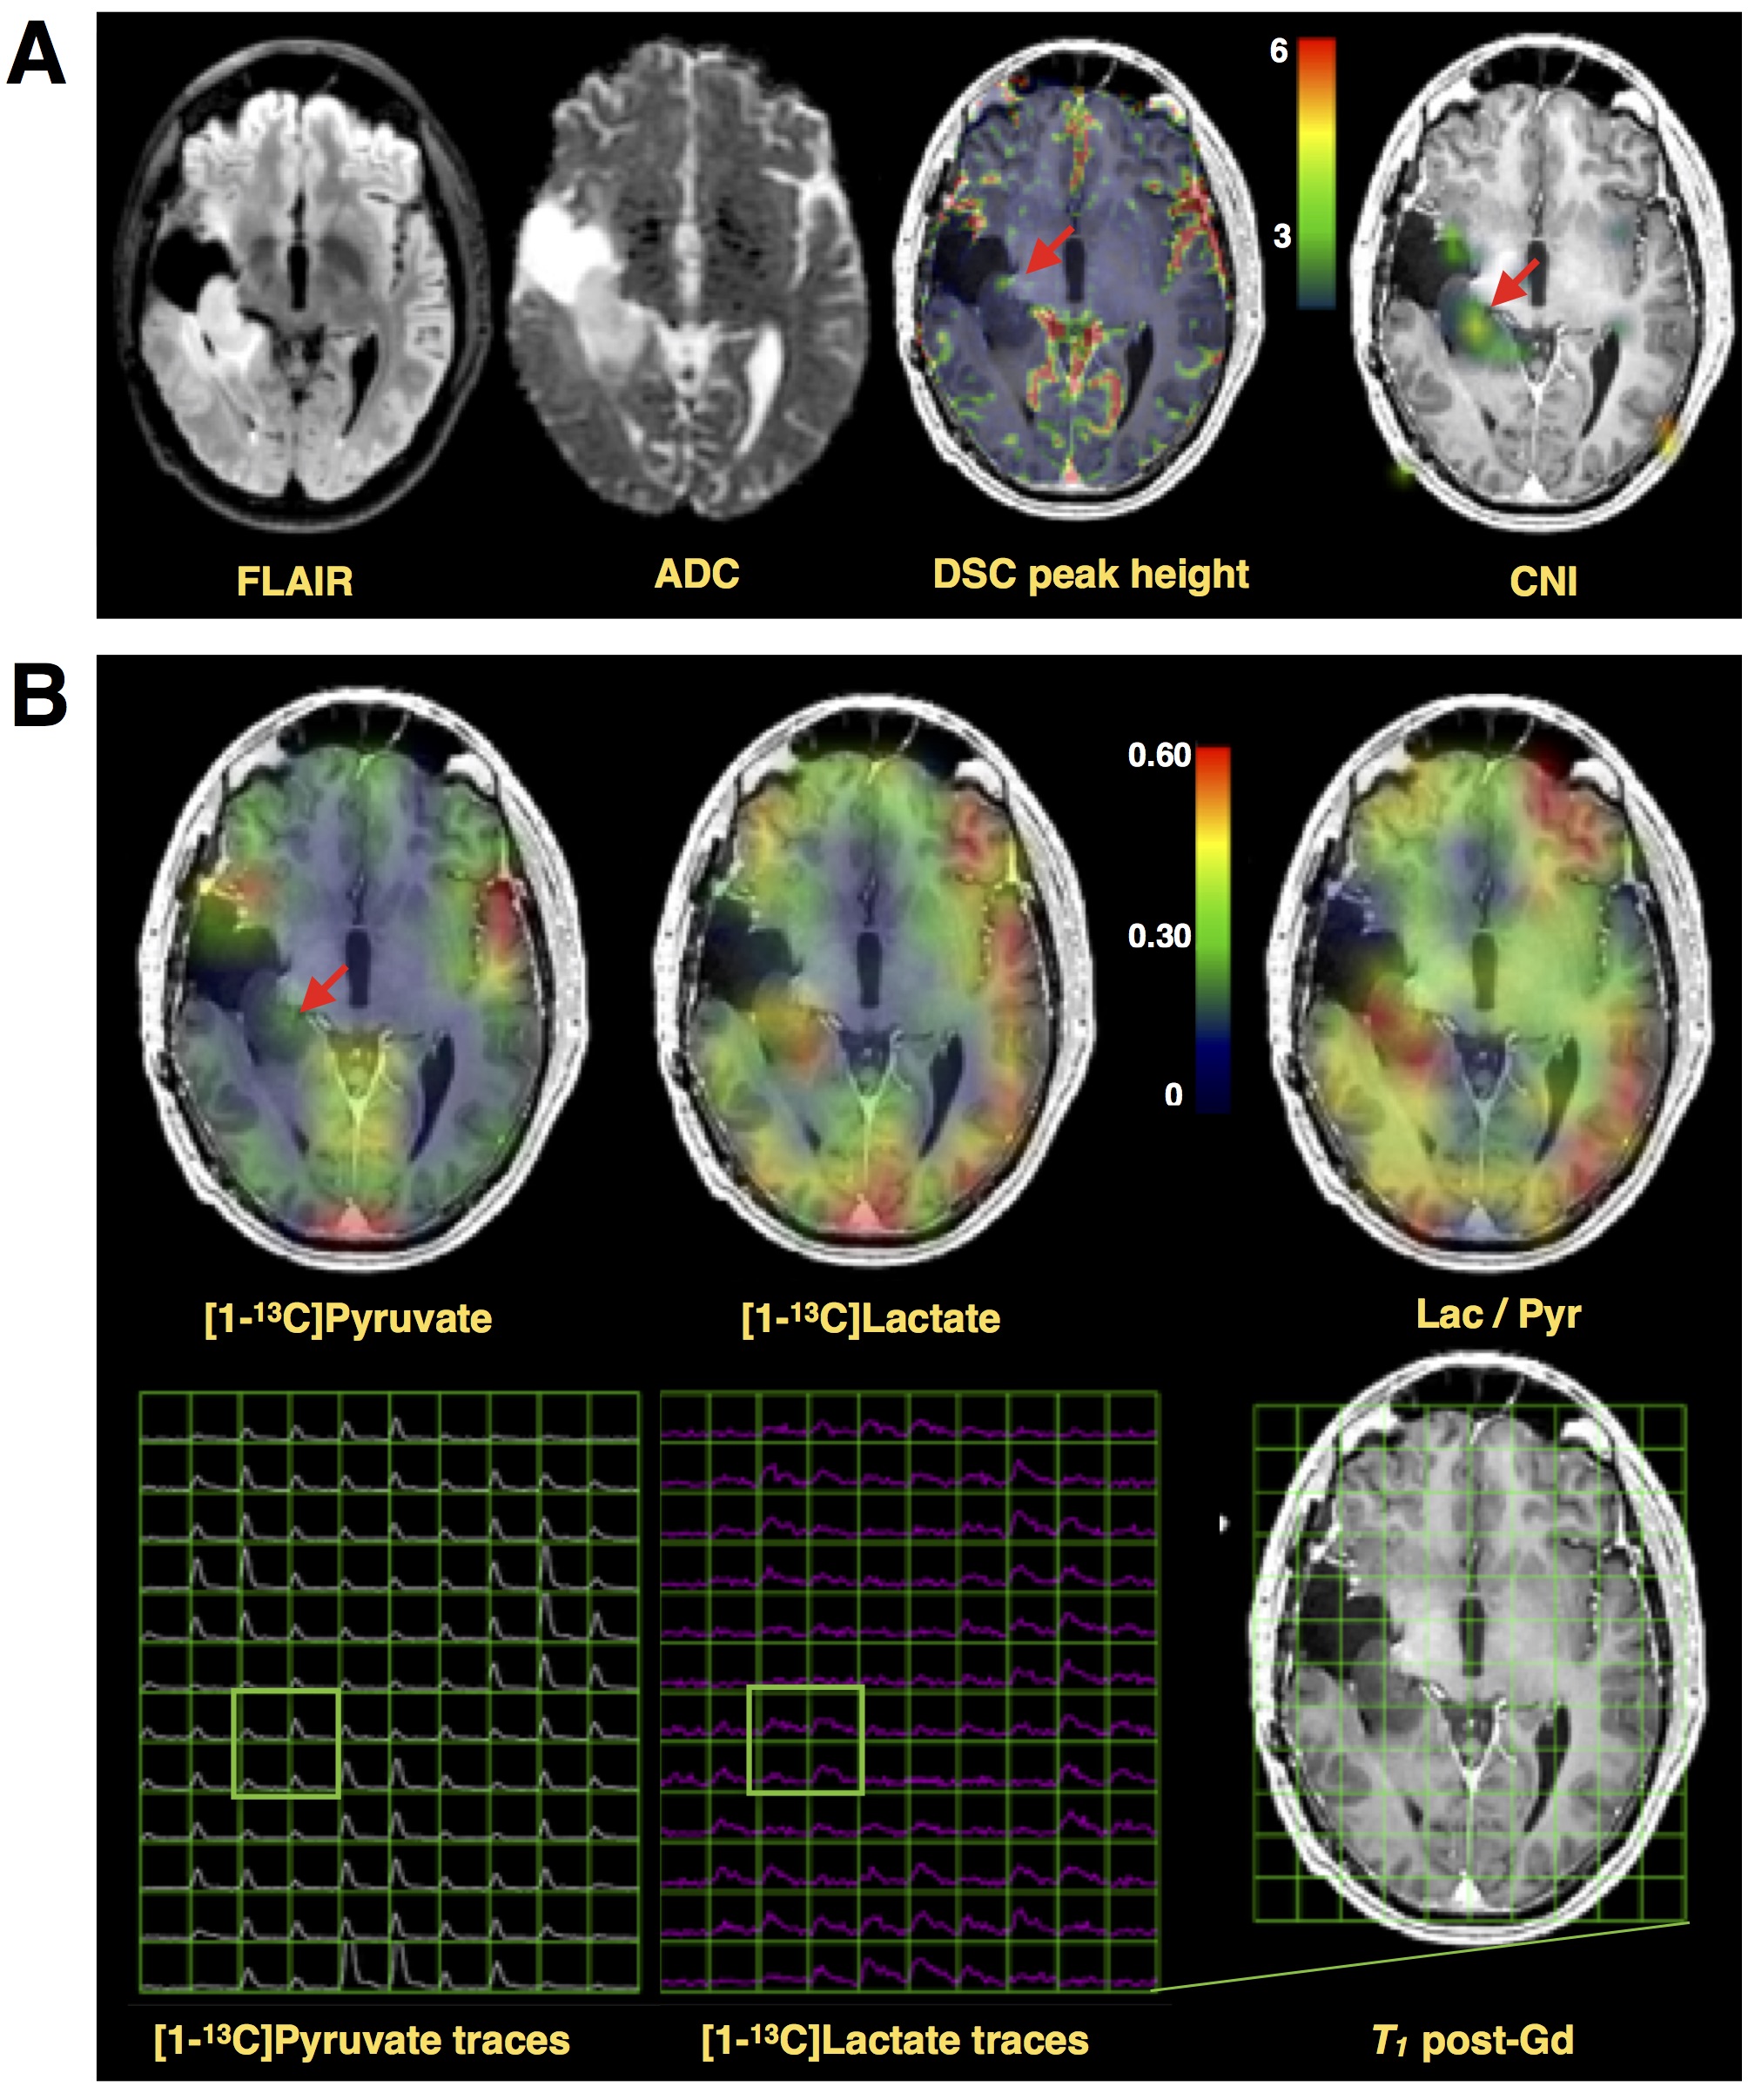
While Patient#1 presented with a Gd-enhancing lesion (12 cm3 CEL/ 38 cm3 NEL) that is characteristic of GBM, Patient#2 showed a relatively large and circumscribed non-enhancing lesion (28 cm3 NEL), which contained negligible enhancement (<1cm3 CEL). Figure 2A illustrates the proton imaging features that are commonly associated with malignant disease, including elevated diffusion, increased perfusion, and a spectroscopic abnormality delineated by choline-to-N-acetylaspartate (CNI) indices. The same region highlighted by proton imaging is shown in Figure 2B to have irregular [1-13C]pyruvate metabolism from HP-13C EPI. An asymmetric increase in both the [1-13C]pyruvate and [1-13C]lactate in the dynamic traces is reflected in the corresponding AUC maps, however the ratio of [1-13C]lactate-to-[1-13C]pyruvate provides less imaging contrast for the putative tumor, which was pathologically confirmed upon surgical resection. Patient#2 shows a similar increase in diffusion and perfusion within the non-enhancing lesion, together with a more pronounced metabolic abnormality, as measured by CNI (Figure 3A). In contradistinction with the other patient, the AUC metabolite data are subtle in appearance near the lesion, though still asymmetric compared to the contralateral hemisphere. Although the AUC data were not independently conspicuous on imaging, their ratio is shown to highlight the irregular metabolism of the non-enhancing lesion. Both patients demonstrated similar lactate-to-pyruvate ratios within normal-appearing white matter (Patient#1/Patient#2=0.34±0.13/0.34±0.14). Patient 1 showed a mean lactate-to-pyruvate ratio of 0.40±0.09 in the CEL and lower value of 0.23±0.09 in the NEL; whereas Patient 2 had a mean lactate-to-pyruvate ratio of 0.49±0.14 in the NEL. Figure 4 shows the supporting lesion data normalized with respect to the contralateral hemisphere, which again illustrate that the ratio is most important for visualizing the abnormality in Patient#2 and the AUC data is most relevant for distinguishing the abnormality in Patient#1. Both patients displaye 88-100 percentile AUC lactate and Patient#1 showed 98 percentile AUC pyruvate. Mean arrival times for lactate are shown in Figure 5 and indicate some differences between across patients and lesions.Discussion and Conclusion
These HP-13C data show that aberrant metabolism can be detected in GBM. Of interest is that both contrast-enhancing and non-enhancing lesions manifest detectable contrast relative to the surrounding tissues.Acknowledgements
No acknowledgement found.References
1. Hygino da Cruz LC Jr1, Rodriguez I, Domingues RC, Gasparetto EL, Sorensen AG.Pseudoprogression and pseudoresponse: imaging challenges in the assessment of posttreatment glioma. AJNR Am J Neuroradiol. 2011, 32(11):1978-85 2.
2. Park I, Larson PEZ, Gordon JW, Carvajal L, Chen HY, Bok R, Van Criekinge M, Ferrone M, Slater JB, Xu D, Kurhanewicz J, Vigneron DB,Chang S, Nelson SJ. Development of methods and feasibility of using hyperpolarized carbon-13 imaging data for evaluating brain metabolismin patient studies. Magn Reson Med. 2018; 80(3):864-873 3.
3. Miloushev VZ, Granlund KL, Boltyanskiy R, Lyashchenko SK, DeAngelis LM, Mellinghoff IK, Brennan CW, Tabar V3,6, Yang TJ, Holodny AI, Sosa RE, Guo YW, Chen AP, Tropp J, Robb F, Keshari KR. Metabolic Imaging of the Human Brain with Hyperpolarized C Pyruvate Demonstrates C Lactate Production in Brain Tumor Patients. Cancer Res. 2018; 78(14): 3755-3760
4. Grist JT, McLean Mary, Riemer Frank, Schulte RF, Deen SS, Zaccagna F, et al. Quantifying normal human brain metabolism using hyperpolarized [1-13C]pyruvate and magnetic resonance imaging. NeuroImage 2019, 189: 171-179
5. Gordon JW, Vigneron DB, and Larson PEZ. Development of a Symmetric Echo Planar Imaging Framework for Clinical Translation of Rapid Dynamic Hyperpolarized C Imaging. Magn Reson Med. 2017; 77: 826–832
6. Hansen MS. Parallel Imaging Reconstruction I: Cartesian. Proc. Intl. Soc. Mag. Reson. Med. 18 (2010) 7. Zhu Z, Zhu X, Ohliger M, Cao P, Tang S, Cao P, Carvajal L, Autry A, Li Yan, et al Coil combination methods for multi-channel hyperpolarized 13C imaging data from human studies. JMR 2019; 301: 73-39 8. Pruessmann KP, Wieger M, Boernert P, Boesiger P. Advances in sensitivity encoding with arbitrary k‐space trajectories. Magn Reson Med. 2001;46:638–651.
Figures