0399
Discrimination between lower-grade glioma and glioblastoma with amide proton transfer and diffusion kurtosis imaging at 3 Tesla1Paul C. Lauterbur Research Center for Biomedical Imaging, Shenzhen Institutes of Advanced Technology, Chinese Academy of Sciences, Shenzhen, China, 2Department of Neurosurgery, Sun Yat-Sen University Cancer Center, Guangzhou, China, 3Department of Medical Imaging, Sun Yat-Sen University Cancer Center, Guangzhou, China, 4GE Healthcare, Beijing, China
Synopsis
Preoperative assessment of histological tumor characteristics plays an essential role in evaluating prognosis and optimizing therapeutic strategies for glioma patients. This study aims to evaluate the feasibility of DKI and APT in differentiating lower-grade glioma (LGG) from glioblastoma at 3T. Twenty-four untreated patients were recruited and classified into LGG (grade II and III, N=10) and glioblastoma (grade VI, N=14). Results show comparable diagnostic performance of APTw and MK in differentiating the two groups with AUCs>0.85, superior to other DKI indices. Combining them further improves the discrimination accuracy, that may greatly facilitate prompt diagnosis and treatment decisions.
Introduction
Preoperative assessment of histological tumor characteristics plays an essential role in evaluating prognosis and optimizing therapeutic strategies for glioma patients [1]. Several advanced MR techniques have proved to be valuable in the discrimination of glioma grades, such as diffusion kurtosis imaging (DKI) and amide proton transfer (APT) imaging. Briefly, DKI, an advanced diffusion model without the assumption of Gaussian distribution, shows good diagnostic accuracy in glioma grading with its derived parameter of mean kurtosis (MK) [2]. Recently, APT, that can probe the chemical exchange saturation transfer (CEST) effect between endogeneous protein/peptide amide protons and bulk water, has been increasingly employed for tumor grading [3]. This study aims to evaluate the diagnostic performance of DKI and APT in differentiating lower-grade gliomas (LGG) from glioblastoma in a cohort of untreated patients at 3 Tesla.Materials and methods
Patient recruitment: The study was approved by local institutional ethics committee, and written informed consent was obtained from all patients. A total of 24 patients (14 males, 49.25±13.38 years old) were recruited with the inclusion criteria of: (1) a suspected intracranial occupying lesion on routine MRI; (2) without any treatment; (3) had surgical resection with histological examination. Glioma grade was determined based on the 2016 WHO classification of central nervous system tumors [4]. The numbers of patients with grade II, III gliomas and glioblastoma were 6, 4 and 14, respectively. Patients with grade II and III were classified in LGG as defined previously [5].MRI study: All images were acquired on a 3T MR scanner (SIGNA Pioneer, GE, USA). MR imaging was performed as: DKI (TR = 10 s, TE = 96 ms, spatial resolution = 0.94×0.94×5 mm3, b-values = 0, 1000 and 2000 s/mm2, diffusion direction number = 25), APT imaging (TR = 4.0 s, TE = 26.6 ms, 4 saturation pulses with duration of 500 ms, average B1 of 2.0 μT, spatial resolution = 1.7×1.7×8 mm3, 54 CEST-weighted images including 3 unsaturated M0 were acquired with frequency offsets equally spanned between ± 600 Hz with respective to the water resonance), and Gd-enhanced T1w imaging (TR = 240 ms, TE = 2.6 ms, spatial resolution = 0.47×0.47×6 mm3) that was conducted 5 minutes later after intravenous injection of the contrast agent.
Data analysis: The DKI data were processed using the Diffusion Kurtosis Estimator (DKE) [6], from which four indices of fractional anisotropy (FA), kurtosis FA (KFA), mean diffusivity (MD) and MK were calculated, respectively. For APT data, normalized Z-spectrum (Z) was corrected for B0 inhomogeneity by shifting the minimum of the Z-spectrum to the water resonance. APT-weighted effect was calculated with the asymmetric analysis, as APTw=Z(-3.5 ppm)-Z(3.5 ppm). 2-6 ROIs (according to the lesion size, ~50 mm2 each) were positioned on Gd-enhanced area and contralateral normal appearing white matter (CNAWM) by experienced neuroradiologists with conventional MR images as reference. Then the ROIs were transferred to co-registered DKI metrics and APTw maps. Values were averaged across slices and among patients for each group.
Statistical analysis: An unpaired Student’s t-test was performed between different groups, and a paired student’s t-test was used between tumor and CNAWM within each group. The receiver operating characteristic (ROC) curve was plotted [7]. The optimal cutoff value was determined by maximizing the sum of sensitivity and specificity. Multivariate logistic regression analysis was used to evaluate the diagnostic performance of combined MR techniques. P<0.05 was regarded as statistically significant.
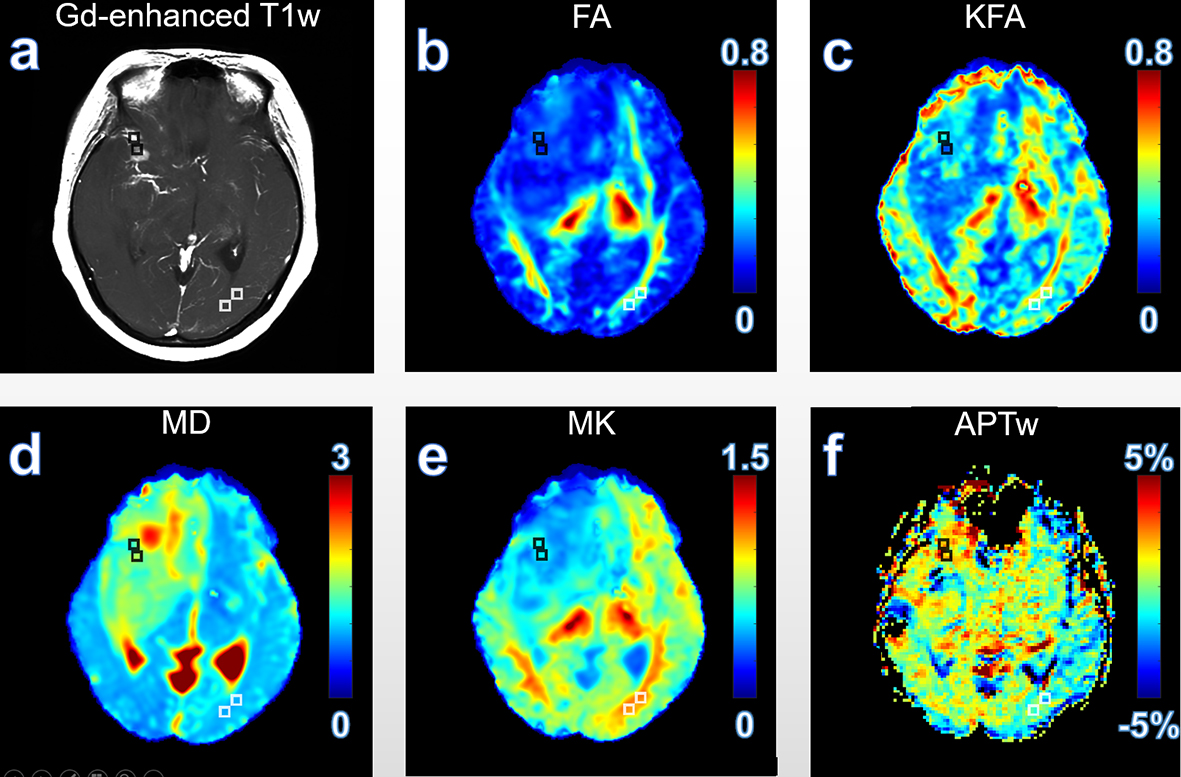
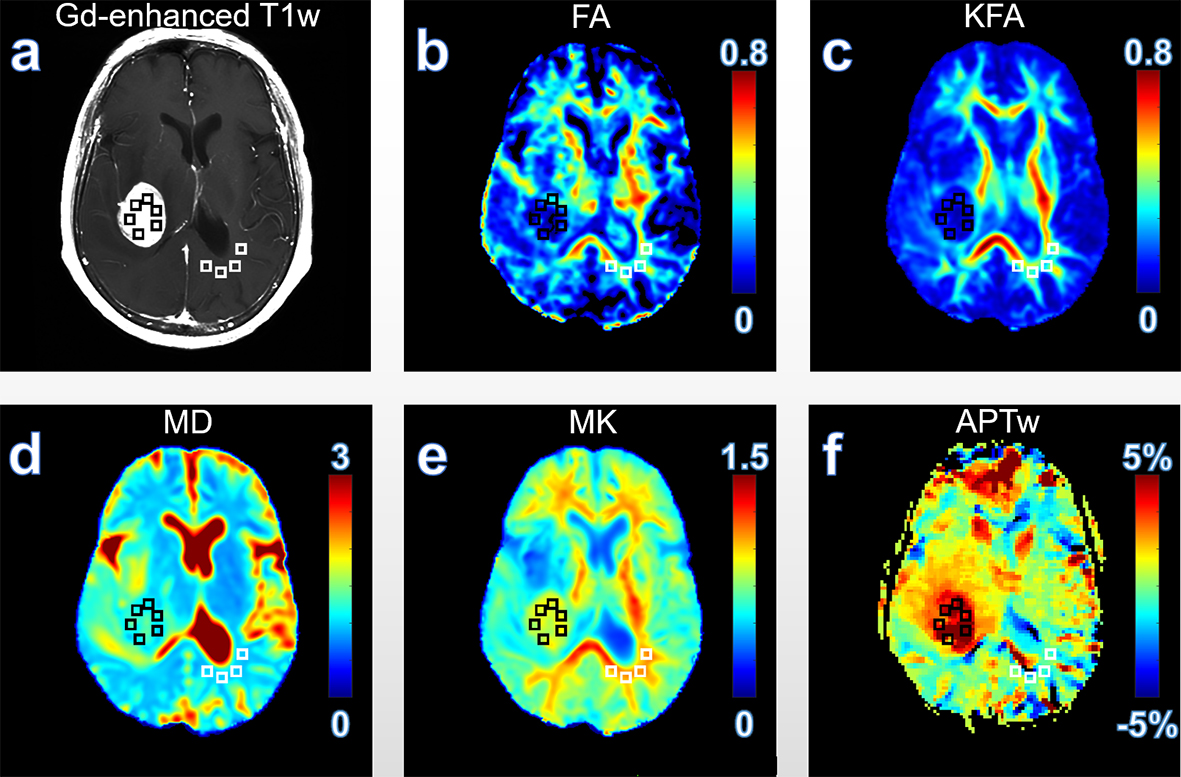
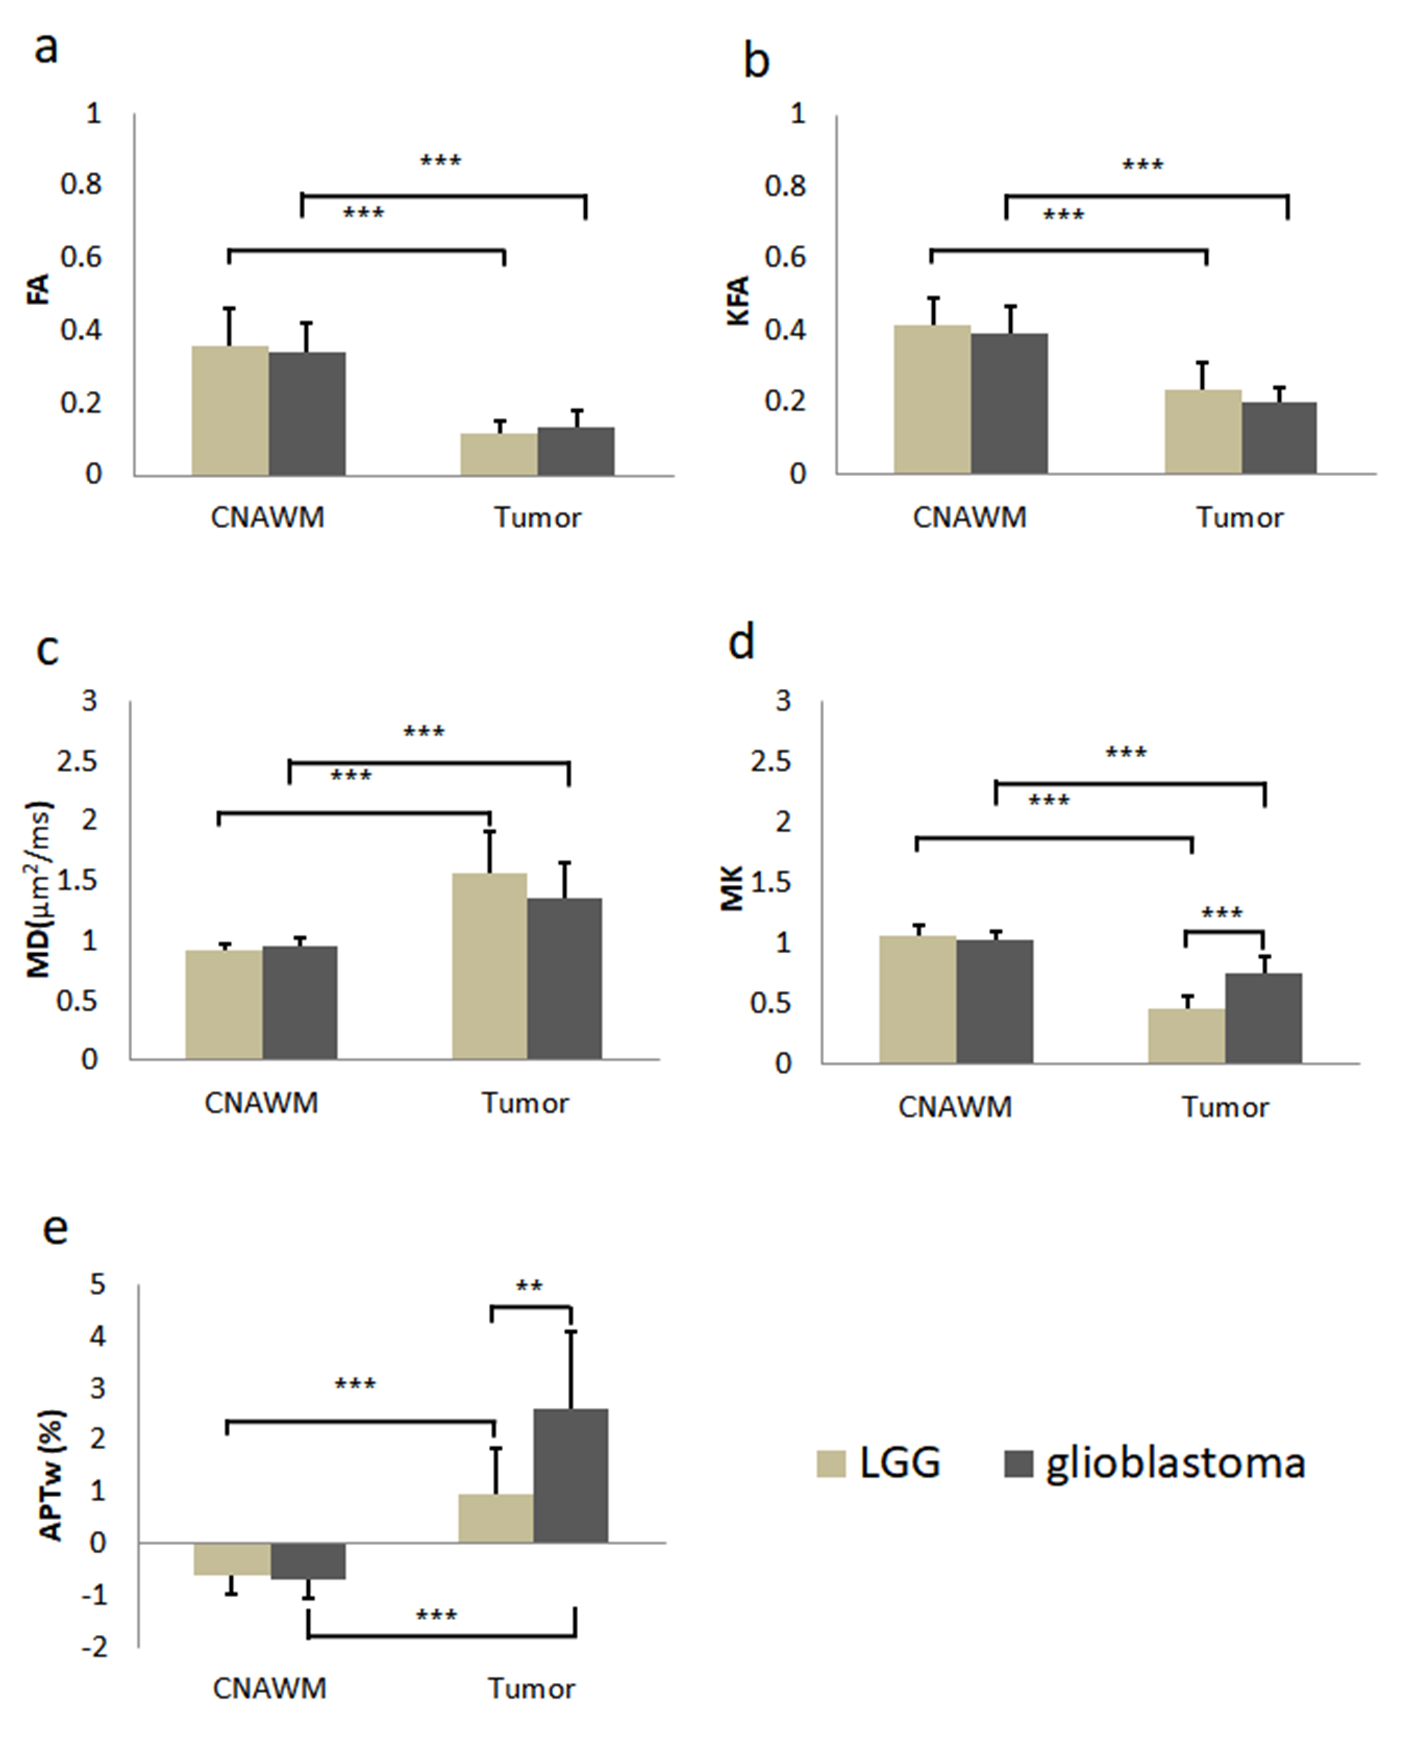
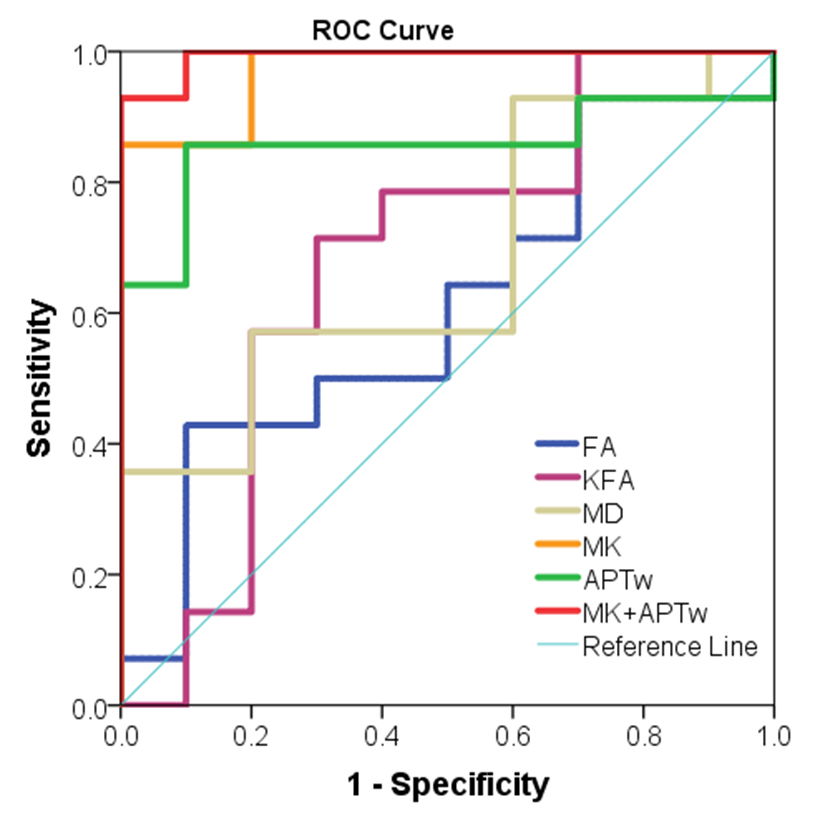
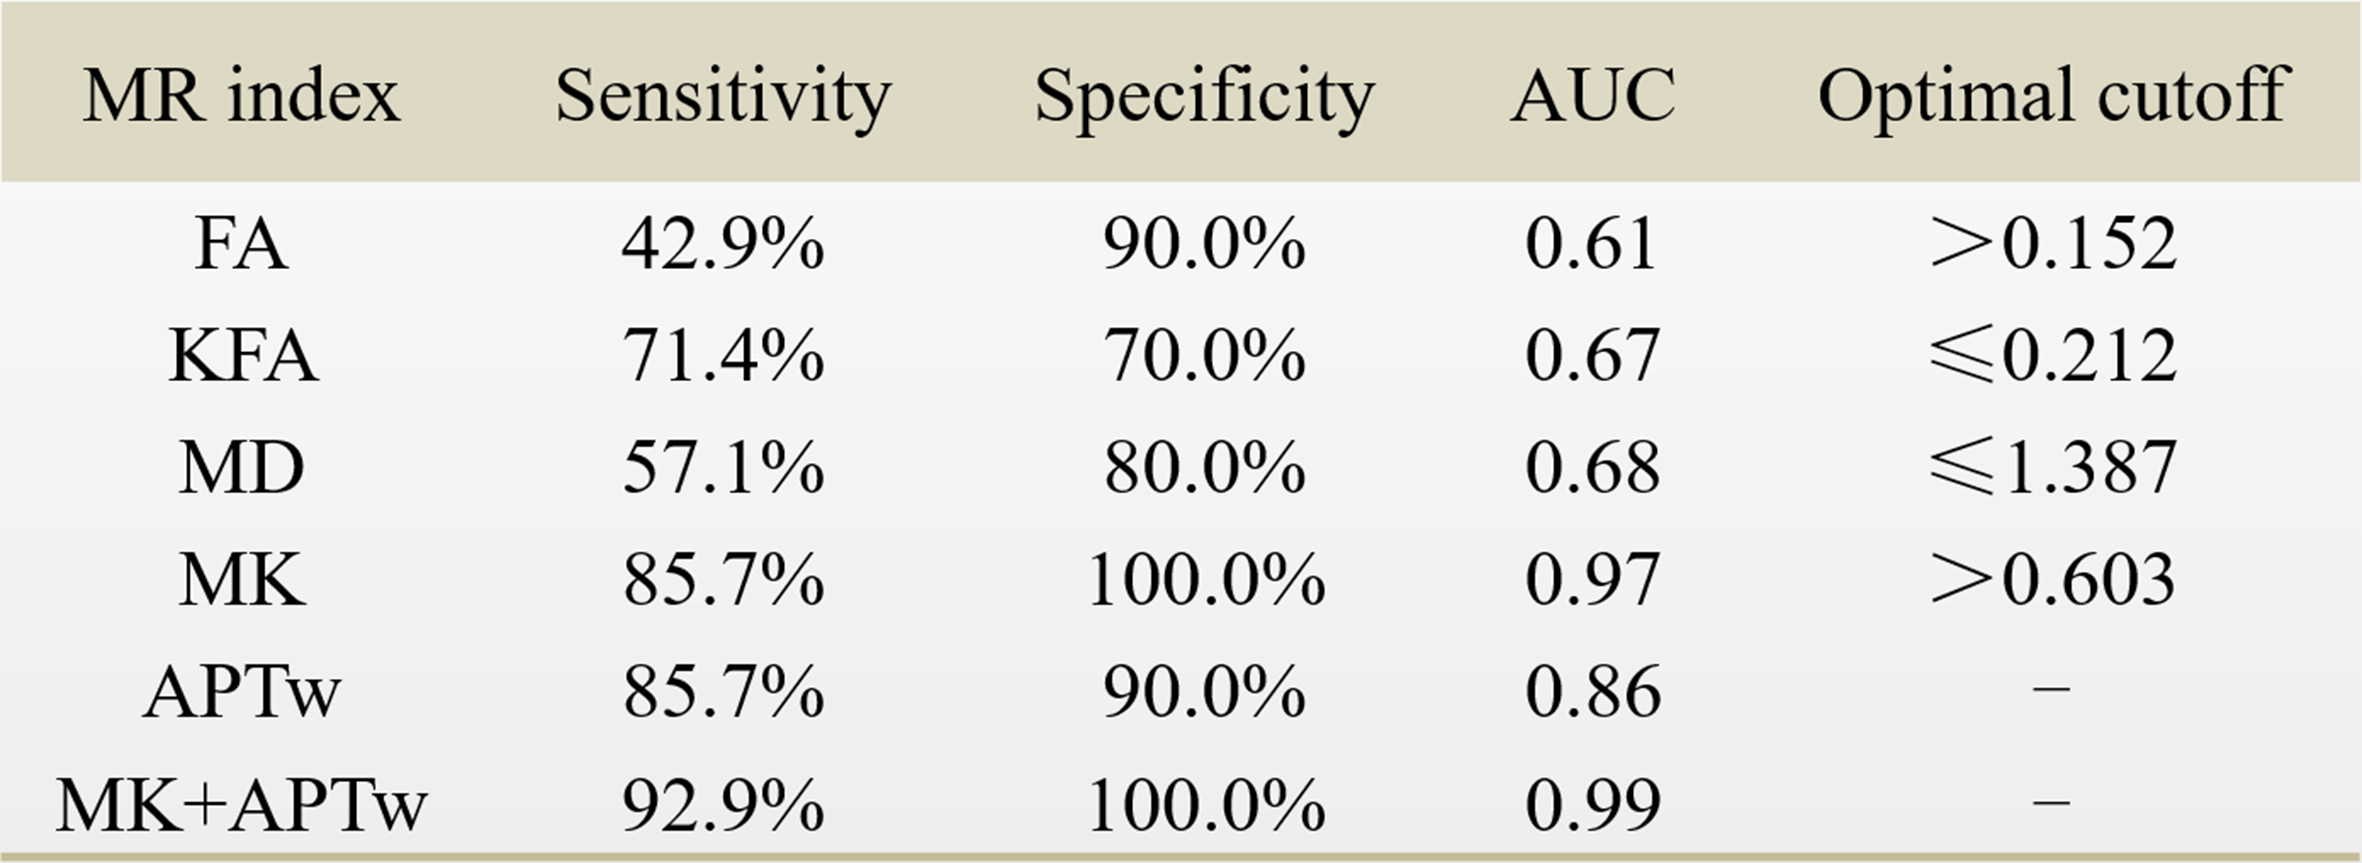
Results and discussion Figure 1 illustrates DKI metrics and APTw maps of a representative patient with glioma grade III. Compared with the CNAWM, the Gd-enhancing area exhibits conspicuously hypointense in FA, KFA and MK maps and hyperintense in MD and APTw maps. Similar results were observed in a glioblastoma patient (Fig. 2). FA, KFA and MK exhibit noticeably negative contrast in the tumor, whereas MD and APTw present obviously positive contrast in the tumor. Quantitatively, tumors in both groups show significantly lower FA, KFA and MK values and greater MD and APTw compared with CNAWM (P<0.001). Although CNAWM of the two groups shows comparable DKI and APT indices (Fig. 3), glioblastoma exhibits significantly higher MK (0.74±0.15) and APTw (2.62±1.46%) values than tumors with lower grades (0.46±0.10, P<0.001 for MK, and 0.94±0.89%, P<0.01 for APTw, respectively). Figure 4 displays the ROC analysis results. FA, KFA and MD show limited sensitivity and specificity in distinguishing LGG from glioblastoma with AUCs not greater than 0.70 (Table 1). On the contrary, MK and APTw showed better sensitivity and specificity, with AUCs higher than 0.85 (Table 1). Combining MK and APTw further improved the discrimination accuracy, yielding a sensitivity of 92.9%, a specificity of 100% and an AUC of 0.99. The observed greater kurtosis in glioblastoma may suggest highly heterogeneous microstructure in high-grade tumors with mixed apparent diffusion coefficients, compared with LGGs that contain relatively homogeneous tissues [8, 9]. Meanwhile, elevated APTw effect in glioblastoma implies more protein species and/or cellular protein levels in high-grade tumors [10].
Conclusion
Our preliminary patient study demonstrated the usefulness of both APTw and DKI-derived MK in differentiating lower-grade glioma from glioblastoma. The combination of two indices would further improve the discrimination performance, that may facilitate prompt and accurate diagnoses and treatment decisions.
Acknowledgements
Acknowledgments Grant Support: National Natural Science Foundation of China (81571668, 81871348 and 91859102), Guangdong Special Support Program (2016TQ03R272), and Shenzhen Science and Technology Program (JCYJ20170413161350892).References
[1] Clarke J, Butowski N, Chang S. Recent advances in therapy for glioblastoma. Arch Neurol 2010, 67:279–283
[2] Bai Y, Lin Y, Tian J, Shi D, Cheng J, Haacke EM, Hong X, Ma B, Zhou J, Wang M. Grading of Gliomas by Using Monoexponential, Biexponential, and Stretched Exponential Diffusion-weighted MR Imaging and Diffusion Kurtosis MR Imaging. Radiology. 2016 Feb;278(2):496-504.
[3] Togao O, Hiwatashi A, Yamashita K, Kikuchi K, Keupp J, Yoshimoto K, Kuga D, Yoneyama M, Suzuki SO, Iwaki T, Takahashi M, Iihara K, Honda H. Grading diffuse gliomas without intense contrast enhancement by amide proton transfer MR imaging: comparisons with diffusion- and perfusion-weighted imaging. European radiology 2017,27:578-588.
[4] Louis DN, Perry A, Reifenberger G, von Deimling A, Figarella-Branger D, Cavenee WK, Ohgaki H, Wiestler OD, Kleihues P, Ellison DW.The 2016 World Health Organization classification of tumors of the central nervous system: a summary. Acta Neuropathol 131:803–820
[5] Li Y, Liu X, Xu K, Qian Z, Wang K, Fan X, Li S, Wang Y, Jiang T. MRI features can predict EGFR expression in lower grade gliomas: A voxel-based radiomic analysis. Eur Radiol. 2018 Jan;28(1):356-362
[6] Tabesh A, Jensen JH, Ardekani BA, Helpern JA. Estimation of tensors and tensor-derived measures in diffusional kurtosis imaging. Magn Reson Med 2011, 65:823–836
[7] DeLong ER, DeLong DM, and Clarke-Pearson DL, Comparing the areas under two or more correlated receiver operating characteristic curves: a nonparametric approach. Biometrics. 1988; 44(3): 837-845.
[8] Szczepankiewicz F, van Westen D, Englund E, Westin CF, Ståhlberg F, Lätt J, Sundgren PC, Nilsson M. The link between diffusion MRI and tumor heterogeneity: mapping cell eccentricity and density by diffusional variance decomposition (DIVIDE). Neuroimage 2016;142:522-532.
[9] Gonzalez-Segura A, Morales JM, Gonzalez-Darder JM, Cardona-Marsal R, Lopez-Gines C, Cerda-Nicolas M, Monleon D. Magnetic resonance microscopy at 14 Tesla and correlative histopathology of human brain tumor tissue. PLoS One 2011;6(11):e27442.
[10] Zhou J, Tryggestad E, Wen Z, Lal B, Zhou T, Grossman R, Wang S, Yan K, Fu DX, Ford E, Tyler B, Blakeley J, Laterra J, van Zijl PC. Differentiation between glioma and radiation necrosis using molecular magnetic resonance imaging of endogenous proteins and peptides. Nat Med 2011;17:130–134.
Figures