0398
Metabolic characterization of human glioma subtypes using simultaneous pH- and oxygen-sensitive amine CEST-SAGE-EPI1Brain Tumor Imaging Laboratory (BTIL), Center of Computer Vision and Imaging Biomarker, David Geffen School of Medicine, UCLA, Los Angeles, CA, United States, 2Department of Radiological Sciences, David Geffen School of Medicine, UCLA, Los Angeles, CA, United States, 3Department of Bioengineering, Henry Samueli School of Engineering and Applied Science, UCLA, Los Angeles, CA, United States, 4Neuroscience Interdepartmental Program, David Geffen School of Medicine, UCLA, Los Angeles, CA, United States, 5UCLA Neuro-Oncology Program, David Geffen School of Medicine, UCLA, Los Angeles, CA, United States, 6Department of Neurology, David Geffen School of Medicine, UCLA, Los Angeles, CA, United States, 7Department of Neurosurgery, David Geffen School of Medicine, UCLA, Los Angeles, CA, United States, 8Department of Molecular and Medical Pharmacology, David Geffen School of Medicine, UCLA, Los Angeles, CA, United States
Synopsis
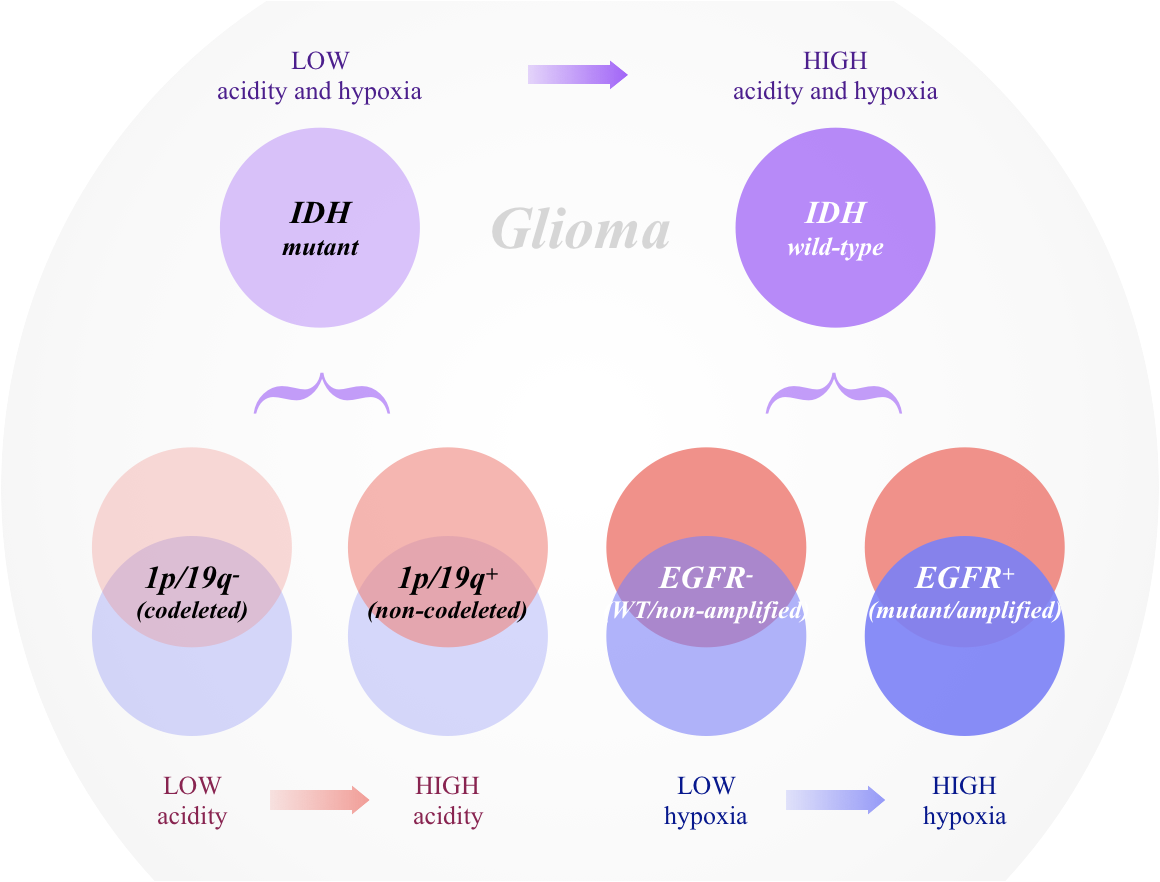
We simultaneously quantified acidity and hypoxia of human gliomas with IDH, 1p/19q, and EGFR genotypes using CEST-SAGE-EPI. Results suggest IDH mutant gliomas are significantly less acidic and hypoxic than IDH wild-type tumors. Within IDH mutants, 1p/19q codeletion is associated with lower tumor acidity, while IDH wild-type, EGFR amplified tumors were more hypoxic. Both MRI-derived acidity and hypoxia were correlated with patient survival, suggesting metabolic characteristics may be prognostic. CEST-SAGE-EPI may be useful for exploring metabolic changes that result from particular genetic alterations or useful as a biomarker for accelerating drug development in human brain tumors.
INTRODUCTION
Different genetic subtypes of gliomas are believed to have distinctly different metabolic signatures, which likely influences tumor aggressivity and patient outcomes1. In the current study we used amine chemical exchange saturation transfer spin-and-gradient-echo echoplanar imaging (CEST-SAGE-EPI)2 to simultaneously quantify pH-dependent chemical exchange and the oxygen- sensitive measure of the reversible transverse relaxation rate (R2’) in 152 glioma patients with different genotypes known to influence prognosis1,3, including isocitrate dehydrogenase (IDH), 1p/19q codeletion, and epidermal growth factor receptor (EGFR) amplification. We hypothesized CEST-SAGE-EPI2 would provide a metabolic signature unique to various glioma subtypes.METHODS
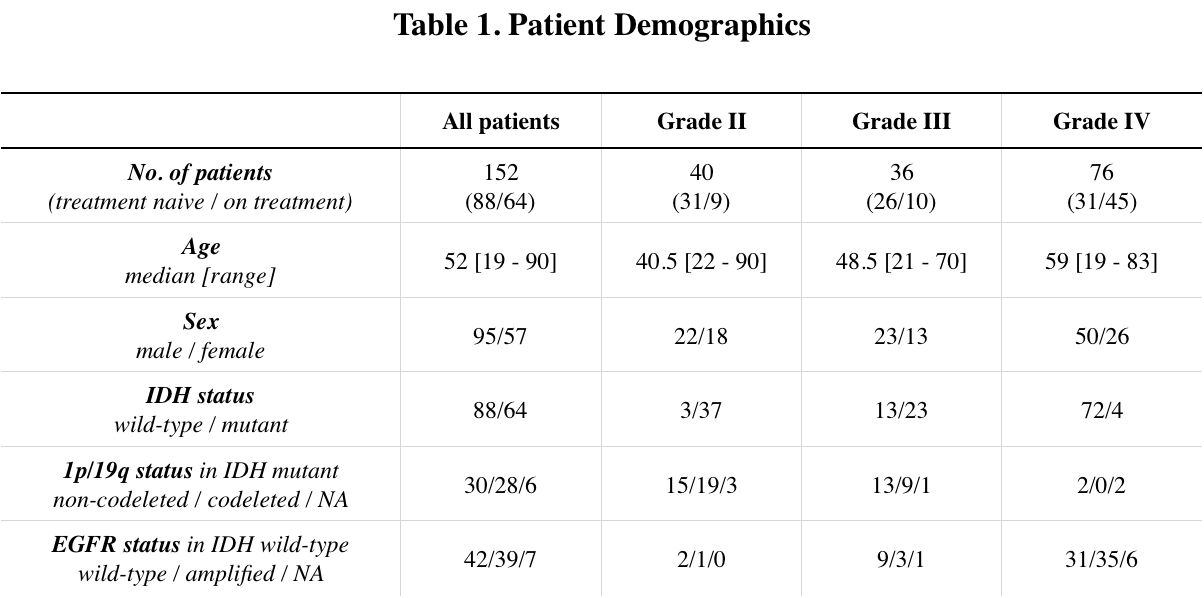
Patient: 152 histologically confirmed gliomas (WHO II, N=40; WHO III, N=36; WHO IV, N=76) were enrolled in this retrospective study (Table 1). IDH mutation status was determined by genomic sequencing or IHC staining of biopsy/surgical resection tissue. 1p/19q codeletion status and EGFR amplification/mutation status were determined by FISH or Foundation Medicine5. Residual overall survival (OS) was defined as the time between the MRI scan and death.pH- and oxygen-sensitive MRI: pH-weighted amine CEST images were collected with CEST-EPI4 (N=66) or CEST-SAGE-EPI2 (N=86). Off-resonance saturation was applied using a pulse train of 3x100ms Gaussian pulses with peak amplitude of 6µT. Post processing of CEST data consists of motion correction, Z-spectra based B0 correction, followed by the calculation of magnetization transfer ratio asymmetry (MTRasym) at amine proton resonance frequency (3.0ppm) as the metric of pH-sensitive contrast. For data acquired with CEST-SAGE-EPI sequence, the signal intensity from four echoes were used to estimate R2, R2*, and R2’ as described previously2.
Statistical analysis: Contrast enhancing and FLAIR hyperintense lesions were semi-manually segmented6, combined, and then median MTRasym and R2’ values were extracted. Measurements were compared between genotypes using Student t-test or Wilcoxon rank-sum test depending on the distribution. Receiver-operator characteristic (ROC) analysis was performed to evaluate classification performance. Univariate and multivariable Cox regression was performed to determine independent prognostic factors for residual OS. Kaplan-Meyer curves were compared using the log rank test. All p-values were considered significant when p < 0.05.
RESULTS
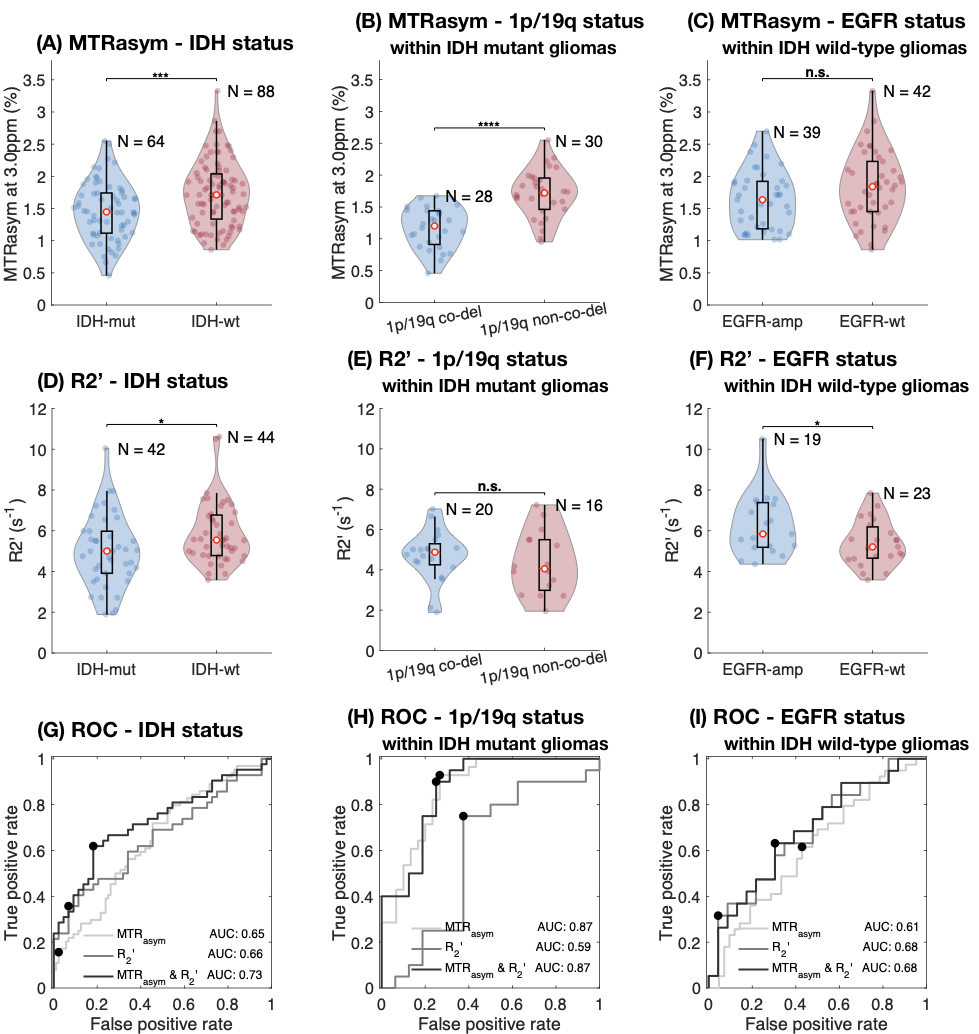
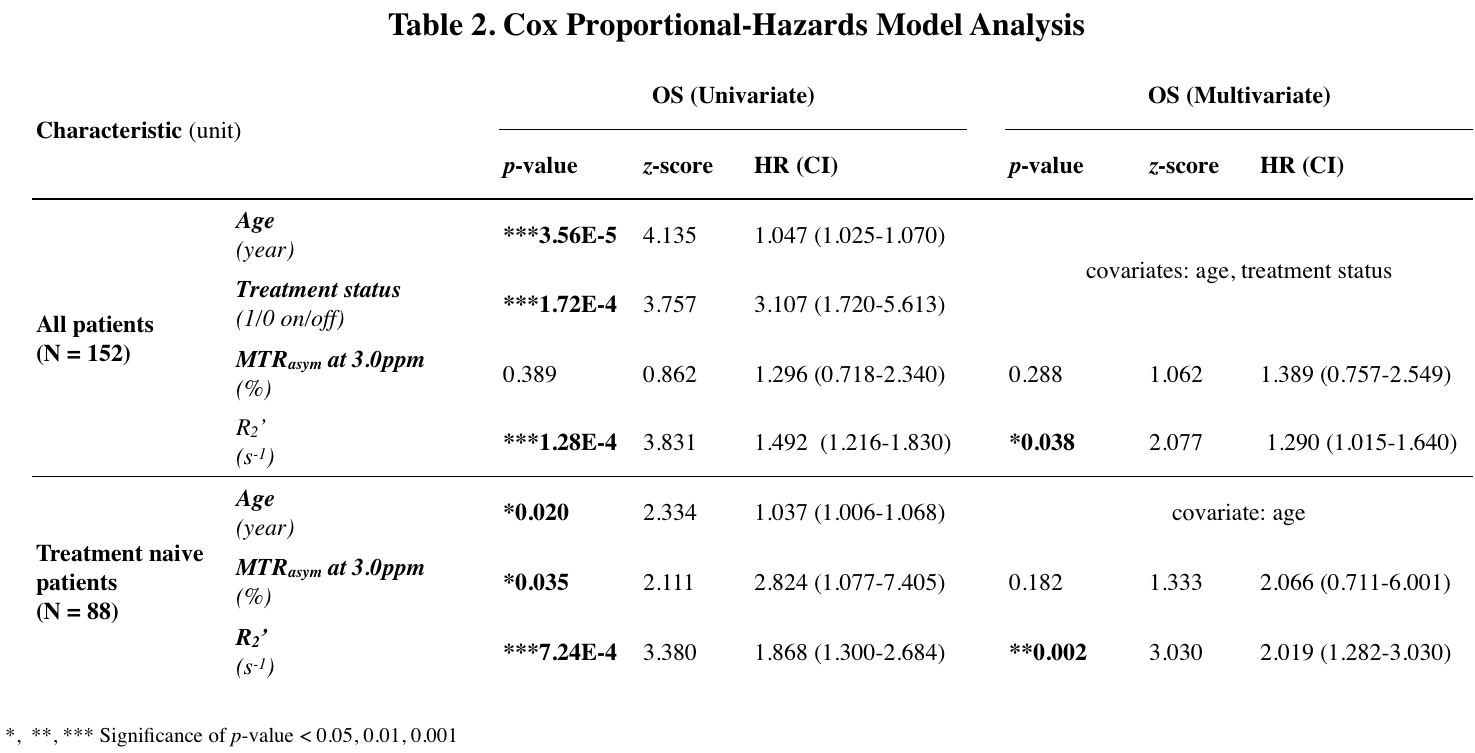
CEST-SAGE-EPI provides simultaneous characterization of tumor acidity and oxygen utilization. IDH mutant gliomas had a significantly lower acidity and hypoxia than IDH wild-type gliomas (Fig. 1A,D; P=7.8E-4, P=2.8E-7). Within IDH mutants, 1p/19q codeletion notably influenced tumor acidity, with a significantly lower MTRasym in 1p/19q codeleted gliomas (Fig. 1B; P=2.8E-07). However, no difference in R2’ was observed between 1p/19q codeleted and intact tumors (Fig. 1E). EGFR amplified IDH wild-type gliomas exhibited elevated R2’, suggesting higher hypoxia than EGFR wild-type gliomas (Fig. 1F; P=0.0497), with no apparent difference in tumor acidity (Fig. 1C). ROC analysis using combined metabolic MRI characteristics could differentiate between genotypes (Fig. 1G-I, AUC=0.73 for IDH status, AUC=0.87 for 1p/19q status, AUC=0.68 for EGFR status).Cox regression was used to determine the effect of clinical factors and MR measurements on residual OS (Table 2). Univariate analyses showed a significant decrease in residual OS associated with age (Hazard Ratio (HR)=1.047, P=3.56E-5), treatment status (HR=3.107, P=1.72E-4), and R2’ (HR= 1.492, P=1.28E-4) (Table 2). When considering age and treatment status as covariates in a multivariable model, R2’ remained significantly associated with survival (HR=1.290, P=0.038). Within the treatment naïve patients, MTRasym also showed significant association with OS (HR=2.824, P=0.035), although not when using a multivariable model with age as a covariate.
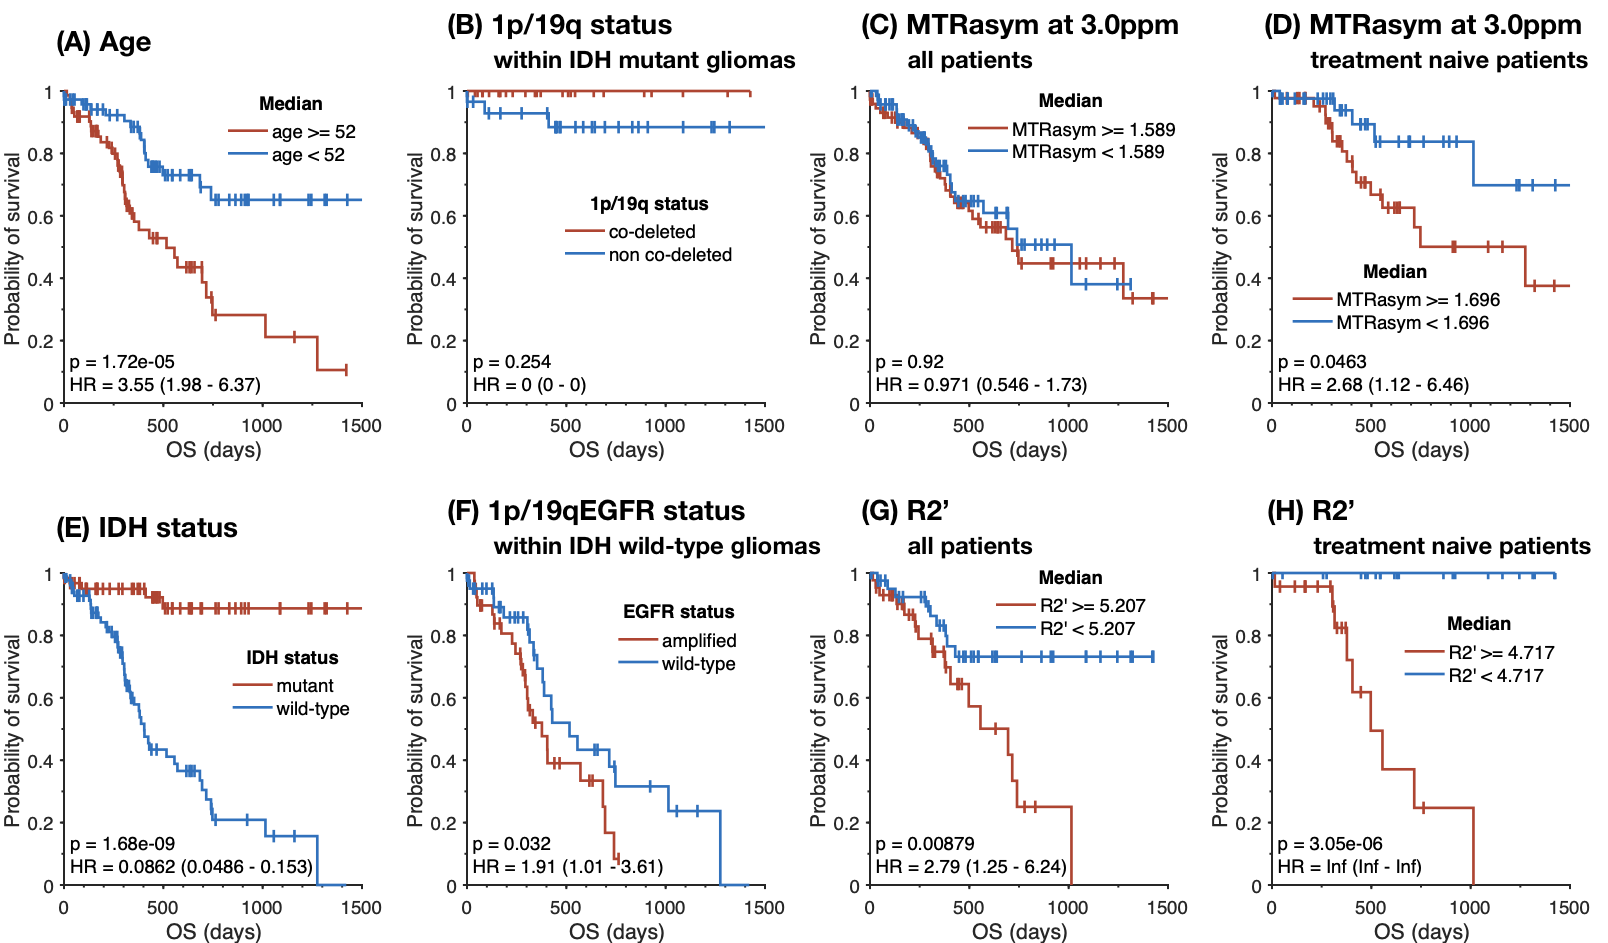
Consistent with previous reports3,7, patients with IDH mutant gliomas (Fig. 2E; P=1.68E-09) and EGFR wild-type gliomas (Fig. 2F; P=0.032) have a significantly longer survival. We did not observe an effect of 1p/19q codeletion status on residual OS (Fig. 2B), likely due to the number of censored patients and effectiveness of known treatments in this subtype. Analysis of residual survival in patients grouped by high/low acidity showed no significant association when examining treated and untreated patients (Fig. 2C); however, when analyzing residual OS of treatment naive patients, a significant survival benefit was observed in patients with lower acidity (Fig. 2D; P=0.0463). In both treatment native patients (Fig. 2H; P=3.05E-05) and all patients (Fig. 2G; P=0.00879), lower R2’ provided a significant survival advantage over patients with more hypoxic tumors.
DISCUSSION
CEST-SAGE-EPI provides a fast, whole-brain, simultaneous quantification of tumor acidity and hypoxia2. Application of this technique in gliomas demonstrated unique signatures associated with different tumor genotypes. IDH mutants tended to be less acidic, less hypoxic, and correlated with a more favorable prognosis, compared to wild-type counterparts (Fig. 3). This is consistent with previous reports3 showing IDH mutant tumors to be more dependent on oxidative phosphorylation than glycolysis. This was at least in part driven by 1p/19q codeleted IDH mutant gliomas, which had significantly lower acidity compared with 1p/19q intact tumors. EGFR amplification in IDH wild-type gliomas was found to be associated with more tumor hypoxia, which is consistent with in vitro studies showing that hypoxic tumor environment drives EGFR overexpression and promotes non-angiogenic invasive tumor growth8,9. EGFR amplified gliomas are often more invasive, less responsive to common chemoradiation therapies, and carry a dismal prognosis7.CONCLUSION
Estimates of tumor acidity and hypoxia using CEST-SAGE-EPI appear to reflect the underlying genomic characteristics of the tumor, which manifest as changes in the tumor microenvironment and altered patient survival.Acknowledgements
No acknowledgement found.References
1. Schmidt M, Antweiler S, Urban N, et al. Impact of Genotype and Morphology on the Prognosis of Glioblastoma. J Neuropathol Exp Neurol. 2002;61(4):321-328.
2. Harris R, Yao J, Chakhoyan A, et al. Simultaneous pH‐sensitive and oxygen‐sensitive MRI of human gliomas at 3 T using multi‐echo amine proton chemical exchange saturation transfer spin‐and‐gradient echo echo‐planar imaging (CEST‐SAGE‐EPI). Magn Reson Med. 2018;80(5):1962-1978.
3. Cohen A, Holmen S, Colman, H. IDH1 and IDH2 mutations in gliomas. Curr Neurol Neurosci Rep. 2013;13: 345.
4. Harris R, Cloughesy T, Liau L, et al. Simulation, phantom validation, and clinical evaluation of fast pH-weighted molecular imaging using amine chemical exchange saturation transfer echo planar imaging (CEST-EPI) in glioma at 3 T. NMR Biomed. 2016;29:1563–1576.
5. Frampton G, Fichtenholtz A, Otto G, et al. Development and validation of a clinical cancer genomic profiling test based on massively parallel DNA sequencing. Nature Biotechnology. 2013; 31:1023-1031.
6. Ellingson B, Kim H, Woodworth D, et al. Recurrent glioblastoma treated with bevacizumab: contrast-enhanced T1-weighted subtraction maps improve tumor delineation and aid prediction of survival in a multicenter clinical trial. Radiology. 2014;271(1):200-210.
7. Li J, Liang R, Song C, et al. Prognostic significance of epidermal growth factor receptor expression in glioma patients. Onco Targets Ther. 2018;11:731–742.
8. Talasila K, Soentgerath A, Euskirchen P, et al. EGFR wild-type amplification and activation promote invasion and development of glioblastoma independent of angiogenesis. Acta Neuropathol. 2013;125(5):683–698.
9. Franovic A, Gunaratnam L, Smith K, et al. Translational up-regulation of the EGFR by tumor hypoxia provides a nonmutational explanation for its overexpression in human cancer. PNAS. 2007;104(32):13092-13097.
Figures