0397
Spectral Wavelet-feature Analysis and Classification Assisted Denoising Approach for Enhancing Signal to Noise Ratios of MRS Data1Department of Radiology and Imaging Sciences, Emory University School of Medicine, Emory University, Atlanta, GA, Georgia, 2MR R&D Collaborations, Siemens Healthineers,, Atlanta, Georgia, 3Department of Radiology, The People’s Hospital of Longhua, Shenzhen, China, 4Department of Radiology and Imaging Sciences, Emory University School of Medicine, Emory University, Atlanta, Georgia, 5School of Communication and Information Engineering, Nanjing University of Posts and Telecommunication, Nanjing, China, 6Department of Radiology and Imaging Sciences, Emory University School of Medicine, Emory Univeristy, Atlanta, GA, United States
Synopsis
Low signal-to-noise ratio (SNR) and long acquisition time limit the clinical applications of magnetic resonance spectroscopy (MRS). This work presents a data-driven machine-learning assisted Spectral Wavelet-feature Analysis and Classification Assisted Denoising (SWANCAD) approach to extract the specific spectral wavelets of signals and noises for reducing noise and improving SNR of MRS data. The effective denoise by SWANCAD enabled resolving prominent metabolic peaks but also identify the smaller concentration metabolites which are merged in the noises. Potential applications of the SWANCAD includes the possibility of improving the signal to noise ratio (SNR) of MRS data collected in sub-minute or sub-cm voxels.
Magnetic resonance spectroscopy (MRS) offers a non-invasive means of assessing the metabolic function of tissue thereby enabling the effective and sensitive differentiation of healthy and diseased tissue. However, its applications are limited due to the sensitivity required for detecting million-molar concentration metabolites. Practically, clinical MRS can only be done within a few minutes and a certain number of signal averaging in a large sampling voxel. As a result, the spectra often are noisy, making the metabolite signals difficult to resolve and quantification inaccurate. In this work we present a machine-learning based spectral wavelet feature analysis and classification-assisted denoising (SWANCAD) approach for denoising MRS data, significantly improving the signal to noise ratio (SNR) of MRS data collected in sub-minute or sub-cm voxels.
Methods
Imaging: A 1H MR spectroscopy phantom containing typical brain metabolites and five volunteers were used for the experiments. The phantom was imaged eight times with number of averages prescribed at 192 (here forth these datasets are referred to as high-NSA datasets) and the same acquisition protocols were repeated once for each of these volunteers. The MR spectra were collected using a single-voxel proton (1H) point resolved spectroscopy sequence (PRESS) on a 3T scanner (MAGNETOM Prisma, Siemens Healthcare, Erlangen Germany) with TE=30 ms, TR=2000 ms, BW=1200 Hz, vector size: 1024. Chemical shift selected pre-saturation was used for water suppression in all MRS data collection. In addition, single voxel spectra were retrospectively extracted from CSI data of four tumor patients (3 male). In addition, CSI was collected using a stimulated-echo acquisition mode (STEAM) sequence on the same 3T scanner with imaging parameters listed as follows: TR/TE of 1500/68; matrix of 16 × 16; FOV of 180 × 180 mm.
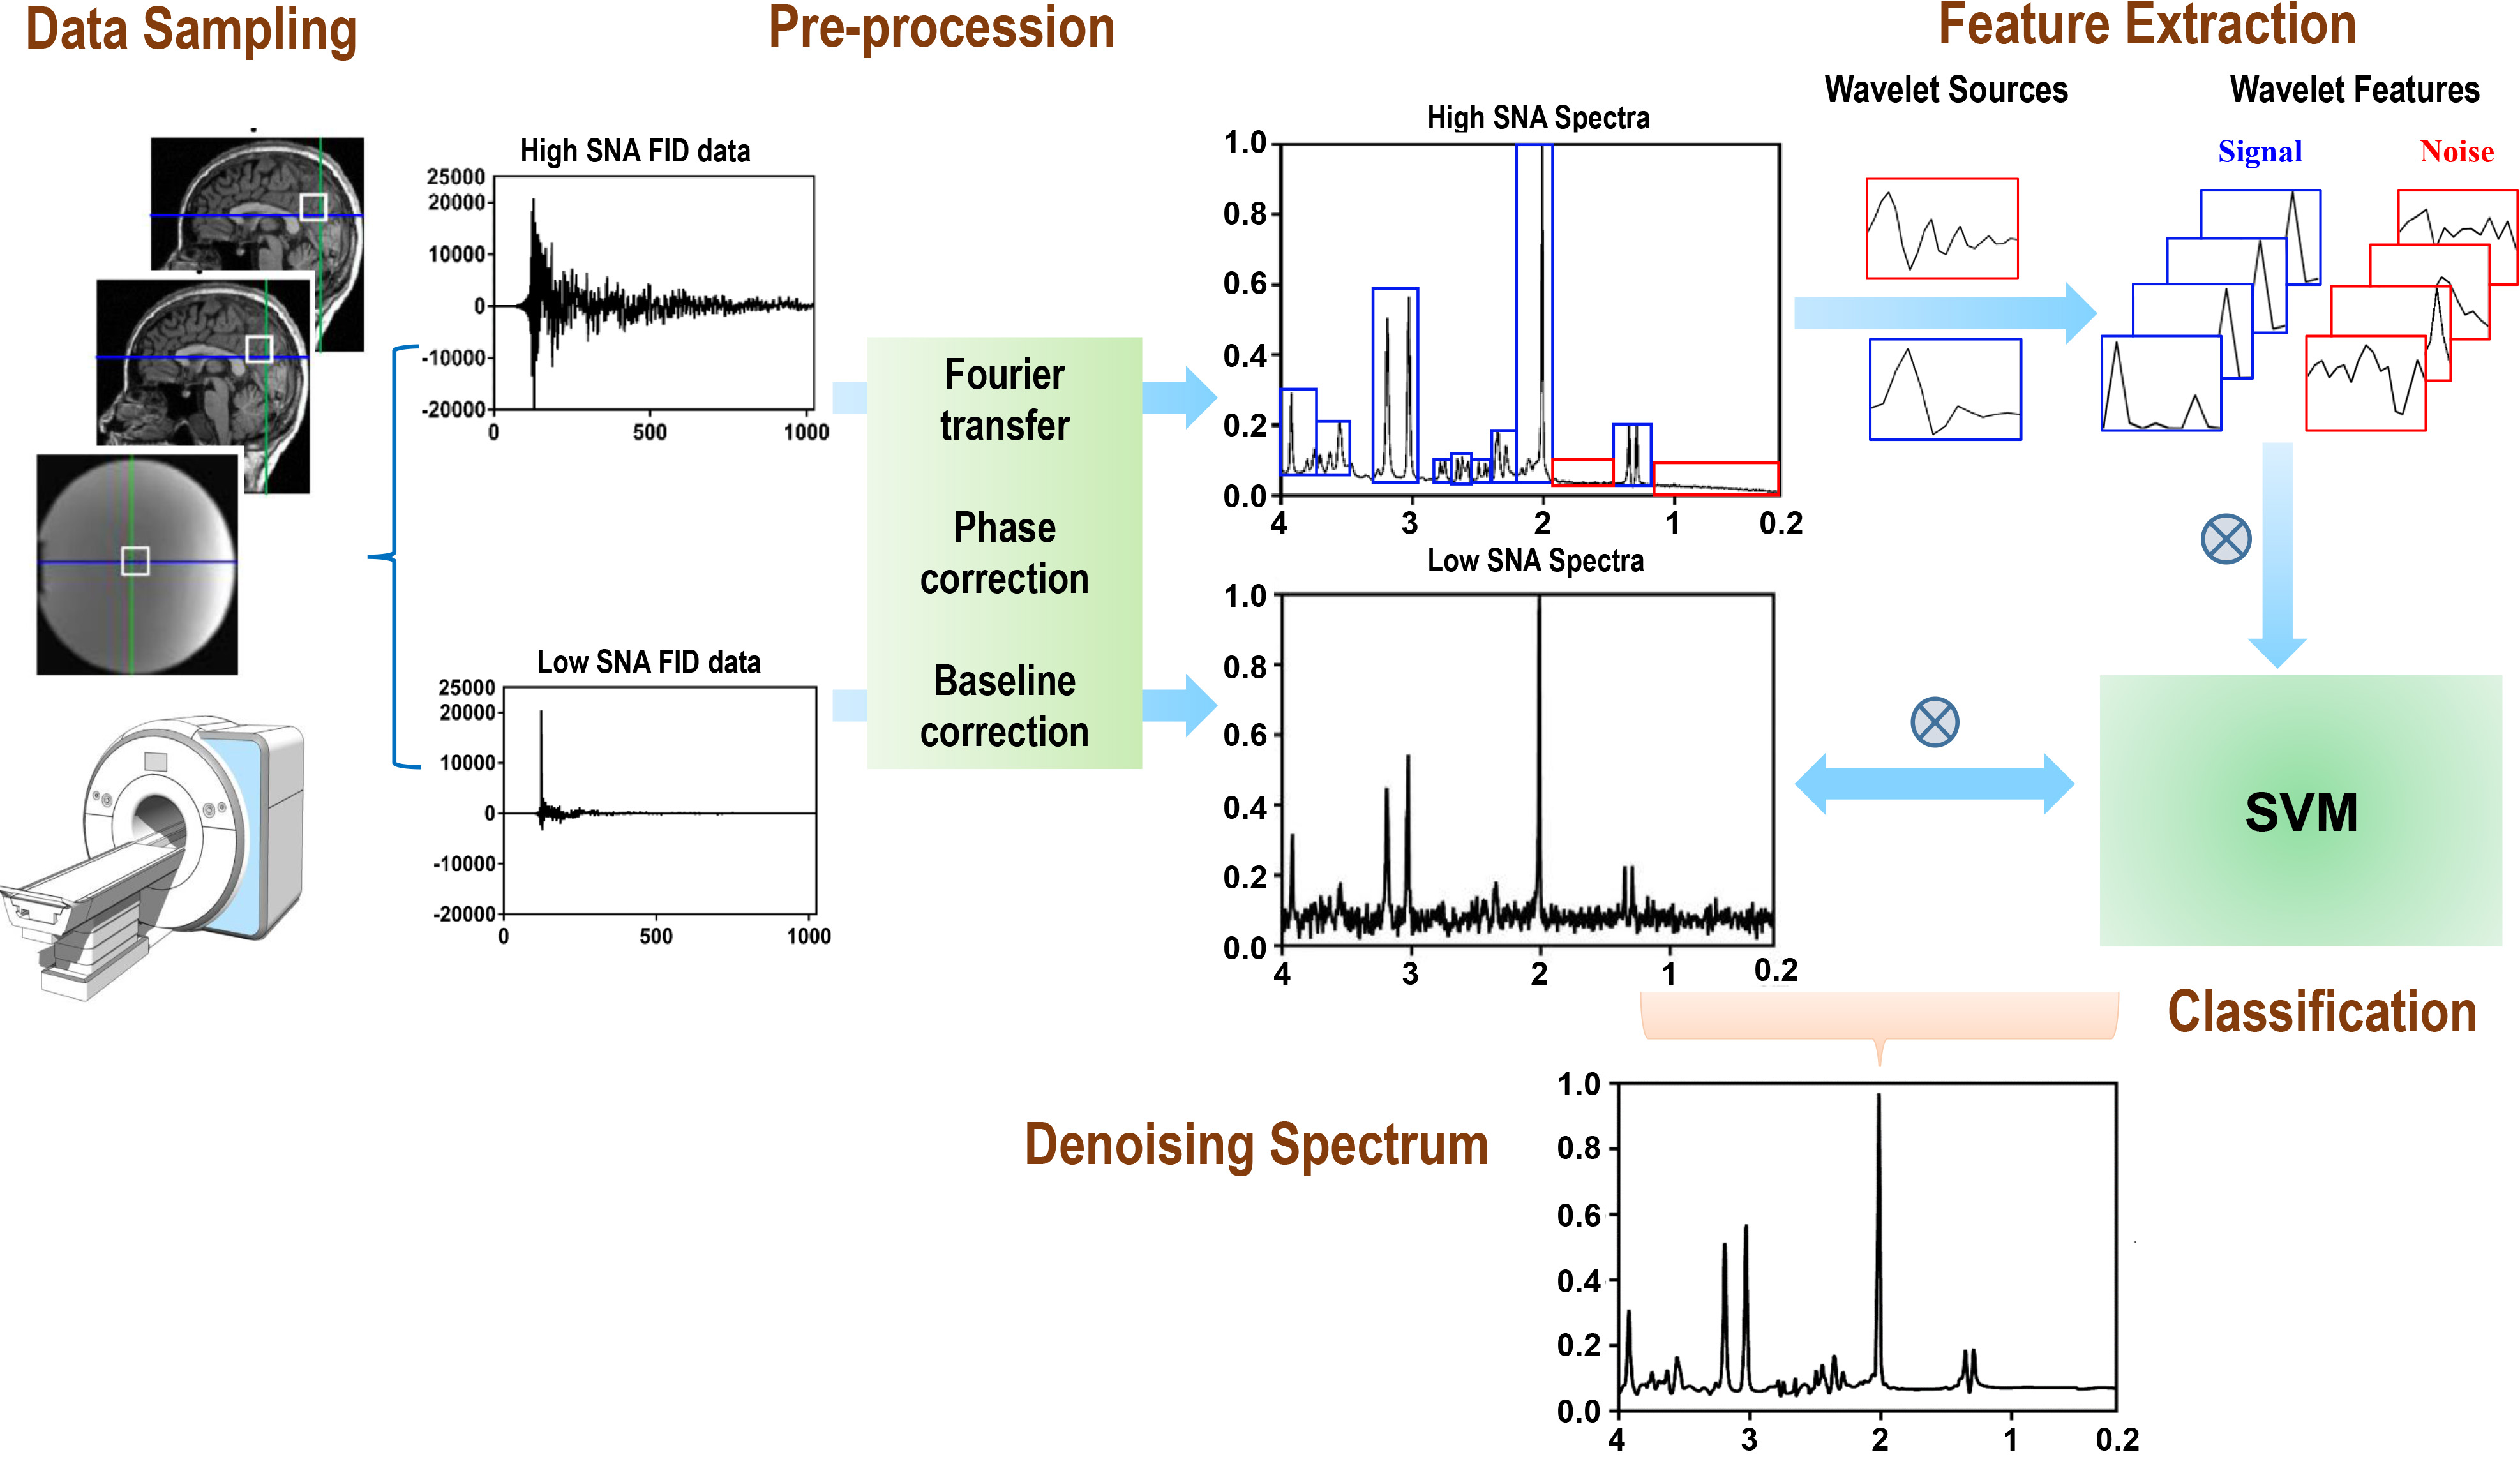
Algorithm: Figure 1 illustrates the processing steps of SWANCAD approach. Briefly, after Fourier transformation and phase and baseline correction, the high NSA data were analyzed with continuous wavelet transform; the continuous wavelet coefficients with the strongest fit, evaluated using Pearson correlation, were extracted from the high-NSA data. The two source wavelets used in this work were selected from the Daubechies wavelet family, which have shown previous success in denoising medical images. The extracted wavelet features were fed into a support vector machine (SVM) 2 together with 27 additional features, describing the appearance of the peaks in each spectrum. The SVM was then trained to differentiate between signal and noise peaks. This trained SVM was subsequently used to denoise the low NSA data. In addition, quantitative analysis was performed by measuring and comparing SNRs of noisy spectra before and after denoising to determine the effectiveness of denoising.
Results
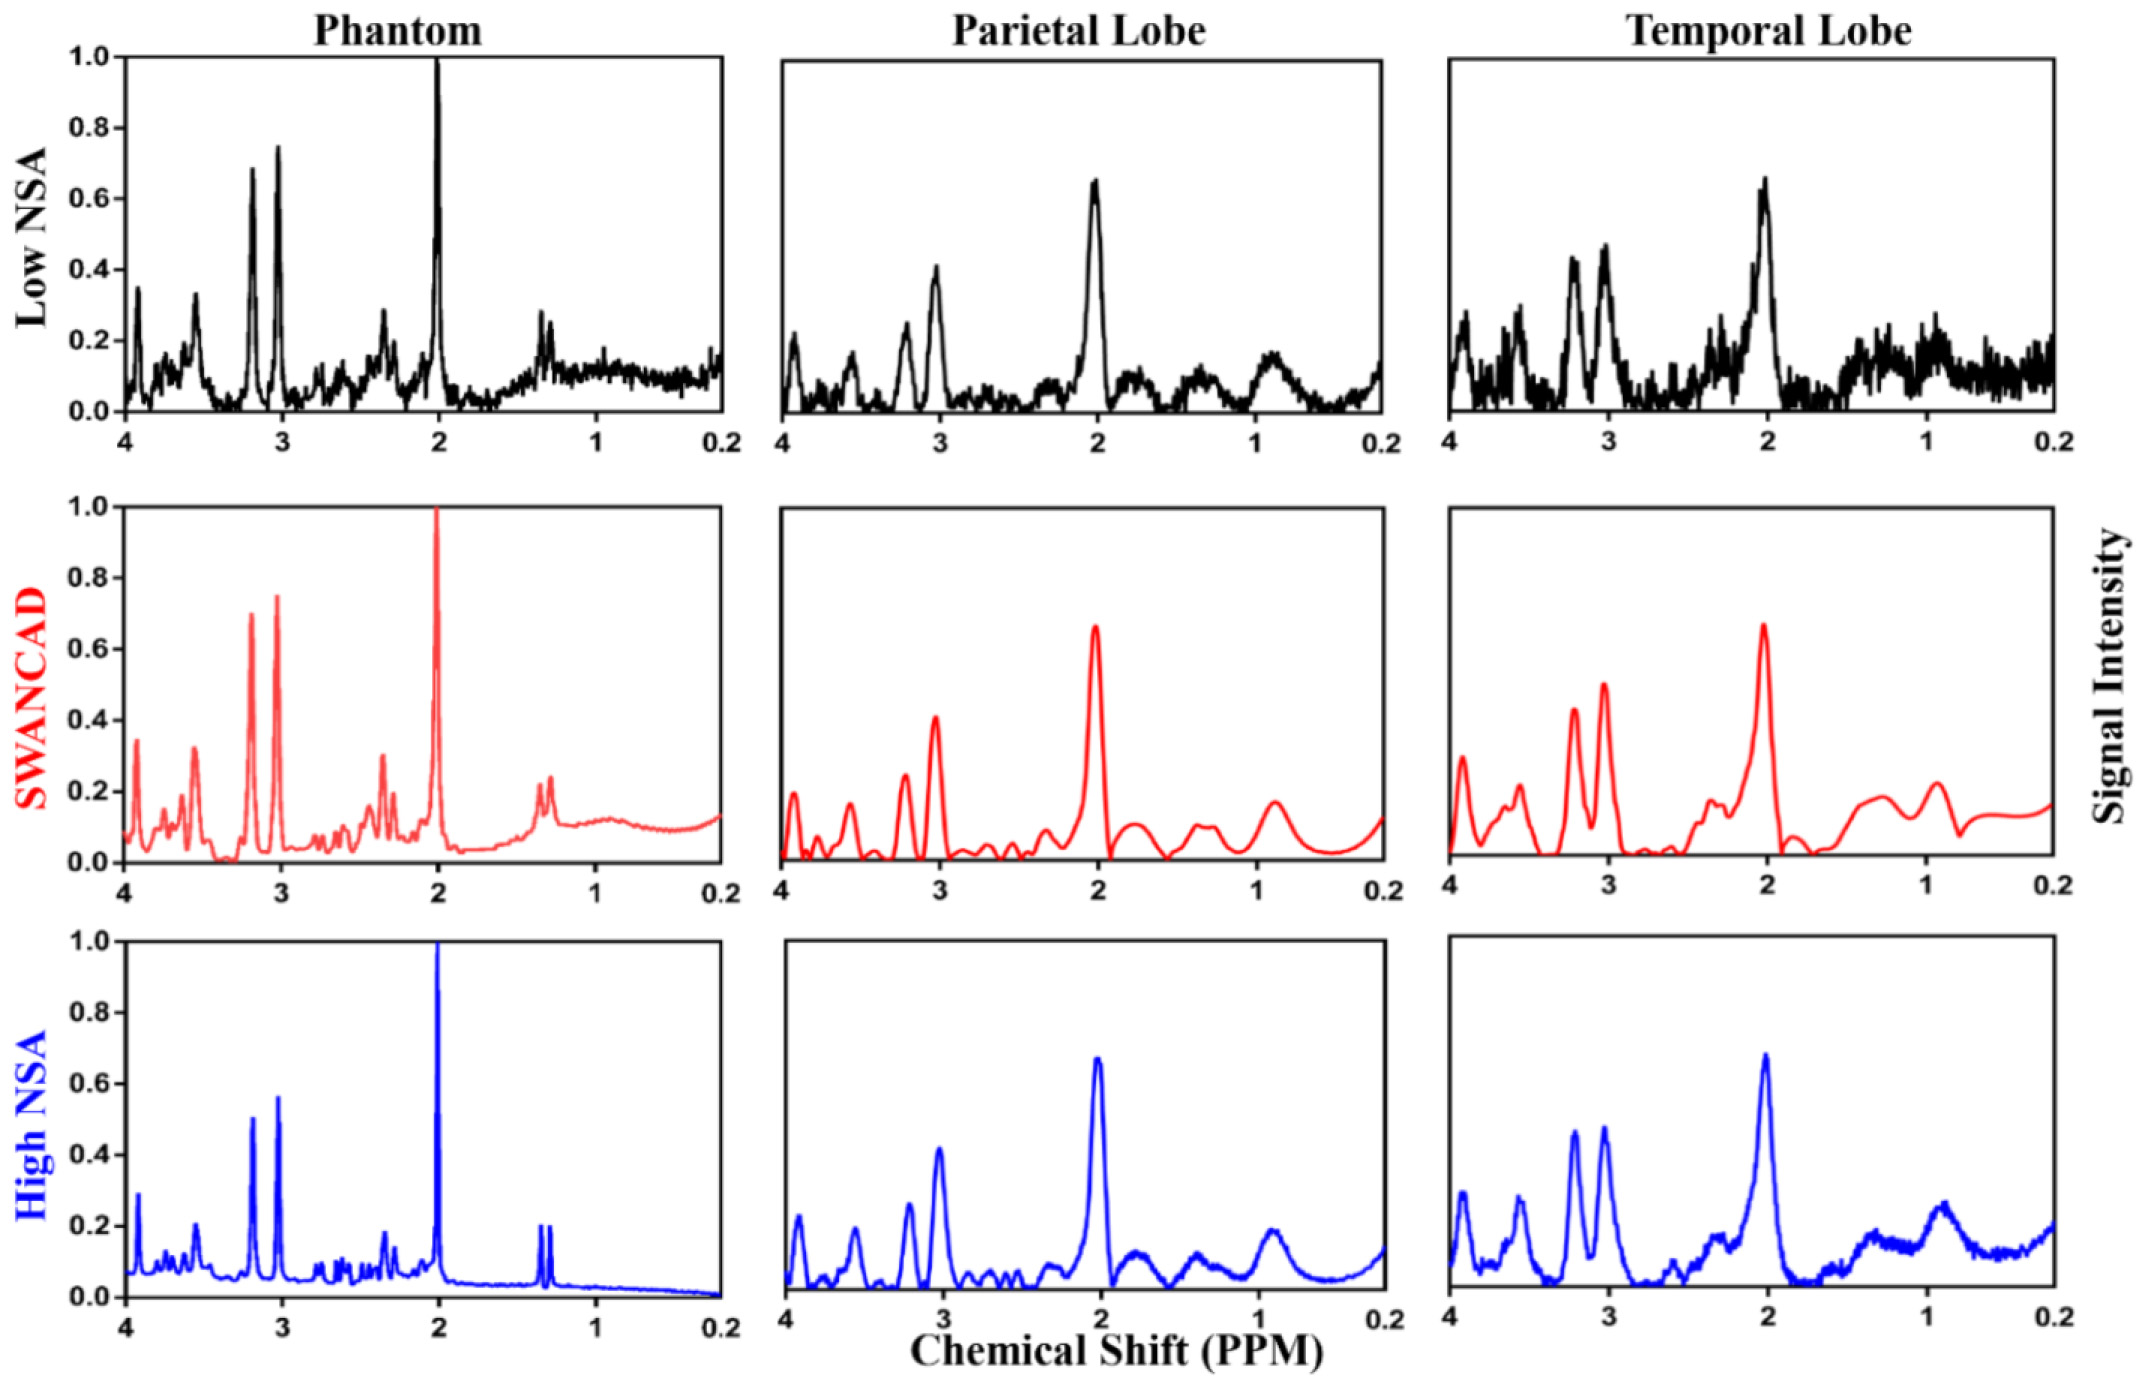
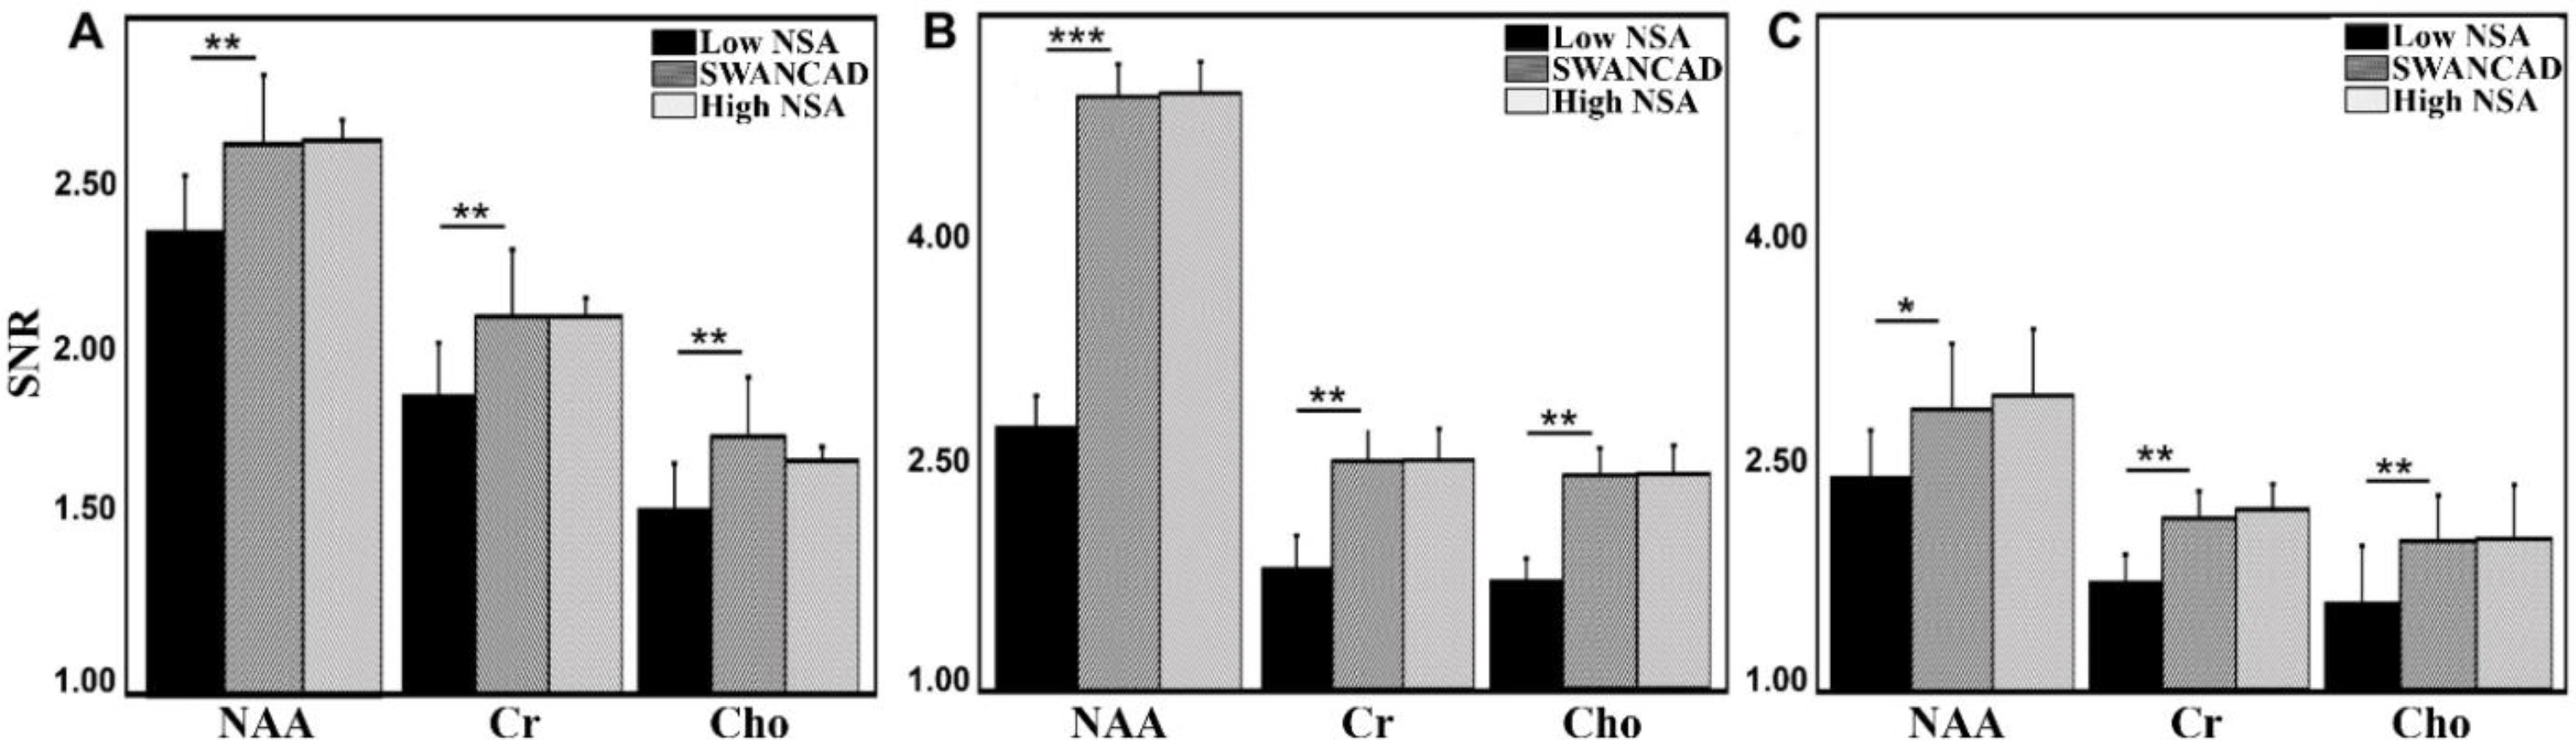
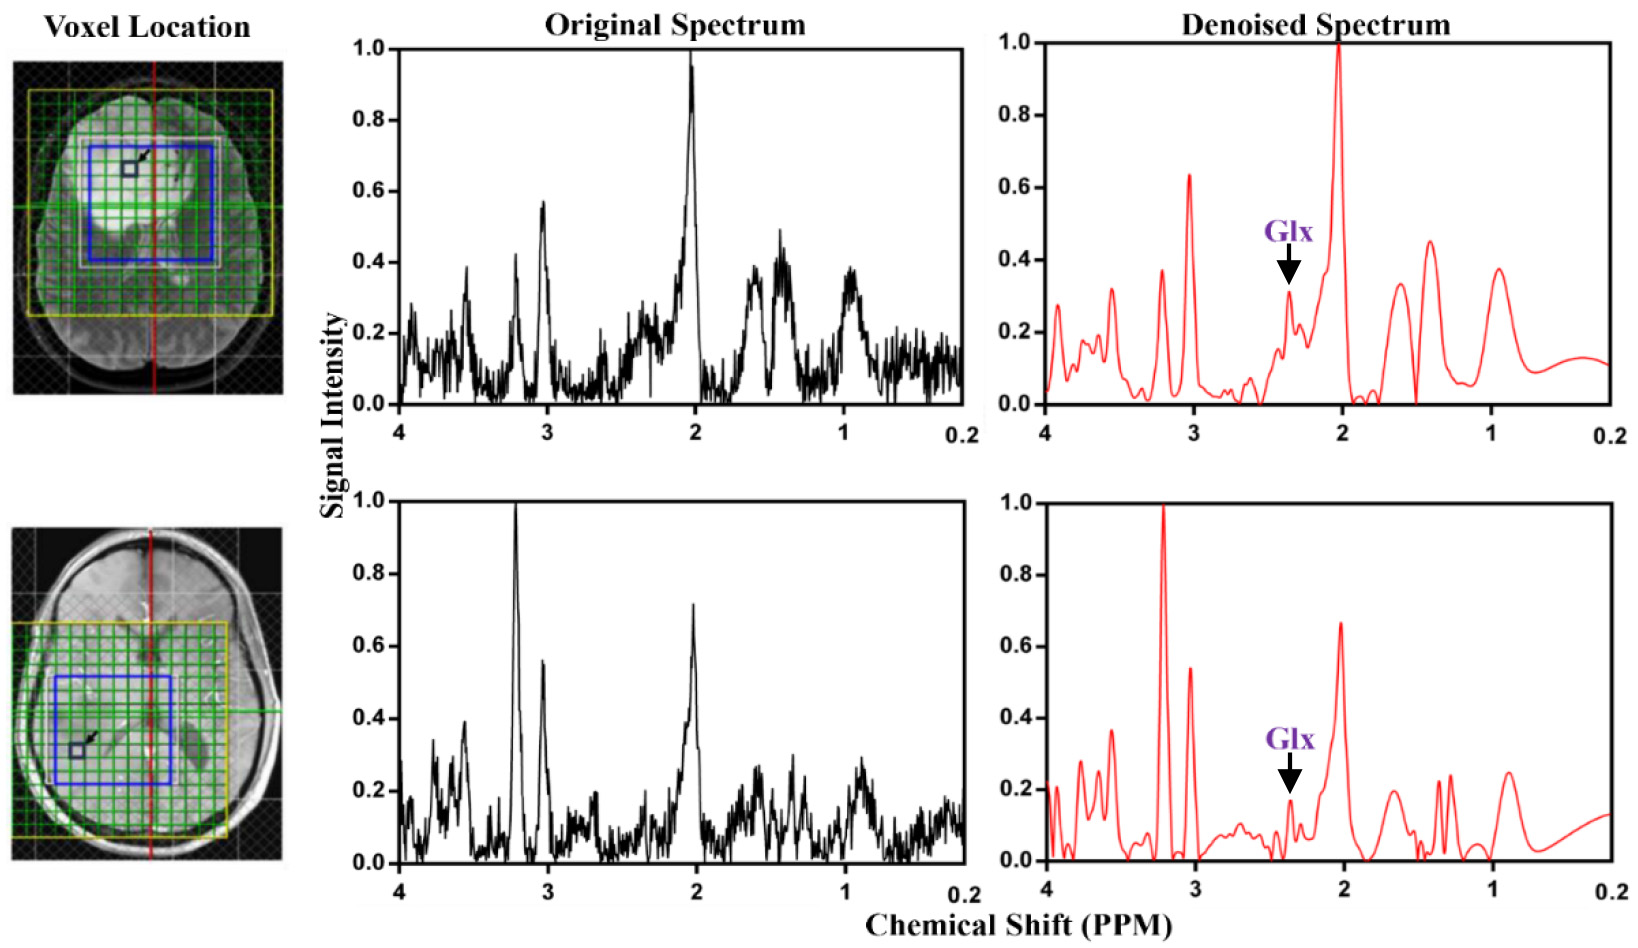
Using the SWANCAD algorithm, the signal and noise wavelets were identified from low NSA spectra shown in Figure 2, denoised low NSA spectra from both phantom and human brains exhibited improved spectral quality with clear enhancement in the conspicuity of the spectral peaks that match those of high NSA spectra collected with longer acquisition time. To quantitatively evaluate the performance of the SWANCAD approach SNRs were calculated for three selected metabolite signals from NAA, Cho and Cre. In Figure 3, significant SNR improvements in low NSA spectra from both phantom and the human subjects before and after denoising with SWANCAD approach (p < 0.01). No significant difference in SNR was observed between spectra denoised with the SWANCAD and the high NSA data collected in the same sampling volume but with much longer acquisition time, indicating that the denoised low NSA spectra reached the same level of SNRs as high NSA spectra. To demonstrate the potential benefit of the SWANCAD approach in the clinical applications of MRS, we tested the utility of the SWANCAD approach in denoising the single voxel spectra extracted from the individual voxels of CSI obtained in brain tumor patients, as shown in Figure 4, it is worth noting that after denoising, several noise-covered signal peaks in the region of 2.2-2.5, which are likely from glutamine and glutamate (Glx), become clearly distinguishable, further demonstrating the potential of the SWANCAD in recovering the noise-contaminated signals.
Discussion & conclusion
The SWANCAD approach is capable of denoising MRS data while specifically preserving the spectral peaks corresponding to metabolites of varying concentrations. In addition, it allows for recovering or detecting lower concentration metabolites contaminated by the noise. The quantitative comparison of SWANCAD to other denoising approaches is the subject of our future study.
Acknowledgements
This work is supported in a part by a grant from NIH (R01CA203388 to HM)References
1. Dienel GA. Brain glucose metabolism: Integration of energetics with function. Physiol Rev 2018; 99(1): 949-1045.
2. Maldonado S, Weber R. A wrapper method for feature selection using support vector machines. Inform Science 2009; 179(13): 2208-2217
Figures