0395
MP-PCA denoising dramatically improves SNR in large-sized MRS data: an illustration in diffusion-weighted MRS1Center for Biomedical Imaging, Ecole Polytechnique Fédérale de Lausanne, Lausanne, Switzerland, 2Dept. of Radiology, New York University School of Medicine, New York, NY, United States
Synopsis
MRS is an inherently low signal-to-noise technique resulting in substantial spectral averaging and large voxel volumes. The problem is further amplified for diffusion-weighted MRS. Here we test the performance of denoising using principal component analysis coupled with Marchenko-Pastur’s random matrix theory in the context of DW-MRS. We report 50 – 100% increase in SNR, reduction in Cramer-Rao bounds and a potential eight-fold reduction in scan time. This technique is expected to also bring significant improvements in the context of fMRS, X-nuclei MRS and CSI.
Introduction
Magnetic resonance spectroscopy (MRS) is a powerful technique that provides unique information about brain metabolite concentrations in vivo. Combined with diffusion weighting (DW), information can be extracted about the mean displacement of metabolites, which then serve as very specific probes of their intra-neuronal or intra-glial environment. However, MRS is an inherently low signal-to-noise (SNR) technique due to the much lower concentration of metabolites relative to water, resulting in substantial spectral averaging and large voxel volumes. For DW-MRS, the averaging is even heavier to compensate for diffusion attenuation and acquisition times become prohibitively long to parse multiple b-values, directions or diffusion times. Several denoising schemes have been proposed[1-4] but they are computationally intensive and none have been commonly adopted by the MRS community. Denoising using principal component analysis coupled with Marchenko-Pastur’s random matrix theory (MP-PCA) has been recently proposed for diffusion MRI[5] and relaxometry[6] and is becoming widely used. Here we propose to test this technique in the context of DW-MRS.Methods
All experiments were performed on a 9.4T horizontal magnet equipped with 400mT/m gradients using a home-built surface 1H-quadrature transceiver. Five adult male Wistar rats were scanned under isoflurane anesthesia (~1.5%).DW-MRS data were acquired using localized STEAM-based spectroscopic pulse sequence[7] (TE/TM/TR=15/112/4000 ms) in a voxel of 168μl. Diffusion gradients were applied simultaneously along three orthogonal directions (δ=6 ms, Δ=120 ms). A total of ten b-values with the following number of repetitions were acquired: 0.4(128), 1.5(128), 3.4(128), 6.0(128), 7.6(128), 13.4(256), 15.7(384), 20.8(384), 25.2(384) and 33.3(384) ms/μm2.
Raw individual spectra were corrected for phase and frequency drift. Resulting complex-valued FID’s were split into real and imaginary parts and organized into a matrix X where the first dimension contained the time domain sampling and the second dimension a concatenation of all repetitions and b-values. Real and imaginary matrices were further concatenated to increase matrix size. Matrix X was denoised using the MP-PCA approach[5]. Residuals were carefully inspected. Raw and denoised spectra respectively were further averaged (for each b-value) and metabolite concentrations were quantified using LCModel with an appropriate basis-set. Since the performance of MP-PCA denoising improves with data redundancy (i.e. number of measurements), one eighth of all available repetitions were retained for each shell, and denoising was repeated on this smaller raw data subset.
We assessed the improvement in SNR of spectra and in Cramer-Rao bounds (CRB) of metabolite concentrations as a result of MP-PCA denoising. In the context of DW-MRS, the impact of denoising on the estimation of metabolite diffusivity and kurtosis in this small cohort of control rats was also evaluated.
Results
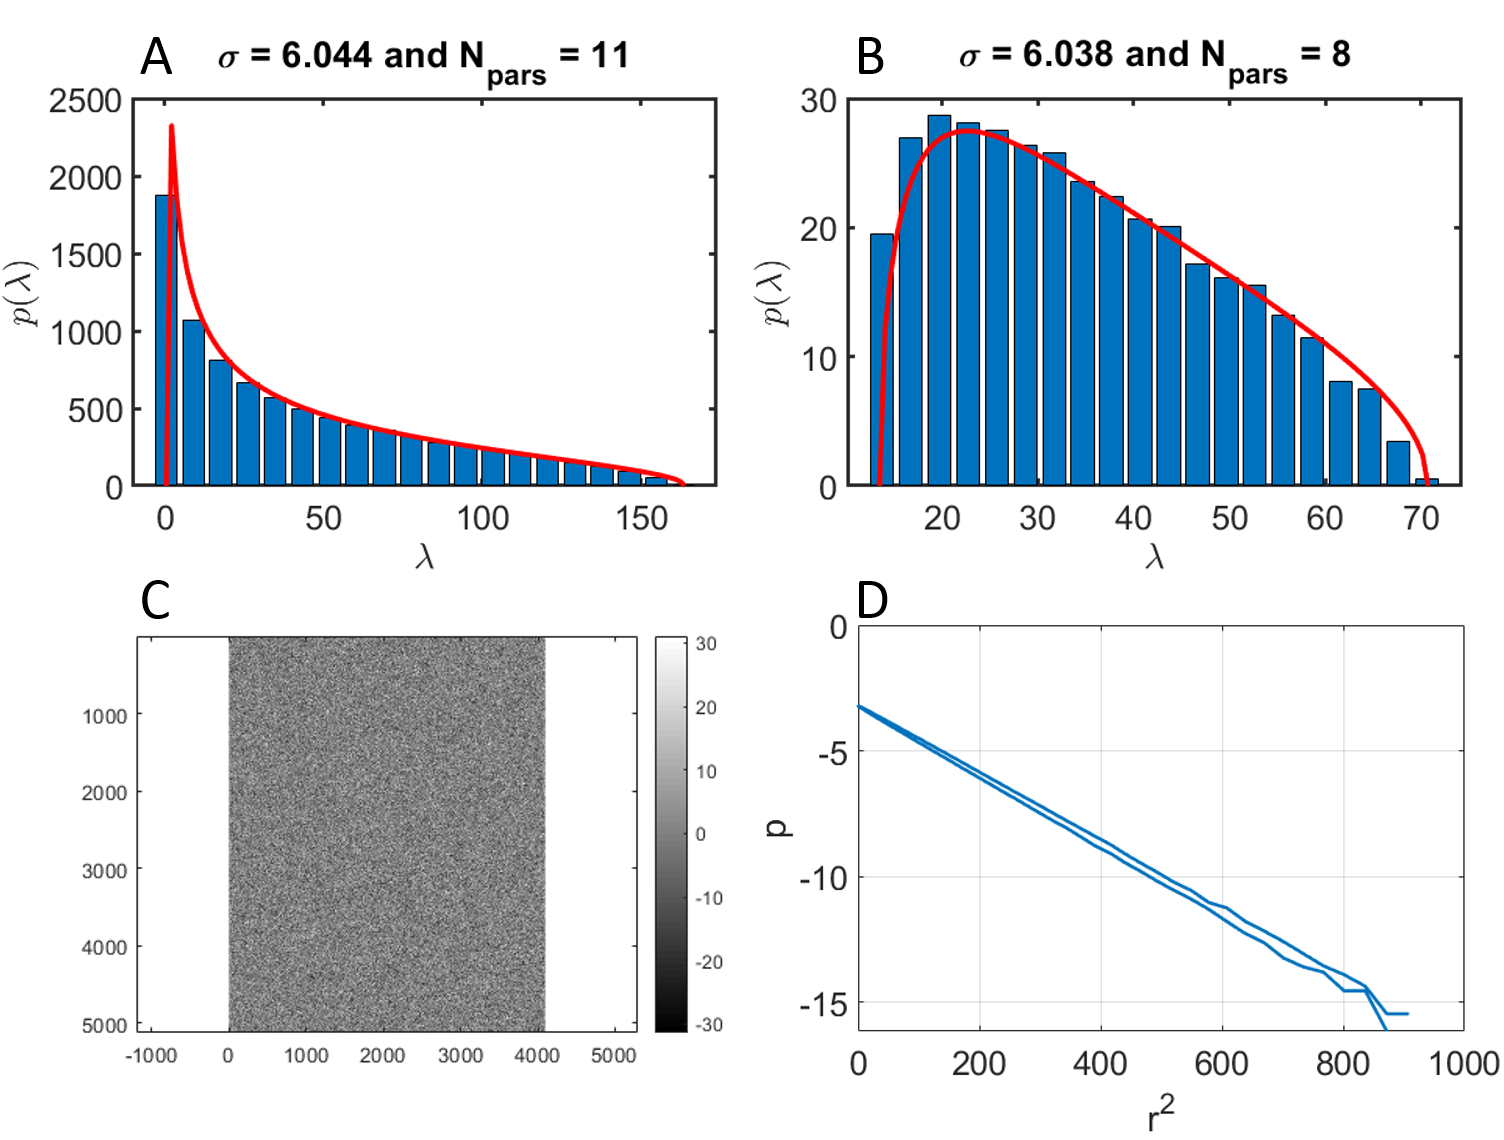
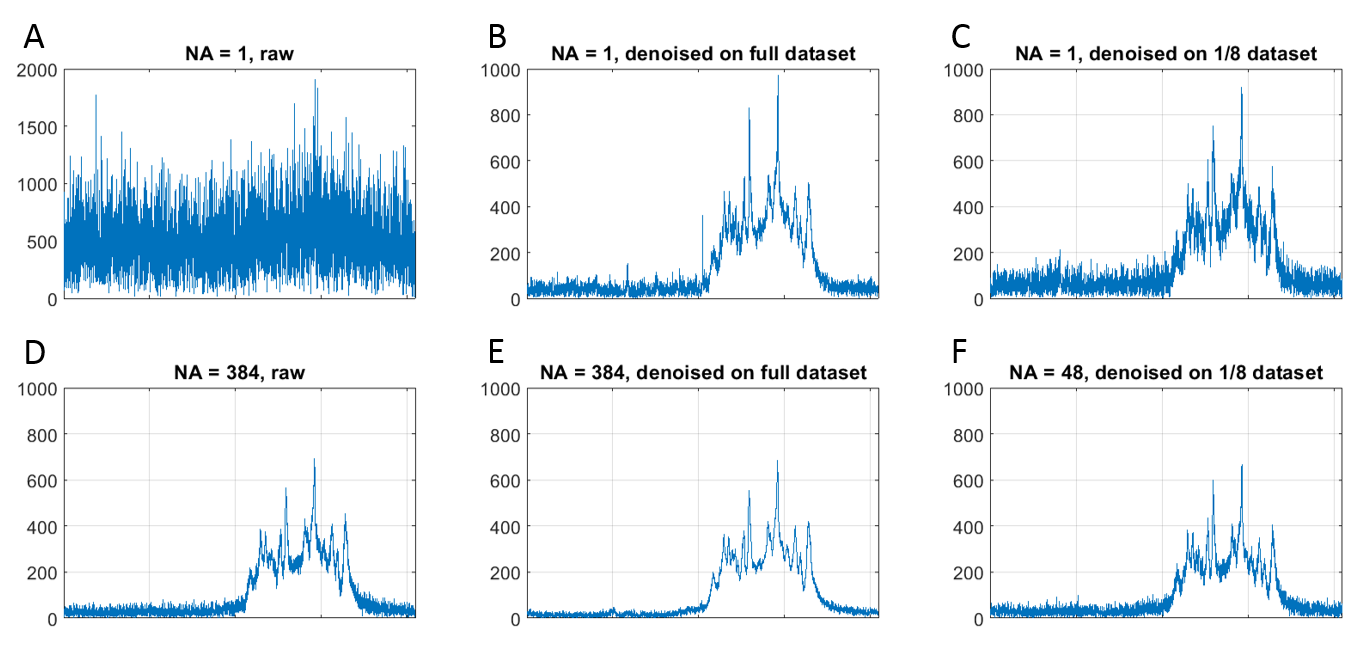
Denoising performed well, yielding good fits to the MP distribution and a Gaussian distribution of residuals (Figure 1).Figure 2 shows an example of raw and denoised spectrum at the highest b-value (single acquisition and averaged spectra). The increase in SNR is dramatic, and a clean spectrum with at least eight distinguishable metabolites can be seen on a single denoised repetition. Furthermore, starting from 1/8 of the data, denoising and averaging yielded comparable spectrum quality to averaging the full dataset.
Quantitatively, denoising increased the SNR, as estimated by LCModel, by 56±16% for low b-value spectra (b=1.5 ms/μm2) and by 107±48% for high b-value spectra (b=33.3 ms/μm2). CRB were substantially reduced, especially at high b-values (Figure 3). Of note the number of averages was different for low and high b-value spectra. In the present work we focused on reporting the main brain metabolites used for DW-MRS modeling. We underline that additional low concentrated metabolites (i.e. GSH, Asc, Asp) also benefited from improvements in CRB. We noted however a line broadening in the denoised spectra that requires further investigation.
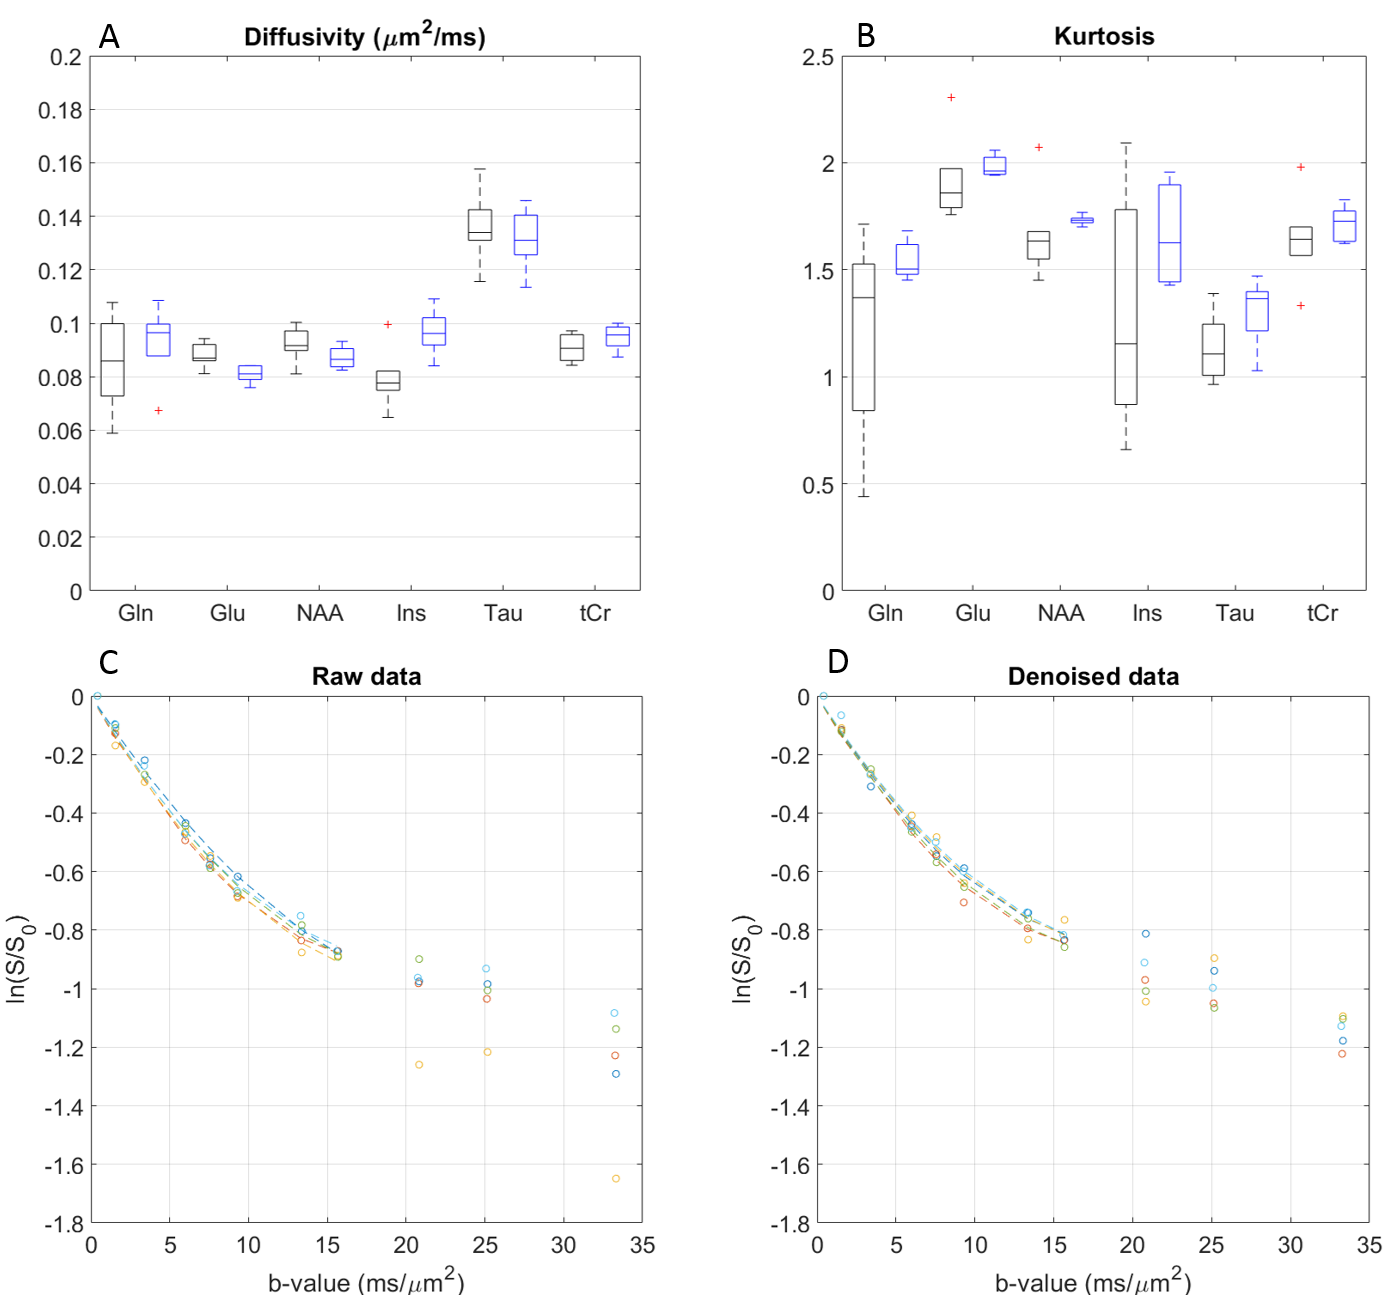
Metabolite diffusivity and kurtosis estimates were impacted by denoising (Figure 4) both in terms of bias and precision, the latter being improved. Bias needs to be further explored in simulations.
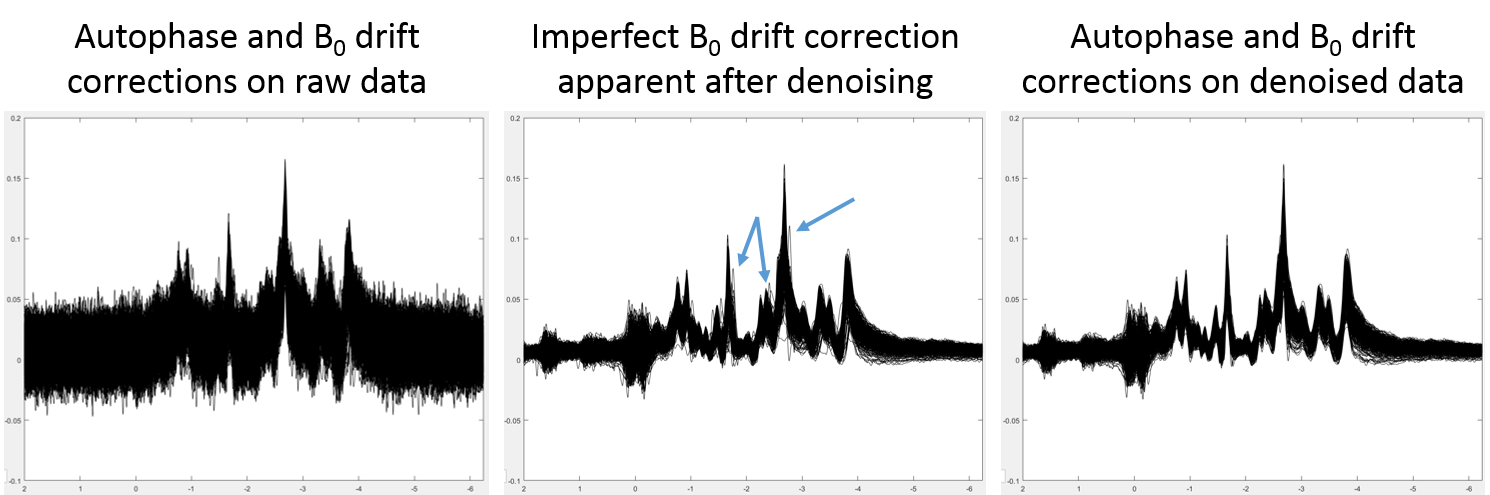
It is well known that DW-spectra need to be corrected for phase distortions and frequency drifts before averaging. At high b-values the SNR drops considerably thus these corrections are very difficult to perform leading to errors during quantification and modeling. In the present work we have also observed a considerable improvement for these corrections when using denoised spectra (Figure 5).
Discussion and Conclusions
Denoising significantly improved spectral SNR and metabolite quantification, particularly for highly diffusion-weighted spectra. Metabolites become distinguishable on a single repetition at b=33 ms/μm2. This method therefore offers tremendous potential for reducing the number of averages needed in an experiment. We underline however that the performance of denoising improves with the number of measurements and the optimum between the latter and final spectral quality will be assessed in the coming months, but an eight-fold reduction in scan time already seems possible. A valuable approach would be to diversify the DW-MRS acquisition scheme into multiple b-values, directions and diffusion times instead of plain repetitions, thereby keeping a large number of measurements but extracting richer information from the acquired data. Reducing the voxel size for improved localization also becomes possible. MP-PCA is expected to have a dramatic impact also on temporal resolution in functional MRS, X-nuclei MRS and on acquisition time and/or spatial resolution in chemical shift imaging, making these techniques better suited for clinical protocols.Acknowledgements
This work was supported by the Center for Biomedical Imaging of the UNIL, UNIGE, HUG, CHUV, EPFL, the Leenaards and Jeantet Foundations and the SNSF project no 310030_173222/1.References
[1] Y.Y. Lin, L.P. Hwang, NMR Signal Enhancement Based on Matrix Property Mappings, Journal of Magnetic Resonance, Series A, 103 (1993) 109-114.
[2] L. Youhong, S. Joshi, J.M. Morris, Noise reduction for NMR FID signals via Gabor expansion, IEEE Transactions on Biomedical Engineering, 44 (1997) 512-528.
[3] O.A. Ahmed, M.M. Fahmy, NMR signal enhancement via a new time-frequency transform, IEEE transactions on medical imaging, 20 (2001) 1018-1025.
[4] O.A. Ahmed, New denoising scheme for magnetic resonance spectroscopy signals, IEEE transactions on medical imaging, 24 (2005) 809-816.
[5] J. Veraart, D.S. Novikov, D. Christiaens, B. Ades-Aron, J. Sijbers, E. Fieremans, Denoising of diffusion MRI using random matrix theory, NeuroImage, 142 (2016) 394-406.
[6] M.D. Does, J.L. Olesen, K.D. Harkins, T. Serradas-Duarte, D.F. Gochberg, S.N. Jespersen, N. Shemesh, Evaluation of principal component analysis image denoising on multi-exponential MRI relaxometry, Magnetic resonance in medicine : official journal of the Society of Magnetic Resonance in Medicine / Society of Magnetic Resonance in Medicine, 81 (2019) 3503-3514.
[7] N. Kunz, C. Cudalbu, V. Mlynarik, P.S. Huppi, S.V. Sizonenko, R. Gruetter, Diffusion-weighted spectroscopy: a novel approach to determine macromolecule resonances in short-echo time 1H-MRS, Magnetic resonance in medicine : official journal of the Society of Magnetic Resonance in Medicine / Society of Magnetic Resonance in Medicine, 64 (2010) 939-946.
Figures