0394
Deep learning based T1-enhanced selection of linear attenuation coefficients for PET/MR attenuation correction: accuracy and repeatability1Mallinckrodt Institute of Radiology, Washington University School of Medicine, St. Louis, MO, United States, 2Department of Neurology, Washington University School of Medicine, St. Louis, MO, United States, 3Athinoula A. Martinos Center for Biomedical Imaging, Massachusetts General Hospital, Charlestown, MA, United States, 4Department of Radiology, Harvard Medical School, Boston, MA, United States, 5Department of Neurological Surgery, Washington University School of Medicine, St. Louis, MO, United States
Synopsis
We proposed a 3D patch based residual U-Net method to estimate pseudo CT images for PET/MR attenuation correction by including quantitative R1 maps as input. The proposed deep learning based T1-enhanced selection of linear attenuation coefficients (DL-TESLA) method outperformed the deep learning methods using UTE-R2* or MPRAGE as inputs with a similar network structure. Moreover, we demonstrated that DL-TESLA had an excellent PET test-retest repeatability that was comparable to PET/CT, supporting its use for PET/MR AC in longitudinal studies of neurodegenerative diseases.
Introduction
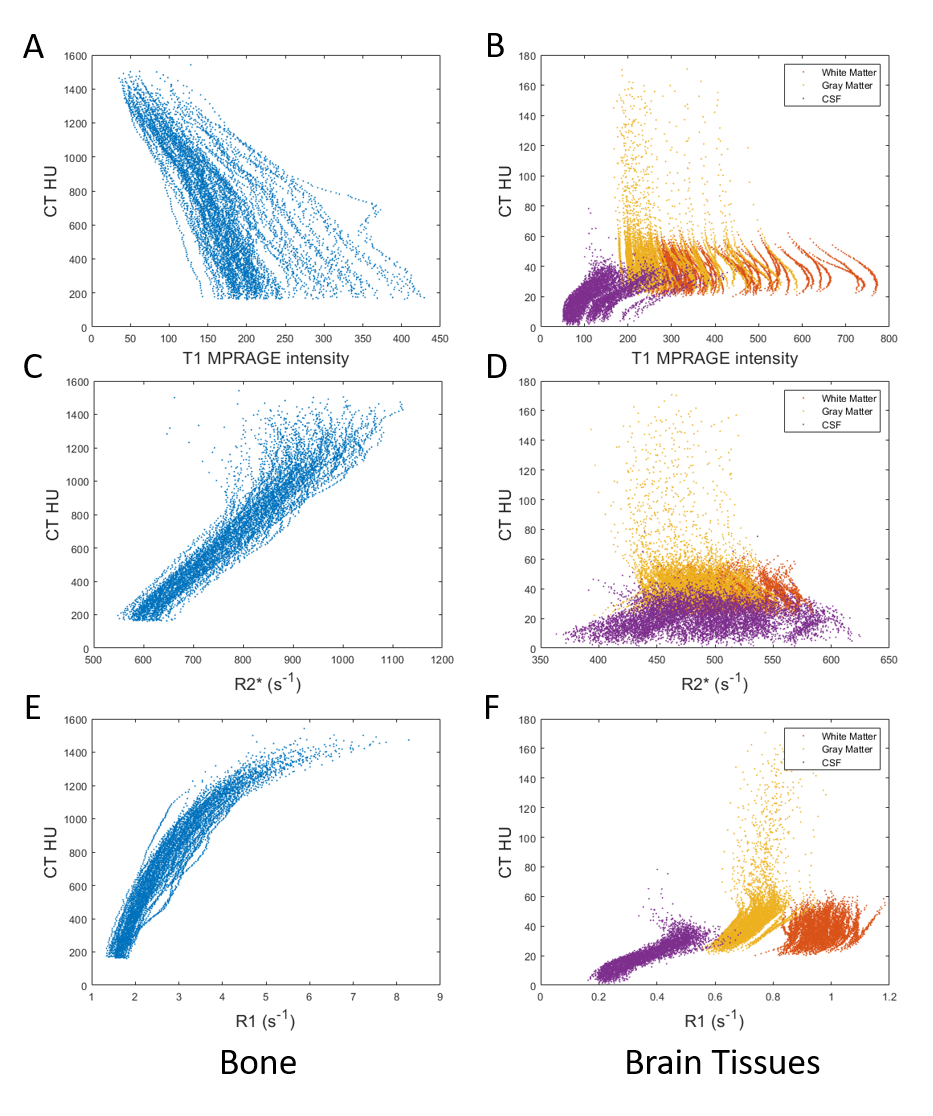
Deep learning-based methods have demonstrated improved accuracy for PET attenuation correction (AC) 1-6, when compared to conventional methods. Most existing deep learning based methods used MR signal as input. However, MR signal is not associated with electron density and has large inter-subject variability. T1 MPRAGE intensities had no correlation with CT Hounsfield Unit (HU) in bone or soft tissues (Figure 1 A and B). In contrast, quantitative UTE R2* was associated with CT HU in bone, but not in soft tissues7, 8 (Figure 1 C and D). Moreover, quantitative UTE R1 was associated with CT HU not only in bone but also in soft tissues (Figure 1 E and F). This observation motivates the inclusion of UTE R1 maps as input to a deep learning method to derive pseudo CT (pCT) images. The method was dubbed as Deep Learning-based T1-Enhanced Selection of Linear Attenuation Coefficients (DL-TESLA). Thus far, it remains unclear whether MR based methods can provide sufficient PET AC accuracy for longitudinal follow-up studies in neurodegenerative diseases. To this end, we aimed to evaluate the test-retest repeatability of DL-TESLA using PET/CT repeatability as a reference.Methods
PET/MR and PET/CT images were acquired from two groups of volunteers with approved IRB and informed consent. Group A consists of 174 subjects (median age [IQR]: 70 [64.5 75] years old; 103 female) with tri-modality PET/MR and PET/CT data at one time point. Group B consists of 24 subjects (11 female) with longitudinal tri-modality PET/MR and PET/CT data at two time points, which were acquired with 36 [31.75 39] months (median [IQR]) in between.Low dose CT images were acquired at 120kVp from all participants. PET images were acquired using a 18F-Florbetapir tracer. Dual flip angle (FA1/FA2=3°/15°) and dual echo (TE1/TE2=0.07/2.46ms) UTE images were acquired to compute UTE-R1 and UTE-R2* maps. Freesurfer was used to segment and parcellate T1 MPRAGE images.
We developed a 3D patch-based residual U-Net (ResUNet) structure to generate pCT from MR images. The neural network consists of 7 layers with both contraction and expanding paths. The cost function is the absolute difference between the estimated and the ground-truth CTs. Subjects from Group A were randomly divided into training set (n=72), validation set (n=18) and testing set (n=84). Three sets of images were used as input for the ResUNet: (1) UTE-R1 map, UTE-FA3Echo1 image, UTE-FA15Echo1 image (DL-TESLA); (2) UTE-R2* map, UTE-FA15Echo1 image, UTE-FA15Echo2 image (UTE-R2*) and (3) T1 MPRAGE image (MPRAGE). Over 1.8 million randomly selected 3D patches (size 64x64x64) were used in the ResUNet training.
The trained networks were applied to the testing set to generate pCT images. CT and pCT images were converted to attenuation maps through a piecewise linear scaling. PET images were reconstructed using e7Tools with four attenuation maps (1) gold standard CT-based map. (2) DL-TESLA map (3) UTE-R2* map (4) MPRAGE map.
To evaluate the test-retest repeatability of DL-TESLA, for each subject in Group B, the same PET listmode data were reconstructed with the MR AC maps from DL-TESLA (PET_MR1 and PET_MR2) and CT AC maps (PET_CT1 and PET_CT2) from 2 visits. The test-retest repeatability of MR AC and CT AC were then evaluated, respectively. Standard uptake value ratio (SUVR) in mean cortical (MC) region, a primary region of interest for amyloid imaging, were calculated using PET Unified Pipeline9 with cerebellum gray matter (CER) as a reference region.
Results
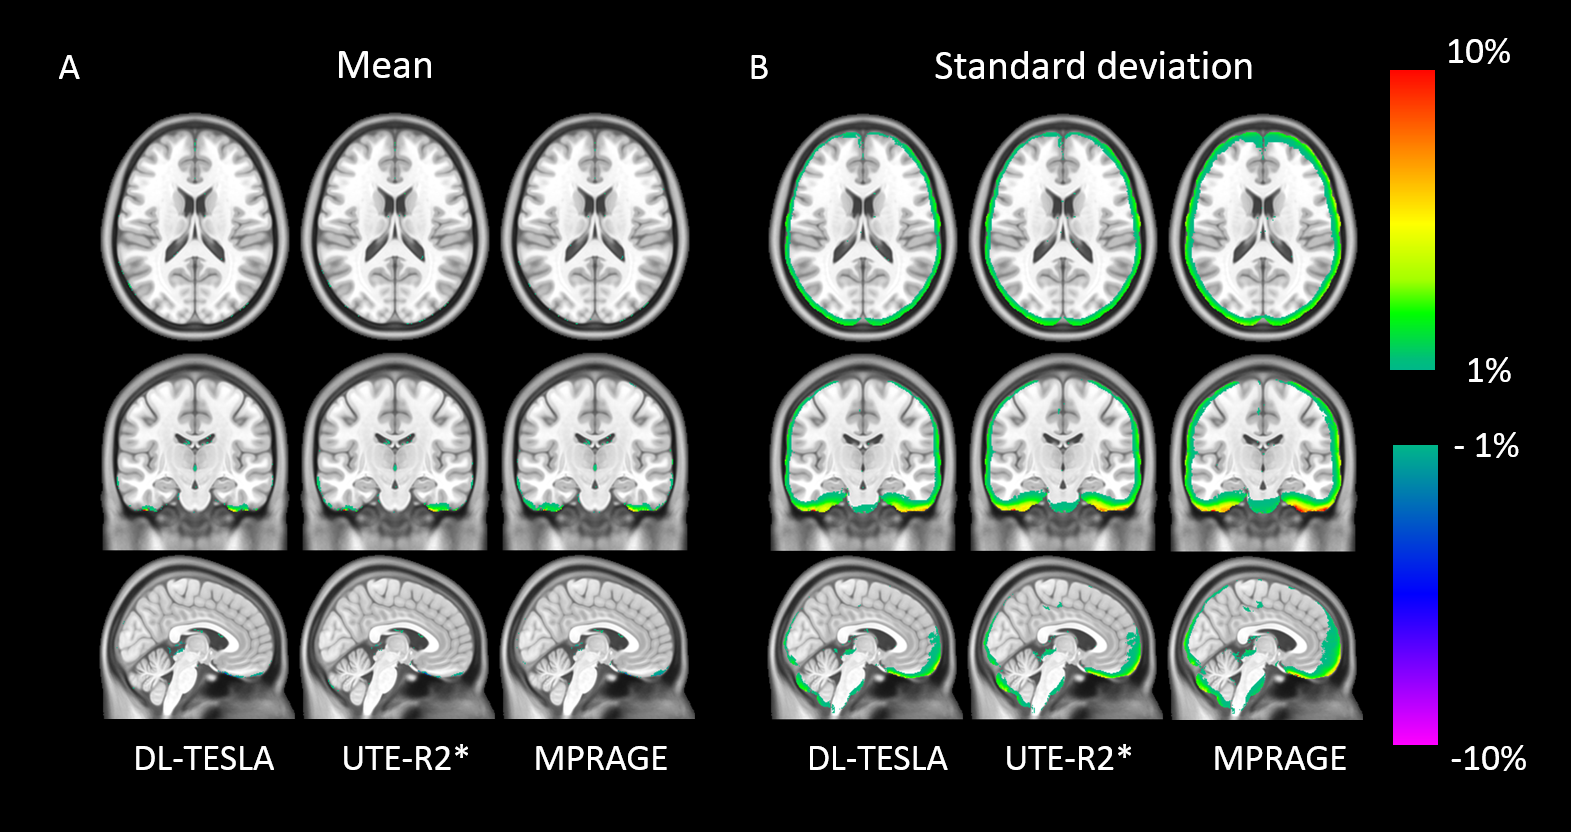
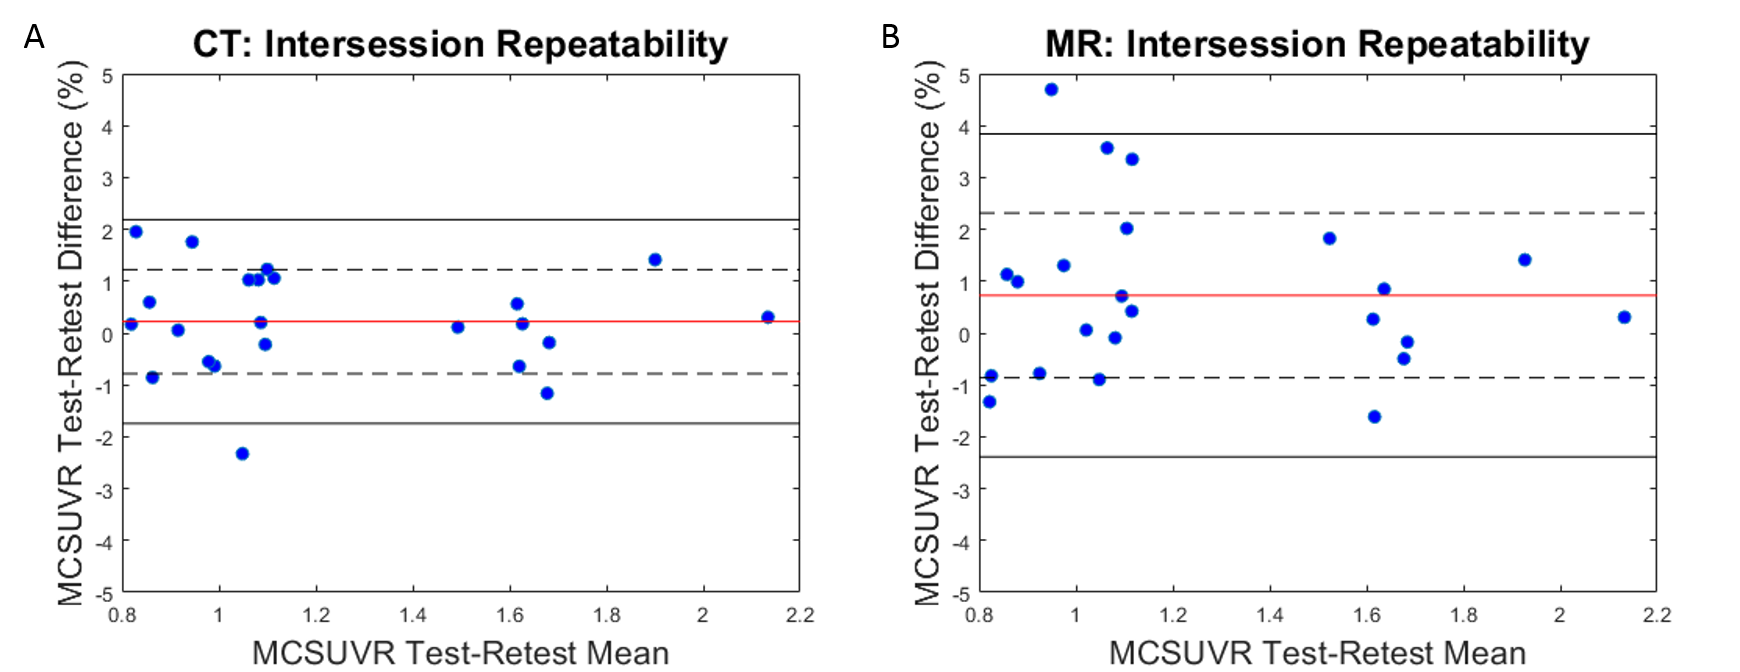
Figure 2 illustrates the mean and standard deviation of PET reconstruction bias across testing cohort. As shown in Figure 3, a small PET bias (within ±2%) was consistently achieved in all subjects when using the DL-TESLA method. In contrast, the spread of PET bias is slightly larger using the UTE-R2* method, while it is the largest in the MPRAGE method, suggesting the inter-subject variability is the least in DL-TESLA. The absolute PET bias of the DL-TESLA method was significantly smaller than the UTE-R2* method in mean cortical region (p=0.0016), and was significantly smaller than the MPRAGE method in both cerebellum gray (p<0.0001) and mean cortical regions (p=0.03). 99.52%±0.07% of brain voxels have PET bias within ±5% for DL-TESLA method, which is significantly higher than both UTE-R2* (98.79%±0.09%, p<-10-6) and MPRAGE method (97.36%±1.52%, p<-10-6) (Figure 4). As demonstrated in the Bland-Altman plot in Figure 5, the test-retest repeatability of PET/MR with the DL-TESLA method is excellent. The relative MCSUVR test-retest differences was 0.22%±1.00% for CT-based method, and 0.73%±1.59% for the DL-TESLA method.Discussion and Conclusion
We demonstrated that the proposed DL-TESLA method, by including quantitative R1 maps in deep learning input, significantly improved PET/MR AC accuracy, which outperformed both UTE-R2* and MPRAGE methods. Moreover, the test-retest repeatability of DL-TESLA was excellent. Landau et al reported that the annual mean relative SUVR change in the entire cortex region was 0.8±1.6% in controls, and 1.4±3.9% in patients using 18F-Florbetapir PET/CT10. Tolboom et al reported that the SUVR test-retest repeatability was 4.4±4.2% in healthy controls and 8.0±7.0% in AD patients using 11C-PiB PET/CT11. The SUVR test-retest repeatability of the DL-TESLA method was comparable to that of PET/CT, supporting its use for PET/MR AC in longitudinal studies for neurodegenerative diseases.Acknowledgements
This study was supported by grant from the National Institute of Health NIH 1R01NS082561, 1P30NS098577.References
1. Emami, Hajar, et al. "Generating synthetic CTs from magnetic resonance images using generative adversarial networks." Medical physics 45.8 (2018): 3627-3636.
2. Liu, Fang, et al. "Deep learning MR imaging–based attenuation correction for PET/MR imaging." Radiology 286.2 (2017): 676-684.
3. Gong, Kuang, et al. "Attenuation correction for brain PET imaging using deep neural network based on Dixon and ZTE MR images." Physics in Medicine & Biology 63.12 (2018): 125011.
4. Leynes, Andrew P., et al. "Direct pseudoCT generation for pelvis PET/MRI attenuation correction using deep convolutional neural networks with multi-parametric MRI: zero echo-time and dixon deep pseudoCT (ZeDD-CT)." Journal of Nuclear Medicine (2017): jnumed-117.
5. Leynes, Andrew P., et al. "Zero-echo-time and Dixon deep pseudo-CT (ZeDD CT): direct generation of pseudo-CT images for pelvic PET/MRI attenuation correction using deep convolutional neural networks with multiparametric MRI." Journal of Nuclear Medicine 59.5 (2018): 852-858.
6. Ladefoged, Claes Nøhr, et al. "Deep learning based attenuation correction of PET/MRI in pediatric brain tumor patients: Evaluation in a clinical setting." Frontiers in neuroscience 12 (2018): 1005.
7. Ladefoged, Claes N., et al. "Region specific optimization of continuous linear attenuation coefficients based on UTE (RESOLUTE): application to PET/MR brain imaging." Physics in Medicine & Biology 60.20 (2015): 8047.
8. Juttukonda, Meher R., et al. "MR-based attenuation correction for PET/MRI neurological studies with continuous-valued attenuation coefficients for bone through a conversion from R2* to CT-Hounsfield units." Neuroimage 112 (2015): 160-168.
9. Su, Yi, et al. "Quantitative analysis of PiB-PET with freesurfer ROIs." PloS one 8.11 (2013): e73377.
10. Landau, Susan M., et al. "Measurement of longitudinal β-amyloid change with 18F-florbetapir PET and standardized uptake value ratios." Journal of Nuclear Medicine 56.4 (2015): 567-574.
11. Tolboom, Nelleke, et al. "Test-retest variability of quantitative [11 C] PIB studies in Alzheimer’s disease." European journal of nuclear medicine and molecular imaging 36.10 (2009): 1629-1638.
Figures