0393
Making SPICE Spicier with Sparse Sampling of (k, t)-Space and Learned Subspaces1Department of Electrical and Computer Engineering, University of Illinois at Urbana-Champaign, Urbana, IL, United States, 2Beckman Institute for Advanced Science and Technology, University of Illinois at Urbana-Champaign, Urbana, IL, United States, 3School of Biomedical Engineering, Shanghai Jiao Tong University, Shanghai, China, 4Med-X Research Institute, Shanghai Jiao Tong University, Shanghai, China
Synopsis
SPICE has recently provided a unique capability for simultaneous acquisition of metabolite and water spectroscopic signals. While the water signals are often removed as nuisance components in traditional MRSI experiments, SPICE utilizes the water signals for QSM, MWF mapping, etc. In this work, we further extend SPICE data acquisition to achieve much larger k-space coverage and improve its processing scheme for simultaneous MRSI/QSM/SWI/MWF mapping. In vivo experiments demonstrated that this new scheme improved the accuracy of water/lipid removal, reduced the effects of field inhomogeneity, and achieved higher resolution for QSM, SWI and MWF using the unsuppressed water signals.
Introduction
SPICE (SPectroscopic Imaging by exploiting spatiospectral CorrElation) has recently demonstrated a desired imaging capability for simultaneous acquisition of MRSI, QSM, and MWF by eliminating water/lipid suppression.1-3 This paper addresses several important practical issues to further enhance the practical utility of SPICE for general clinical imaging applications: (1) robust removal of water and lipid signals, (2) handling of large field inhomogeneity and susceptibility effects in the frontal region, and (3) improved resolution of QSM, SWI and MWF. To address these issues, we propose a new data acquisition scheme that significantly increases k-space coverage and an improved data processing method that incorporates learned subspaces to process the sparsely sampled (k, t)-space data. In a 7-min scan, the proposed method can acquire metabolite spectroscopic signals at 2.0 × 3.0 × 3.0 mm3 nominal resolution and water spectroscopic signals at 1.0 × 1.0 × 1.2 mm3 nominal resolution. The proposed method has been validated using in vivo experimental data, producing high-quality metabolic maps and high-resolution QSM, SWI and MWF maps.Methods
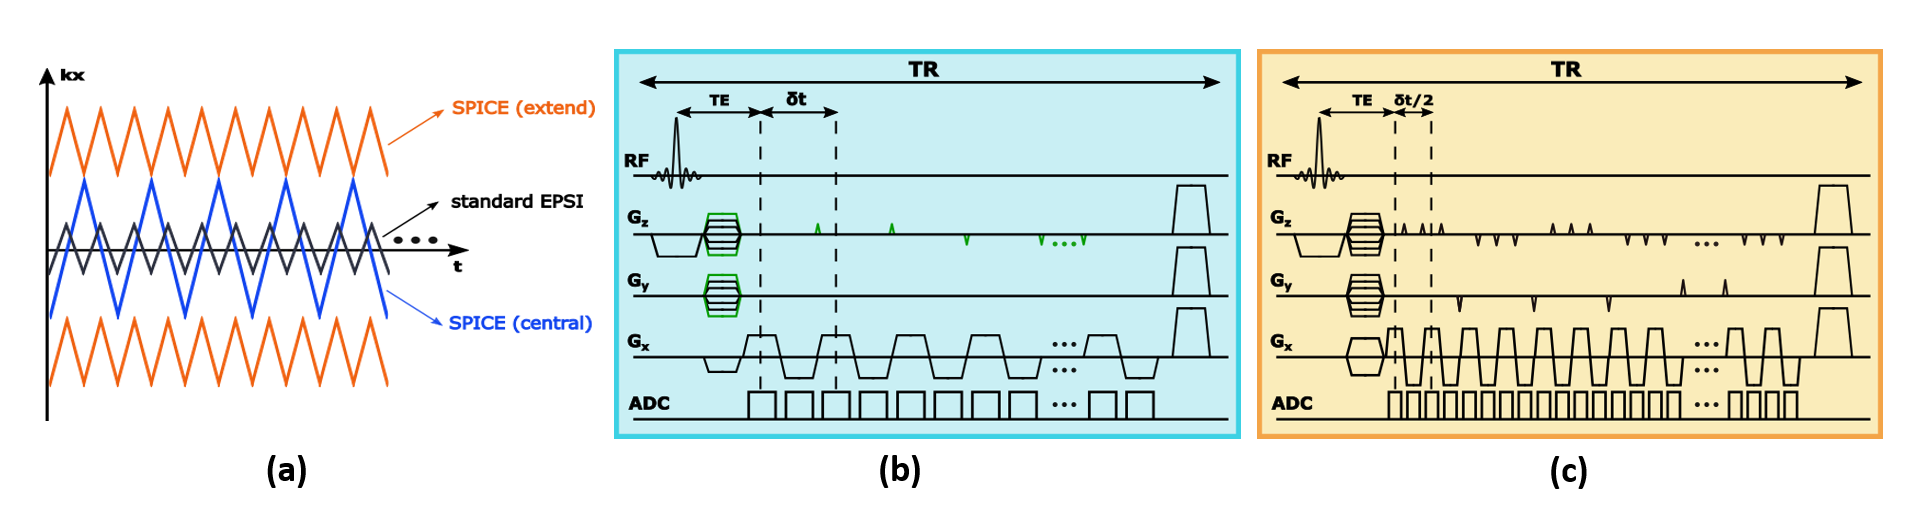
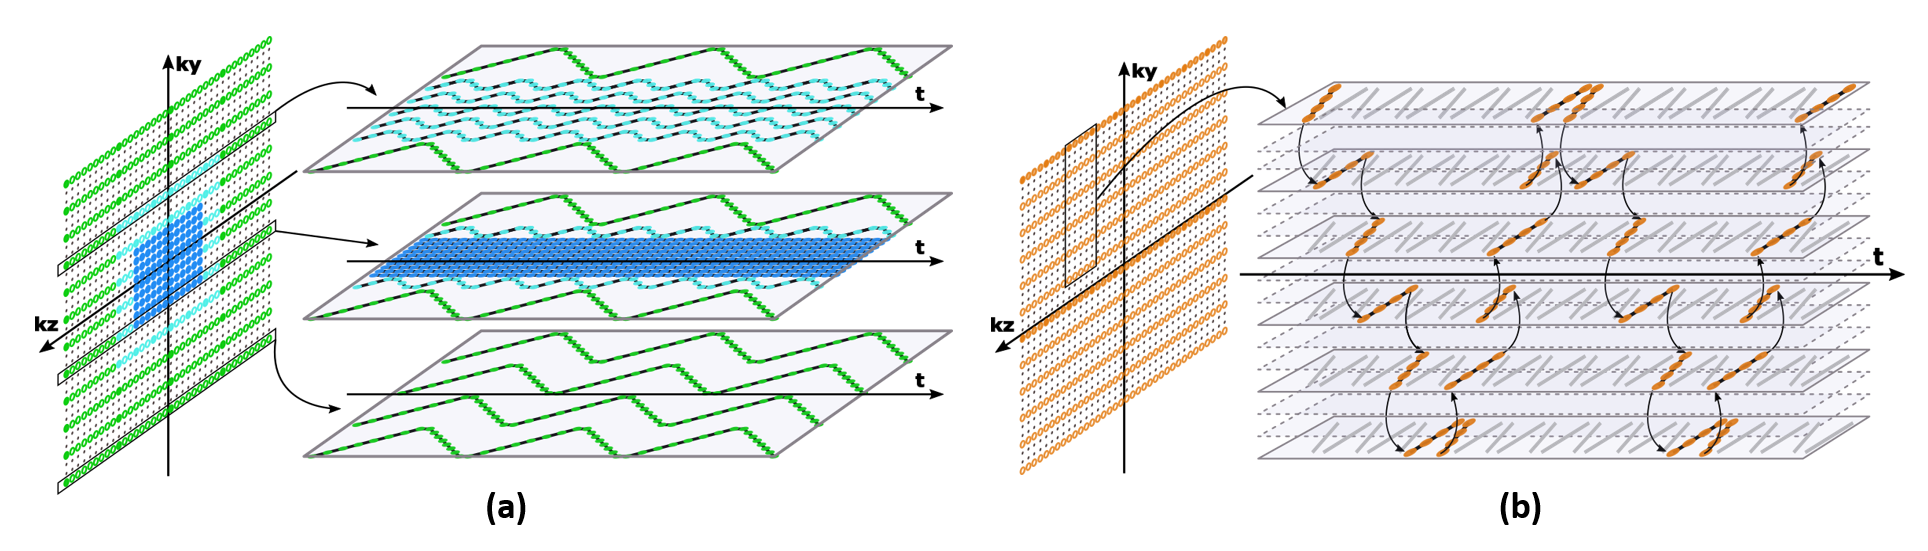
Data acquisition with sparse sampling: The proposed data acquisition scheme keeps the essential features of basic SPICE sequence for simultaneous MRSI/QSM/SWI/MWF, and significantly extends the k-space coverage using a highly sparse sampling strategy. The basic SPICE acquisition features include: (1) elimination of water/lipid suppression, (2) FID-based acquisition with ultrashort TE (1.6 ms) and short TR (160 ms), (3) EPSI-based trajectories with large echo space for rapid acquisition of spatiospectral signals (Fig. 1). Built on these features, the proposed sequence keeps the central k-space fully sampled for metabolic signals and extends the peripheral k-space for unsuppressed water signals. The extension is achieved by: (1) adding two extended EPSI readouts aside the central readout to increase k-space coverage in kx (Fig. 1a), (2) using highly sparse and variable density sampling with blipped phase encodings to achieve large k-space coverage in ky and kz (Fig. 2). More specifically, in the central readout, the (k, t)-space is divided into three segments with undersampling factors of 1, 3, 3 in ky and 1, 3, 12 in time, respectively. In the two extended readouts, with undersampling by a factor of 3 in ky plus a factor of 32 along time, the final acceleration factor of 96 can be achieved. With all these features, the proposed sequence is able to achieve ultrahigh-resolution water signals (with nominal resolution of 1.0 × 1.0 × 1.2 mm3) and high-resolution metabolite signals (with nominal resolution of 2.0 × 3.0 × 3.0 mm3) in a 7-min scan.Image reconstruction with learned subspaces: The proposed data acquisition scheme poses a new processing issue: reconstruction of water/lipids from highly sparse measurements. To address this issue, we utilize the union-of-subspaces framework incorporating better subspace estimation. More specifically, our previous works estimated the water/lipids basis functions from low-resolution measurements, which often resulted in large spectral distortions and line broadening due to the B0 inhomogeneity.4-6 In this work, we estimated the subspaces from high-resolution training datasets, which were acquired independently from the actual imaging experiments. These pre-learned basis functions were then incorporated into the following constrained reconstruction:
$$\min_{\{ U_{l_w} \},\{ U_{l_f} \}}||d-\Omega_k \mathcal{F}(M_w\odot \sum_{l_w=1}^{L_f}U_{l_w}(\mathbf{r})V_{l_w}(t)+M_f\odot \sum_{l_f=1}^{L_f}U_{l_f}(\mathbf{r})V_{l_f}(t))||_2^2+R(U_{l_w},U_{l_f})$$
where $$$d$$$ denotes the sparse measurements, $$${V_{l_w}(t)}$$$ and $$${V_{l_f}(t)}$$$ the pre-learned water and lipid basis functions, $$$M_w$$$ and $$$M_f$$$ the corresponding spatial supports, and $$$R$$$ the edge-preserving regularization. This equation coupled with the proposed data acquisition scheme can produce much more accurate estimates of the water/lipid signals with several important consequences for SPICE: (1) more robust and accurate removal of the nuisance signals,7 (2) reduced spectral linewidth and intravoxel dephasing using high-resolution field map,8 and (3) higher resolution QSM, SWI, and MWF.
Results
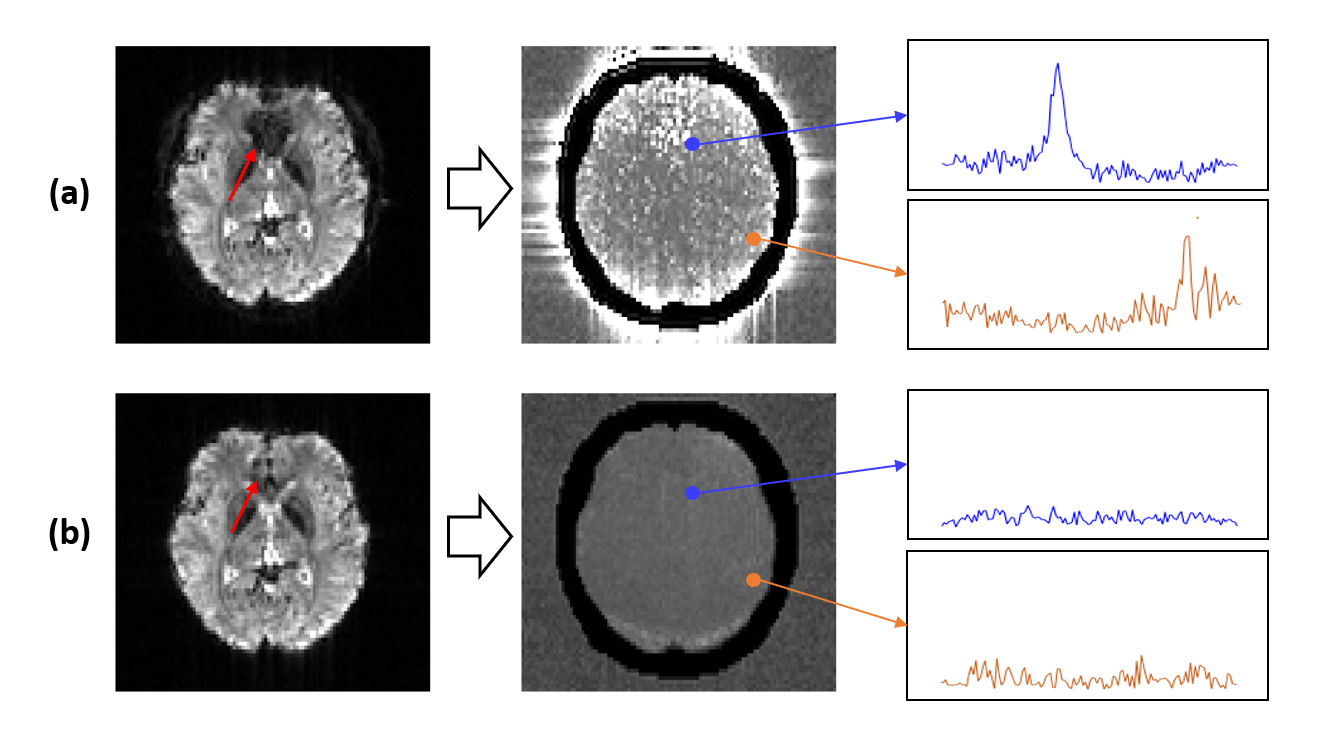
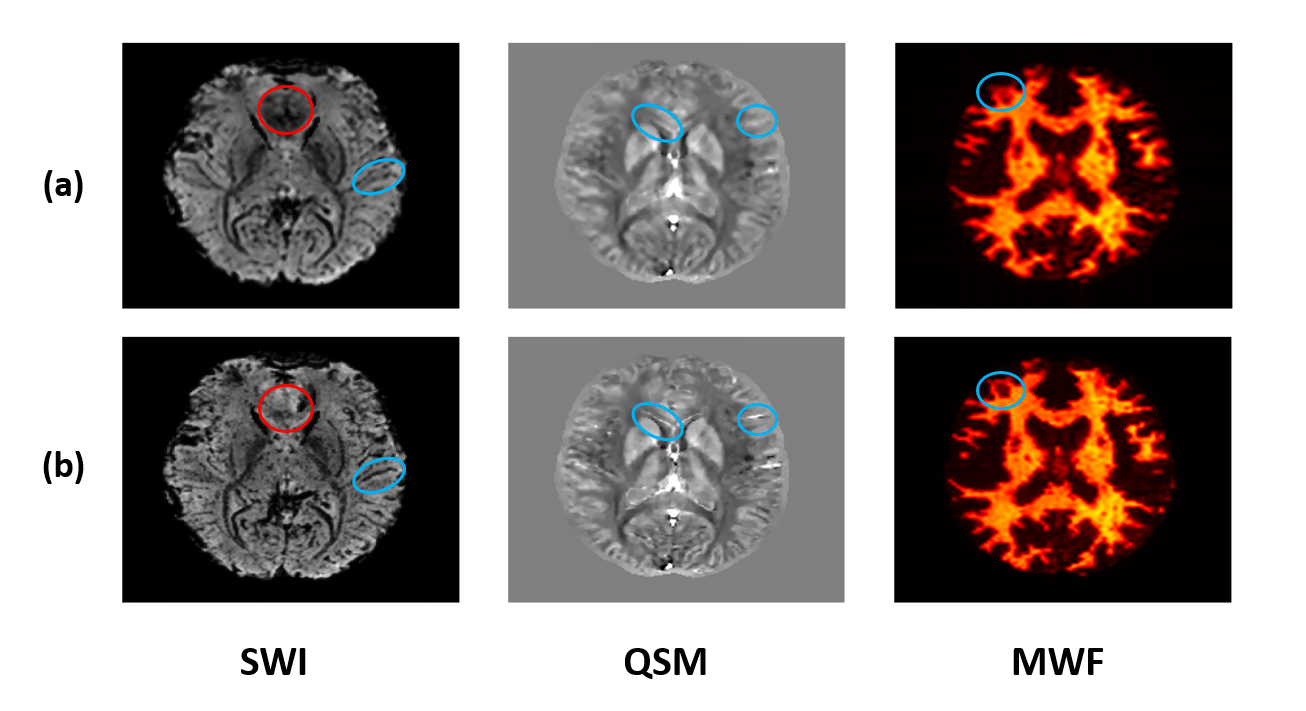
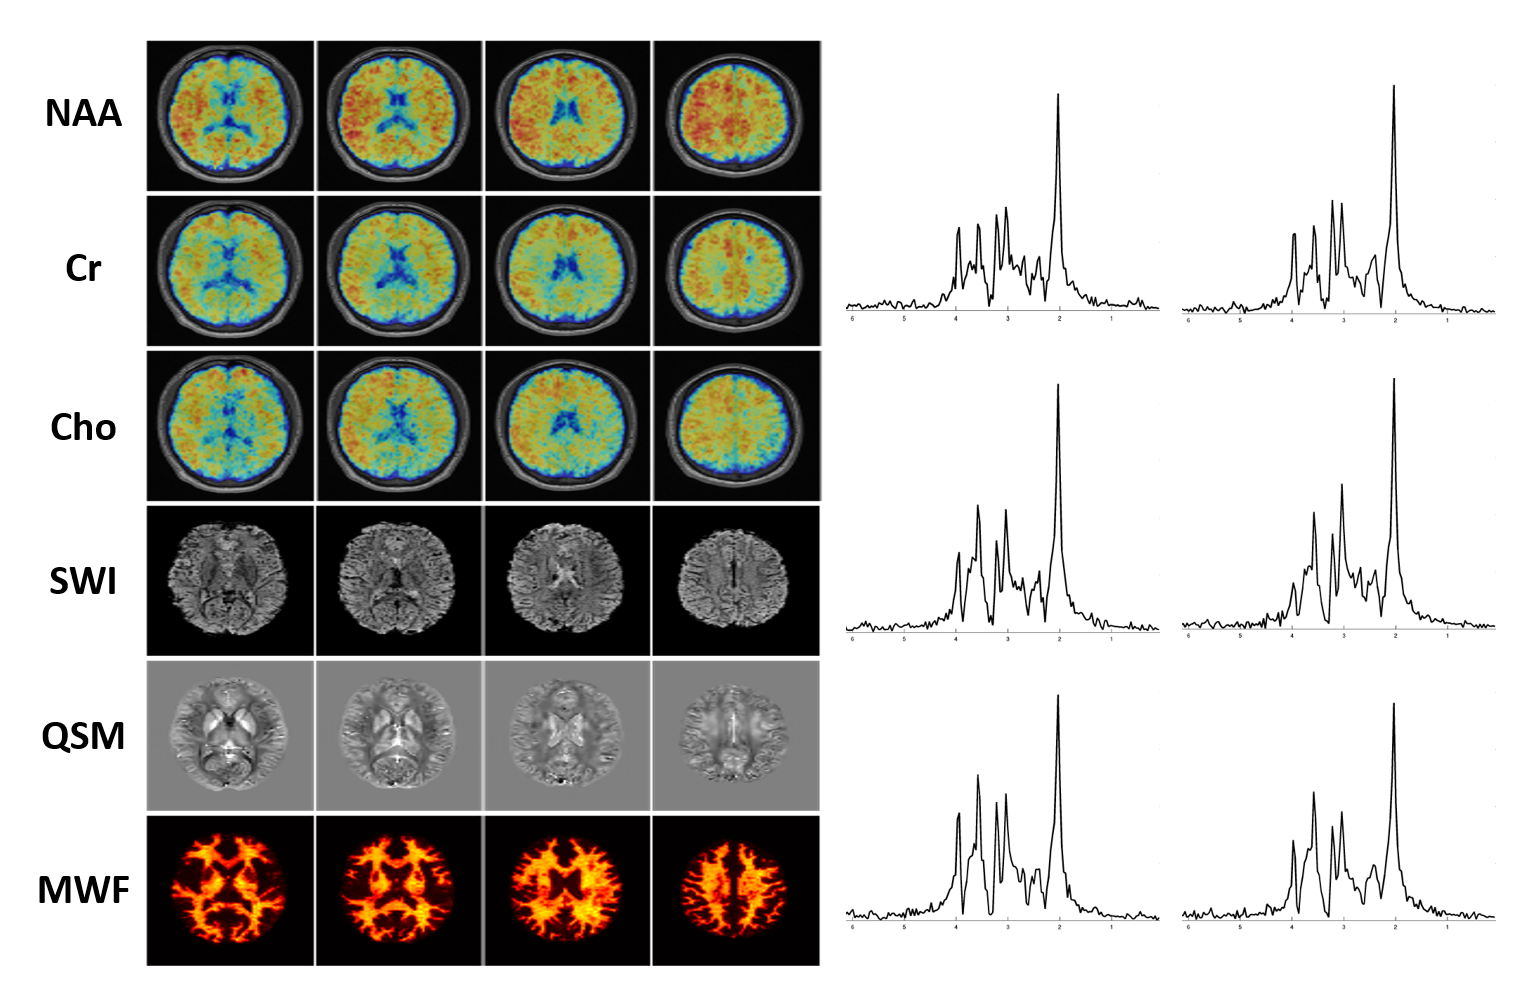
In vivo experiments were performed on healthy adult volunteers on a 3T MR scanner (Siemens Prisma) with Institutional Review Board approved. The MRSI data were acquired with the following key parameters: FOV: 230 × 230 × 72 mm3, TR/TE: 160/1.6 ms, bandwidth: 167 kHz, echo space: 1.76/0.88 ms, matrix size: 218 × 218 × 60, total scan time: 7 minutes. Figure 3 shows the comparison of lipid contamination and water residuals in low-resolution and high-resolution data. The reduction of nuisance signals in the high-resolution data can be clearly observed. Figure 4 compares the SWI, QSM and MWF obtained from low-resolution and high-resolution data. The reduction of signal dephasing and the improvements in image details can be observed. Figure 5 shows a set of representative results, including simultaneously acquired high-resolution signals of metabolites (2.0 × 3.0 × 3.0 mm3), MWF (2.0 × 2.0 × 2.0 mm3), SWI and QSM (1.0 × 1.0 × 1.2 mm3). All these high-quality results were successfully obtained from a single 7-minute scan.Conclusion
This paper presents a major extension of SPICE data acquisition scheme and its processing method. With the proposed method, SPICE can simultaneously map metabolites in high resolution and QSM, SWI and MWF in ultrahigh resolution comparable to those from independent scans. The proposed method will enhance the practical utility of SPICE in various research and clinical applications.Acknowledgements
This work reported in this paper was supported, in part, by the National Institutes of Health (NIH-R21-EB023413, NIH-U01-EB026978)References
1. Lam F, Liang ZP. A subspace approach to high‐resolution spectroscopic imaging. Magn Reson Med. 2014;71(4):1349-1357.
2. Peng X, Lam F, Li Y, et al. Simultaneous QSM and metabolic imaging of the brain using SPICE. Magn Reson Med. 2018;79(4):13-21.
3. Li Y, Guo R, Zhao Y, et al. Rapid High-Resolution Simultaneous Acquisition of Metabolites, Myelin Water Fractions, and Tissue Susceptibility of the Whole Brain Using "SPICY" 1H-MRSI. Proc Intl Soc Magn Reson Med. 2019;27.
4. Lam F, Li Y, Guo R, et al. Ultrafast magnetic resonance spectroscopic imaging using SPICE with learned subspaces. Magn Reson Med. 2019.
5. Liang ZP. Spatiotemporal imaging with partially separable functions. Proc IEEE Int Symp Biomed Imaging. 2007:988–991.
6. Li Y, Lam F, Cliiford B, et al. A subspace approach to spectral quantification for MR spectroscopic imaging. IEEE Trans Biomed Eng. 2017;64(10):2486-2489.
7. Ma C, Lam F, Johnson CL, et al. Removal of nuisance signals from limited and sparse 1H MRSI data using a union‐of‐subspaces model. Magn Reson Med. 2016;75(2):488-497.
8. Peng X, Nguyen H, Haldar J, et al. Correction of field inhomogeneity effects on limited k-space MRSI data using anatomical constraints. Proc IEEE Eng Med Biol Soc. 2010:883-886.
Figures