0390
High-Resolution Dynamic 31P-MRSI of Ischemia-Reperfusion in Rat Using Low-Rank Tensor Model with Deep Learning Priors1Department of Electrical and Computer Engineering, University of Illinois at Urbana-Champaign, Urbana, IL, United States, 2Beckman Institute for Advanced Science and Technology, University of Illinois at Urbana-Champaign, Urbana, IL, United States, 3Department of Biomedical Engineering, Case Western Reserve University, Cleveland, OH, United States, 4Case Center for Imaging Research, Case Western Reserve University, Cleveland, OH, United States, 5Department of Radiology, Case Western Reserve University, Cleveland, OH, United States, 6Department of Physiology and Biophysics, Case Western Reserve University, Cleveland, OH, United States
Synopsis
Dynamic 31P-MRS/MRSI is a promising tool for in vivo quantification of mitochondrial oxidative capacity. However, its practical utility is limited by the inherently low SNR of the 31P signal. This work is built upon our recent progress in accelerating dynamic 31P-MRSI using low-rank tensor models. We extended this method by learning the temporal priors with deep generative models and then incorporating them into the reconstruction via an information theoretical framework. This approach enabled high-resolution dynamic 31P-MRSI with 1.5x1.5x2 mm3 nominal spatial resolution and 5.1-sec temporal resolution in capturing the kinetics of metabolite changes in rat hindlimb during a stimulation-recovery protocol.
Introduction
Dynamic 31P-MRS/MRSI is a promising tool for in vivo quantification of mitochondrial oxidative capacity in skeletal muscle by monitoring the depletion and recovery of the phosphocreatine (PCr) during stimulation-recovery experiments.1-2 However, due to the inherently low SNR of 31P signal, dynamic 31P-MRSI experiments in rodent models are typically limited to low spatiotemporal resolution (≈1 cm3 per voxel, >30 sec/frame). This work is built upon our recent progress in accelerating dynamic 31P-MRSI using a low-rank tensor-based method.3-4 We extended this method by learning the temporal priors with deep generative models and then incorporating them into the reconstruction via an information theoretical framework. Experimental results demonstrate that we can achieve high-resolution dynamic 31P-MRSI with 1.5×1.5×2 mm3 nominal spatial resolution and 5.1-sec temporal resolution in capturing the kinetics of metabolite changes in rat hindlimb during a stimulation-recovery protocol.Method
TheoryThe dynamic 31P-MRSI signal with $$$M$$$ molecules is expressed in terms of a tensor model as3-4:
$$\hspace{16em}\rho(\boldsymbol{x},f,T)=\sum_{m=1}^M\rho_{m}(\boldsymbol{x},f,T)=\sum_{m=1}^M\sum_{\ell=1}^{L_m}\sum_{p=1}^{P_m}c_{m,\ell,p}(\boldsymbol{x})\varphi_{m,\ell}(f)\psi_{m,p}(T),\hspace{7em}(1)$$
where $$$\rho_m(\boldsymbol{x},f,T)$$$ is the image function for the $$$m$$$th molecule, $$$\{\varphi_{m,\ell}(f)\}$$$ and $$$\{\psi_{m,p}(T) \}$$$ are the corresponding spectral and temporal basis functions which can be pre-determined from training datasets.
Eq. (1) is a rather general signal representation and often results in large estimation uncertainty in practice. In this work, additional SNR is gained by incorporating molecule-dependent temporal priors (denoted as $$$\{P_{\mathcal{g},m}\}$$$ ) into the signal model. These prior distributions are captured by deep generative models. The learned distributions are absorbed under the minimum cross-entropy principle by adding the following voxel-wise constraints into Eq. (1) (ignoring $$$\boldsymbol{x}$$$)6-7:
$$\hspace{16em}\text{KL}\left(\int\left\lVert\rho_{m}(f,T)\right\rVert_2^2{df}\:\bigg\rVert\:{s}_{g,m}(T)\right)\leq\delta\hspace{16em}$$
$$\hspace{22em}\text{subj.}\:\text{to}\:s_{g,m}(T)\sim{P}_{\mathcal{g},m}, \hspace{19em}(2)$$
where $$$\text{KL}(\cdot\rVert\cdot)$$$ is the relative entropy and $$$s_{g,m}(T)$$$ represents samples drawn based on the learned distribution $$$P_{\mathcal{g},m}$$$ for the $$$m$$$th molecule.
In Vivo Experiments
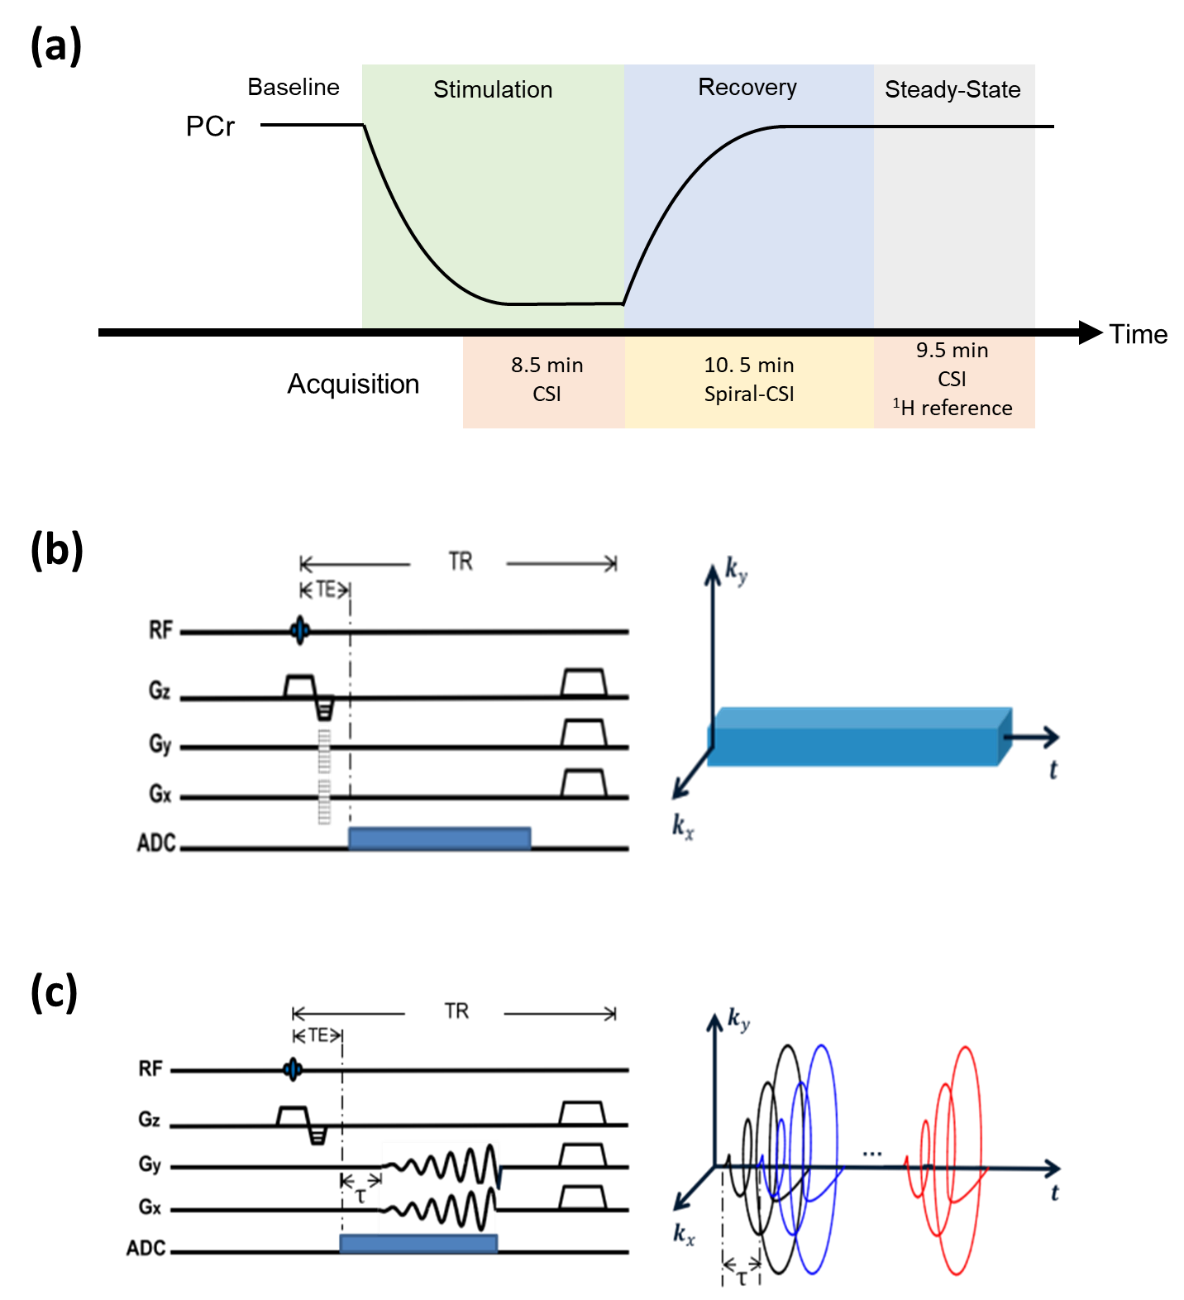
In vivo experiments were performed on three Sprague-Dawley rats on a 9.4T Bruker scanner. Each rat was anesthetized with isoflurane. Muscle contraction was induced by 2-Hz electrical stimulation via electrodes placed over the third lumbar vertebrae and the greater trochanter, leading to PCr depletion. Post-stimulation PCr recovery was captured by dynamic 31P-MRSI using a similar data acquisition scheme described previously (Fig. 1).4 Two spectral training datasets (matrix size: 8×8×6) were acquired before and after PCr recovery using 3D-CSI for adequate SNR in estimating $$$\{\varphi_{m,\ell}(f)\}$$$ . Dynamic imaging data (matrix size: 16×16×8) were acquired continuously for 10.5 min during the recovery period, using spiral trajectories for highly efficient coverage of data space. The TR/TE (160/0.69 ms) and FOV (24×24×16 mm3) were the same for both spectral training and imaging data. The temporal training datasets were experiment-independent and acquired in an existing depletion-recovery study that had similar molecular dynamics.8 Two rounds of stimulation-recovery experiments were conducted for each rat following the same data acquisition scheme.
Image Reconstruction
Molecular-dependent temporal prior $$$P_{\mathcal{g},m}$$$ was learned from the high-SNR training data using DCGAN (deep convolutional generative adversarial networks).5 The trained generative models can generate temporal functions for each molecule based on the prior distributions embedded in the training data.
The learned temporal priors were incorporated into reconstruction of the 5D dynamic 31P-MRSI using a two-step algorithm. First, initial reconstruction was generated by solving:
$$\hspace{16em}\{\bar{c}_{m,\ell,p}\}=\arg\min_{\{c_{m,\ell,p}\}}\left\lVert{d}-\mathcal{F}\left(\sum_{m=1}^M\sum_{\ell=1}^{L_{m}}\sum_{p=1}^{P_m}c_{m,\ell,p}(\boldsymbol{x})\varphi_{m,\ell}(f)\psi_{m,p}(T)\right)\right\rVert_2^2,\hspace{6.5em}(3)$$ where $$$d$$$ is the imaging data and $$$\mathcal{F}$$$ the imaging operator. The initial estimate of the temporal function was synthesized by: $$\hspace{16em}\bar{s}_m(\boldsymbol{x},T)=\int\left\lVert\sum_{\ell=1}^{L_m}\sum_{p=1}^{P_m}\bar{c}_{m,\ell,p}(\boldsymbol{x})\varphi_{m,\ell}(f)\psi_{m,p}(T)\right\rVert_2^2df.\hspace{12em}(4)$$
Second, we incorporated the learned temporal priors by imposing the constraints in Eq. (2), whose solution is (ignoring $$$\boldsymbol{x}$$$)6-7:
$$\hspace{16em}\min_{s_{g,m}\sim{P}_{\mathcal{g},m},\{c_{n}\}}\left\lVert{s}_m(T)-s_{g,m}(T)\sum_{n}c_{n}e^{i2\pi{n}\Delta{F}T}\right\rVert_2^2,\hspace{14.5em}(5)$$
where $$$\Delta{F}$$$ is the spectral resolution corresponding to $$$T$$$ . In practice, since the probability density function $$${P}_{\mathcal{g},m}$$$ is often intractable, we actively generated the random sample $$$s_{g,m}(T)\sim{P}_{\mathcal{g},m}$$$ and solved Eq. (5) until $$$\text{KL}(s_{g,m}(T)\sum_{n}c_{n}e^{i2\pi{n}\Delta{F}T}\:\rVert\:s_{g,m}(T))\leq\delta$$$ .
Results
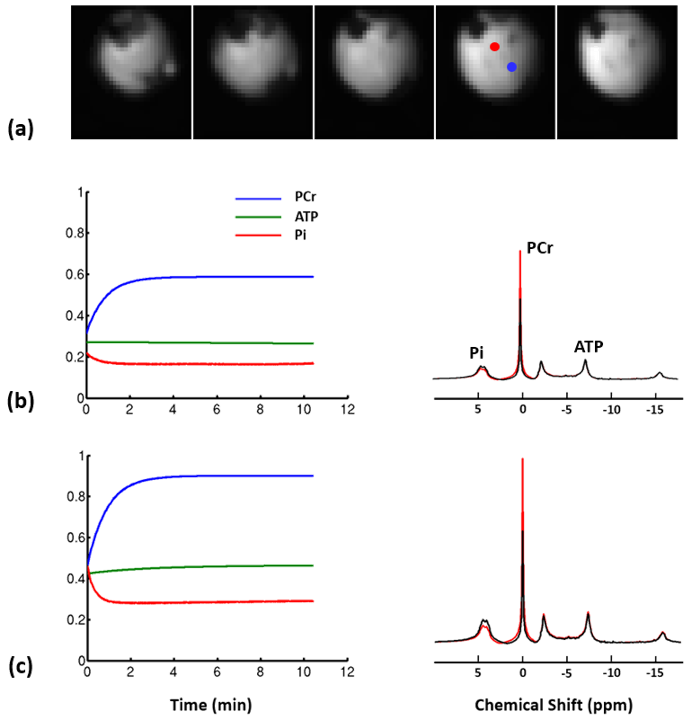
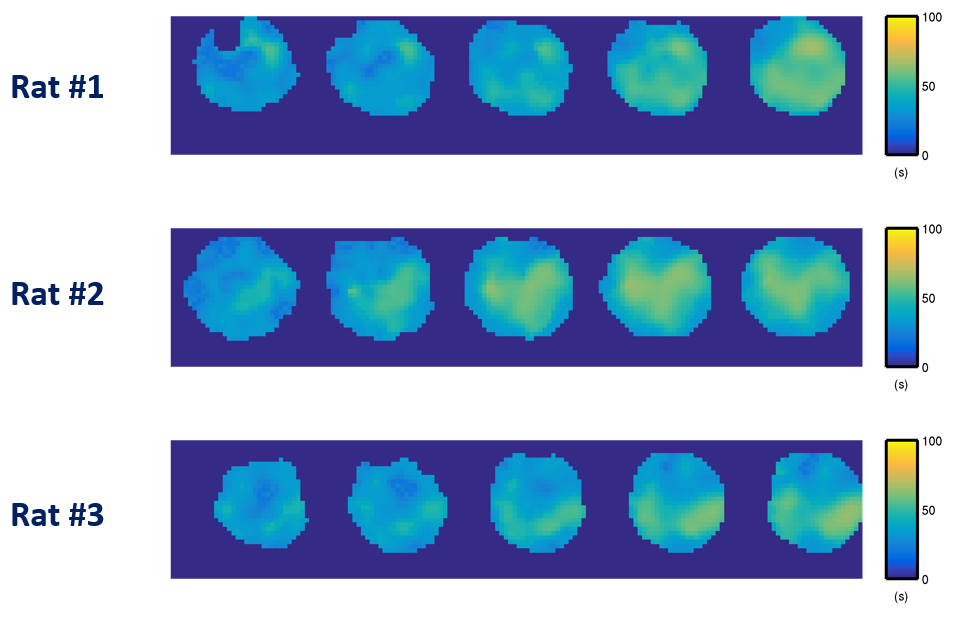
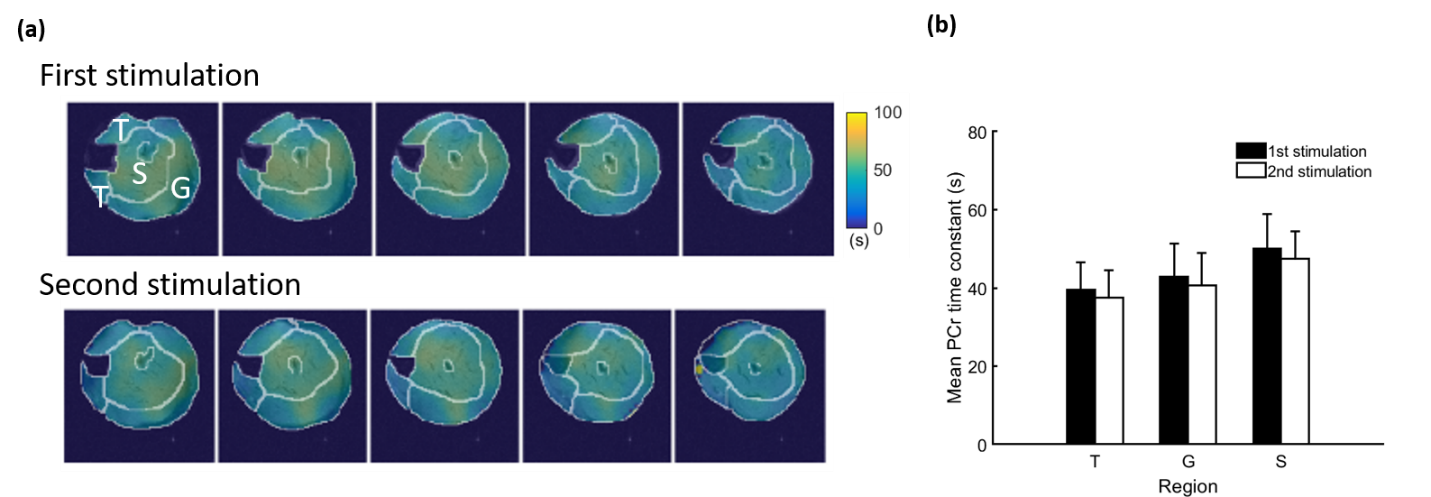
Representative 31P spectra and the time courses of metabolite changes after stimulation from our reconstructed data are shown in Fig. 2. Figure 3 shows a movie of concentration dynamics of PCr, ATP, and Pi during the recovery process. The time constant of PCr recovery, an index of mitochondrial oxidative capacity, was estimated by fitting the PCr concentration dynamics to an exponential function. Figure 4 shows the time constant maps from three different rats obtained by the proposed method. The time constant of PCr recovery in different muscle types was quantified by segmenting the muscle into the tibialis anterior and posterior, gastrocnemius, and soleus and plantaris (Fig. 5). Tibialis anterior and posterior muscle showed relatively faster PCr recovery with a shorter time-constant (37.9±1.42 sec) comparing to gastrocnemius (45.5±2.93 sec) and soleus and plantaris (47.7±3.57 sec). Interestingly, PCr recovery rate in the second stimulation was slightly faster than the first stimulation.Conclusions
In the current study, temporal priors were learned using deep generative models and incorporated into the MRSI reconstruction to enable high-resolution 5D dynamic 31P-MRSI for quantification of PCr recovery kinetics during stimulation-recovery experiments in popular rodent models. The regional differences observed in the current study may be attributed to the composition of different muscle fiber types with distinct metabolic profiles.9-10 Further, the slight acceleration of PCr recovery kinetics after the second stimulation might suggest an acute response to the first stimulation.Acknowledgements
This work reported in this paper was supported, in part, by the following research grants: NIH-R21-EB023413, NIH-R01-EB023704, and NIH-U01-EB026978.References
[1] Morikawa S, Kido C, Inubushi T. Observation of rat hind limb skeletal muscle during arterial occlusion and reperfusion by 31P MRS and 1H MRI. Magn. Reson. Imag. 1991;9(3):269-274.
[2] Morikawa S, Inubushi T, Kito K. Heterogeneous metabolic changes in the calf muscle of the rat during ischaemia-reperfusion: in vivo analysis by 31P nuclear magnetic resonance chemical shift imaging and 1H magnetic resonance imaging. Cardiovasc. Surg. 1993;1(4):337-342.
[3] Ma C, Clifford B, Liu Y, et al. High‐resolution dynamic 31P‐MRSI using a low‐rank tensor model. Magn. Reson. Med. 2017;78(2):419-428.
[4] Clifford B, Gu Y, Li Y, et al. Accelerating low-rank tensor model based dynamic 31P-MRSI of ischemia-reperfusion in rat at 9.4 T. In Proc. Int. Soc. Magn. Reason. Med. 2018, p. 911.
[5] Radford A, Metz L, Chintala S. Unsupervised representation learning with deep convolutional generative adversarial networks. arXiv Preprint 2015;arXiv:1511.06434.
[6] Liang ZP, Lauterbur PC. An efficient method for dynamic magnetic resonance imaging. IEEE Trans. on Med. Imaging 1994;13(4):677-686.
[7] Hess CP, Liang ZP, Lauterbur PC. Maximum cross‐entropy generalized series reconstruction. Int. J. Imaging Syst. Technol. 1999;10(3):258-265.
[8] Liu Y, Mei X, Li J, et al. Mitochondrial function assessed by 31P MRS and BOLD MRI in non‐obese type 2 diabetic rats. Physiol. Rep. 2016;4(15):e12890.
[9] Tasić D, Dimov D, Gligorijevic J, et al. Muscle fibre types and fibre morphometry in the tibialis posterior and anterior of the rat: a comparative study. FACTA Univ. Ser. Med. Biol. 2003;10(1):16–21.
[10] Morales-Lopez JL, Aguera E, Monterde JG, et al. Variations in fibre size in the Gastrocnemius muscle of rats undergoing training. Biol. Struct. Morphog. 1990;3(1):27–30.
Figures