0387
Deuterium (2H) magnetic resonance spectroscopy for monitoring chemotherapeutic response in vitro1Medical Biophysics, University of Toronto, Toronto, ON, Canada, 2Physical Sciences, Sunnybrook Research Institute, Toronto, ON, Canada
Synopsis
Deuterium (2H) magnetic resonance spectroscopy (MRS) is a novel metabolic imaging method that can measure aberrant glucose metabolism in cancer. In this abstract, we use 2H MRS to measure metabolic changes in acute myeloid leukemia (AML) cells after treatment with cisplatin. We show that this method is sensitive to differences in lactate levels, produced via glycolysis of deuterium-enriched glucose at 7T. These studies demonstrate the potential of 2H MRS to monitor chemotherapeutic response.
Introduction
Aberrant metabolism is a principle hallmark of many cancer types, characterized by an increased uptake in glucose and the formation of lactate in the presence of oxygen1. Detection of elevated lactate, which is now understood to play a key role in the survival, progression, and metastatic potential of cancer cells2,3, would permit assessment of tumour response following therapy.Deuterium (2H) magnetic resonance spectroscopy (MRS) is a novel, non-invasive metabolic imaging method which tracks the dynamic conversion of orally administered 2H-labeled glucose into lactate and other downstream metabolites4,5. Recent studies have demonstrated the feasibility of 2H MRS in differentiating metabolism between normal and tumour brain tissue4, but the sensitivity of this method to metabolic changes before and after chemotherapy has not yet been investigated. In this abstract, we study the feasibility of using 2H MRS to detect metabolic changes occurring in acute myeloid leukemia cells after treatment with cisplatin.
Methods
Cell preparation: Acute myeloid leukemia (AML-5) cells were grown in suspension in 8 flasks, each containing 150 mL α medium with 5% fetal bovine serum, and 1% penicillin and streptomycin. Flasks were maintained at 37°C and 5% CO2 until they reached confluence (~106 cells/mL). To induce apoptosis, cells in each of four flasks were treated with 10 μg mL-1 cisplatin 48 hours prior to imaging, while four flasks were left untreated as controls. Cisplatin is a cancer chemotherapy drug that impairs DNA replication and repair, and its apoptotic effects on AML-5 cells are established in literature6.Samples were prepared by combining the four flask volumes (~6 x 10⁸ cells total), which were centrifuged and resuspended in phosphate-buffered saline (PBS) with a total volume of 600 μL.10 minutes prior to the 2H scan, 100 uL of 140 mM [6,6’-2H2]glucose solution was added to each tube for a final 2H-labeled glucose concentration of 20 mM (and final volume=700 uL). The experiment was repeated with 12 flasks, divided equally into an untreated group, and groups treated 24 and 48 hours prior to scanning.
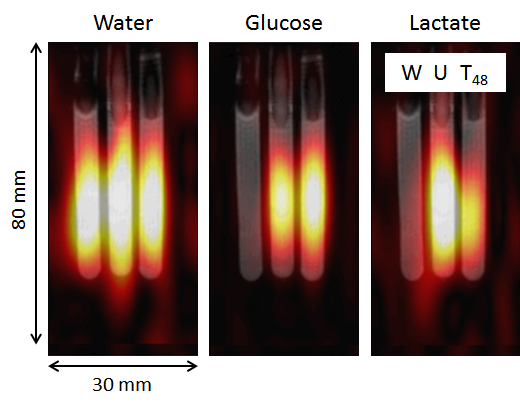
MR Acquisition: MR experiments were performed at 7T (Bruker Biospec). A home-built 2H transmit/receive surface coil (46.1 MHz, diameter 20 mm) with proton blocking was used for acquiring the 2H signal. Three tubes (length 50 mm, diameter 6 mm) were placed side-by-side in the center of the surface coil and scanned in each experiment. 2D projection dynamic 2H MRS images were acquired starting at 10 minutes after glucose addition with an in-plane resolution of 10x3 mm2 and temporal resolution of 2 min (FOV=8x3 cm2, spectral width 3 kHz, 768 spectral points, flip angle=90°, TR=300ms, 400 averages, scan duration=120min). 2H MRSI maps were overlaid on anatomical proton T1w images (TR=51 ms, TE=2 ms) acquired with a volume coil.
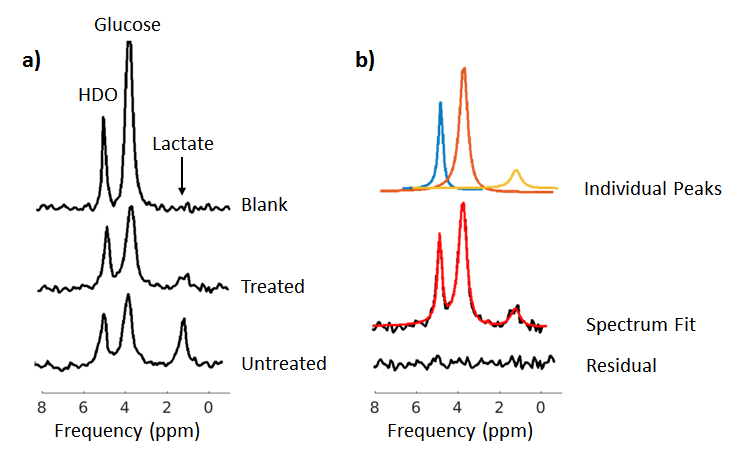
Analysis: The representative spectrum for each sample was chosen from the voxel in the most sensitive region of the surface coil with the highest signal. Spectra were averaged from 20 min of data acquisition. Time domain fitting was performed using AMARES implemented in the OXSA Matlab toolbox7. The fitted peaks were deuterium-labeled glucose (3.7 ppm), glutamate and glutamine (Glx, 2.4 ppm), lactate (1.4 ppm), and water (4.7 ppm). Concentrations of labeled glucose and lactate were quantified by normalizing the integrals of the fitted peaks to that of the baseline water signal, which has a natural 2H abundance of 12.8 mM. This value is based on the 55.5 M concentration of water and 0.0115% natural abundance of deuterium. As described by de Graaf et al.4, the final concentrations were normalized to the average number of deuterons per molecule.
Results and Discussion
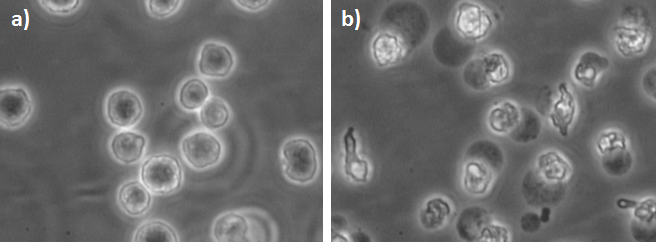
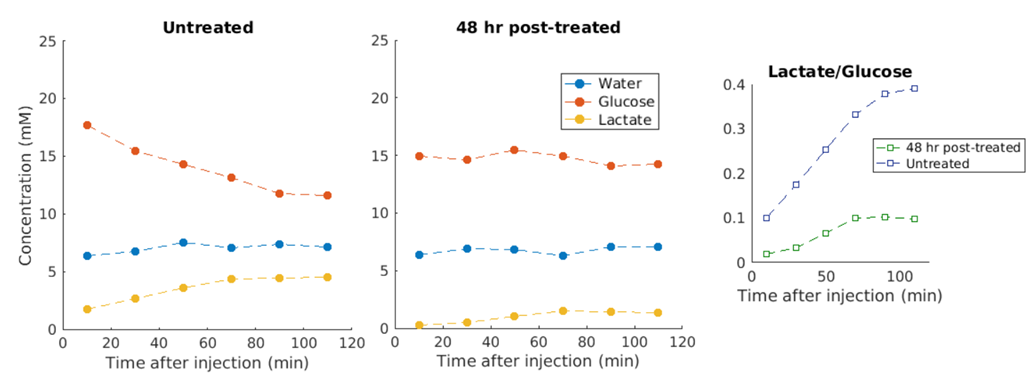
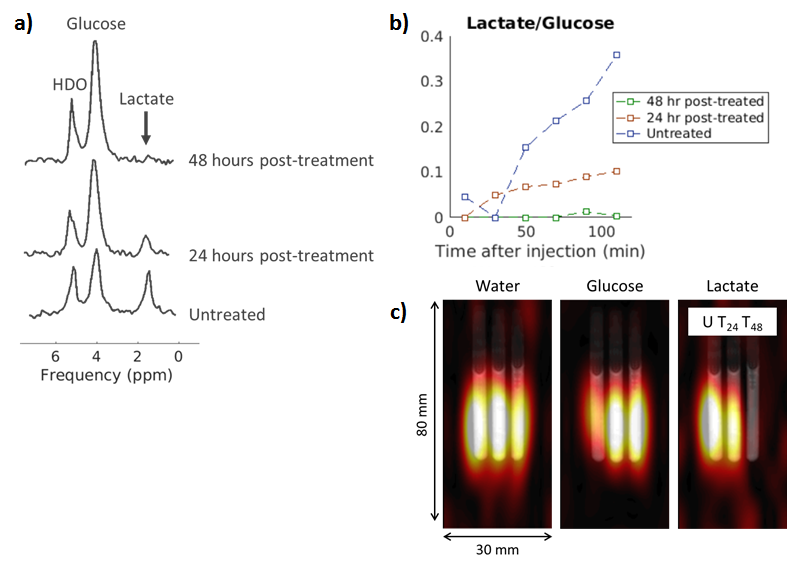
Figure 1 demonstrates the apoptotic changes in the AML-5 cells following cisplatin treatment. The 2H spectra acquired two hours after the injection of [6,6’-2H2]glucose are presented in Figure 2a. Signals from the injected glucose and downstream lactate product were observed, but no Glx was detected in either the treated or untreated group. This result is consistent with observations of increased lactate and reduced Glx formation in tumours compared to healthy tissue4. Less lactate was detected in the treated cells relative to the untreated cells, although both samples demonstrated glucose utilization.Figure 3 shows the concentrations of the deuterium-labelled metabolites over time. At two hours following addition of 2H-glucose, the amount of 2H-lactate detected in the 48 hour cisplatin-treated sample was 3.3 fold less than that of the untreated sample. The 2H-lactate to 2H-glucose ratio was 4.0 fold less respectively, following lactate/glucose trends seen in a previous study8. This suggests reduced glucose metabolism in the treated sample, which may be because majority of these cells have undergone apoptosis. Reduced lactate production was also observed in the repeated experiment (summarized in Figure 5). Relative to the untreated cells, the 2H-lactate to 2H-glucose ratios were 3.5 and 102.2 fold less for the 24 and 48 hour treated samples, respectively. Future in vitro assays are required to correlate 2H-metabolite concentrations with the degree of apoptosis in the treated and untreated groups.
Conclusions
At 7T, it was shown that 2H MRS is sensitive to metabolic changes induced by cisplatin in AML cells, specifically, the decrease in lactate production. We anticipate that this method will be useful in monitoring tumour response after chemotherapy.Acknowledgements
We gratefully acknowledge funding from NSERC (RGPIN-2017-06596).References
1. Warburg BYO and Wind F. The metabolism of tumors in the body. J Gen Physiol. 1926;8(6):519–530.
2. Pavlova NN and Thompson CB. The Emerging Hallmarks of Cancer Metabolism. Cell Metab. 2016;23(1):27-47.
3. Hirschhaeuser F, Sattler UGA, and Mueller-Klieser W. Lactate: A metabolic key player in cancer. Cancer Res. 2011;71(22):6921-6925.
4. de Feyter HM, Behar KL, Corbin ZA, et al. Deuterium metabolic imaging (DMI) for MRI-based 3D mapping of metabolism in vivo. Sci Adv. 2018;4(8):eaat7314.
5. Lu M, Zhu XH, Zhang Y, et al. Quantitative assessment of brain glucose metabolic rates using in vivo deuterium magnetic resonance spectroscopy. J Cerebr Blood F Met. 2017;37(11):3518-3530.
6. Bailey C, Giles A, Czarnota GJ, et al. Detection of apoptotic cell death in vitro in the presence of Gd-DTPA-BMA. Magn Reson Med. 2009;62(1):46-55.
7. Purvis LAB, Clarke WT, Biasiolli L, et al. OXSA: An open-source magnetic resonance spectroscopy analysis toolbox in MATLAB. PLoS ONE. 2017;12(9).
8. Kreis F, Wright A, Fala M et al. Monitoring treatment response in a murine lymphoma with Deuterium Metabolic Imaging and Spectroscopy. In Proc. of the ISMRM 27th Scientific Meeting, Program Number 1125. Montreal, Canada, 2019.
Figures