0386
Phosphate Metabolite T1 Relaxation Times, ATP Hydrolysis Flux and Creatine Kinase Reaction Kinetics in the Human Skeletal Muscle.1Electrical and Computer Engineering, Auburn University, Auburn, AL, United States, 2Biomedical Engineering, The University of Alabama at Birmingham, Birmingham, AL, United States
Synopsis
Long TR and low concentration makes the quantification of inorganic phosphate (Pi) difficult in 31P magnetization saturation transfer experiments. An indirect method to measure Adenosine Triphosphate (ATP) turnover was demonstrated in animal studies, which does not require quantification of Pi. We demonstrate the application and validation of this technique in human studies. We measured the fluxes of ATP production and hydrolysis reactions using the indirect approach and validated the results against direct measurements. We also report the intrinsic T1 of Phosphocreatine, ATP and Pi in skeletal muscle at 7T. This will facilitate future studies of impaired bioenergetics in vivo.
INTRODUCTION:
Various biochemical process generate the energy needed to support normal function and activity of tissues. Adenosine Triphosphate (ATP) metabolism is one of the most fundamental process for supporting various cellular activities in the living tissue. Impaired ATP production and utilization is potential biomarker of cellular function in variety of diseases1-5. Major high energy phosphorus metabolites detected by in vivo 31P-MRS include phosphocreatine (PCr), inorganic phosphate (Pi), and ATP with the γ-, α-, and β resonances. These metabolites compose a chemical exchange network $$$PCr\rightleftarrows ATP \rightleftarrows Pi$$$ catalyzed by the enzymes creatine kinase (CK) and ATP synthase (ATPase). 31P magnetization saturation transfer (MST) spectroscopy experiments have been extensively used to measure rate of CK forward flux ($$$ PCr \rightarrow ATP $$$) myocardium. However, measuring ATP hydrolysis ($$$ ATP \rightarrow ADP+Pi $$$) is problematic in heart because the level of Pi is too low and the peak attributed to Pi overlaps with the much larger peak for 2,3-disphosphoglycerate6,7. Recent reports in open chest animal heart have demonstrated that ATP turnover can indirectly by measuring total ATP utilization and subtracting out the measurable component that can be attributed to ATP flux via CK8,9. In this work, we demonstrate the feasibility of the technique in human skeletal muscle at 7T. Major aim of this work was to determine the validity of the technique by comparing indirect approach with direct measurement of ATP utilization in skeletal muscle where Pi peak is quantifiable.METHODS:
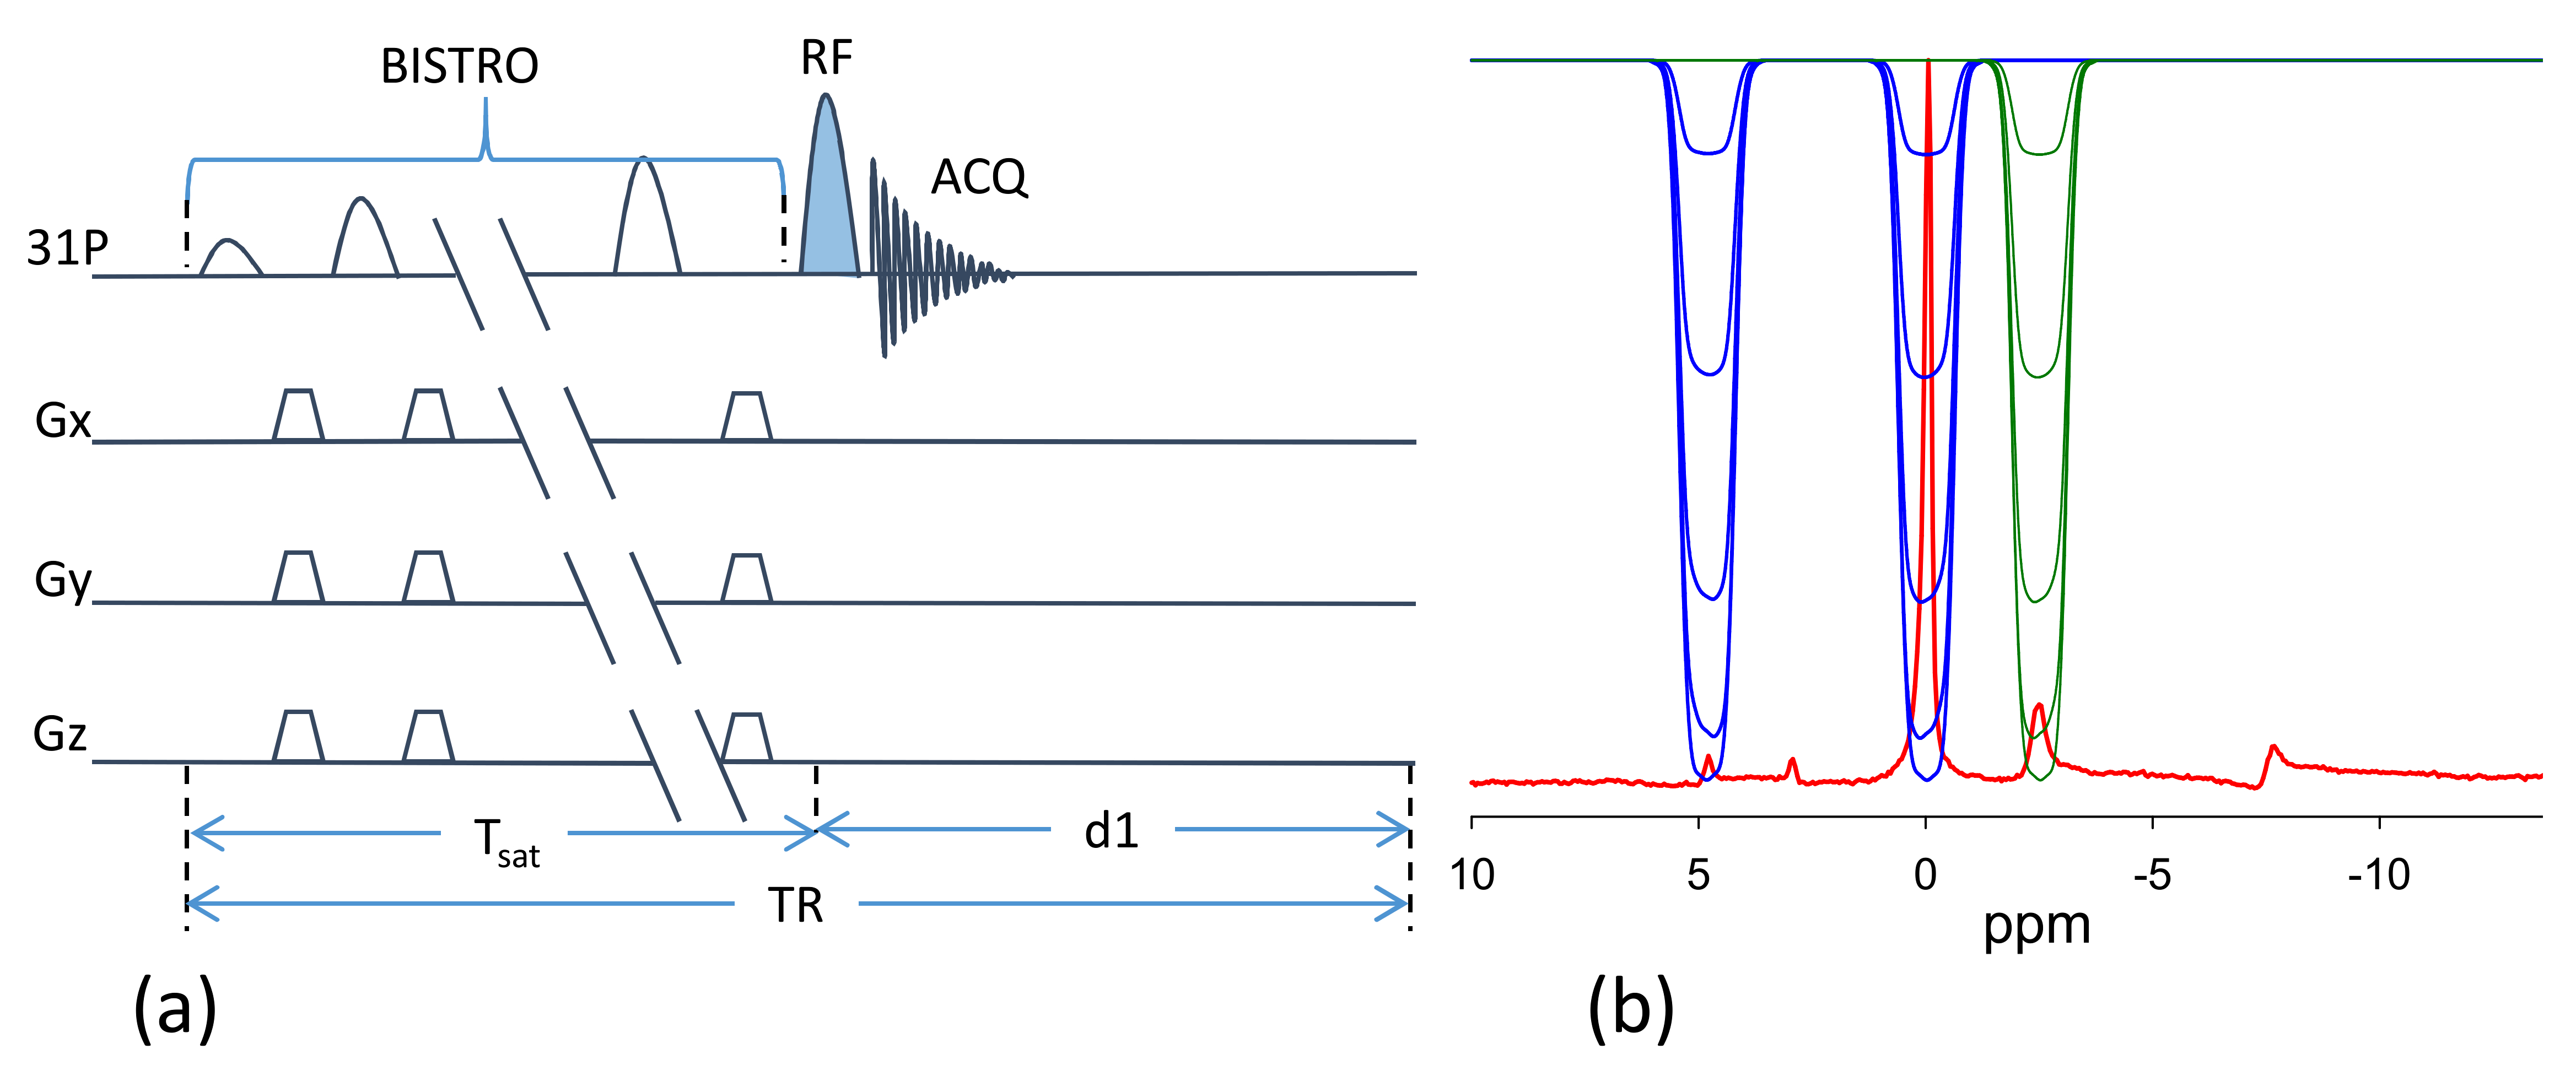
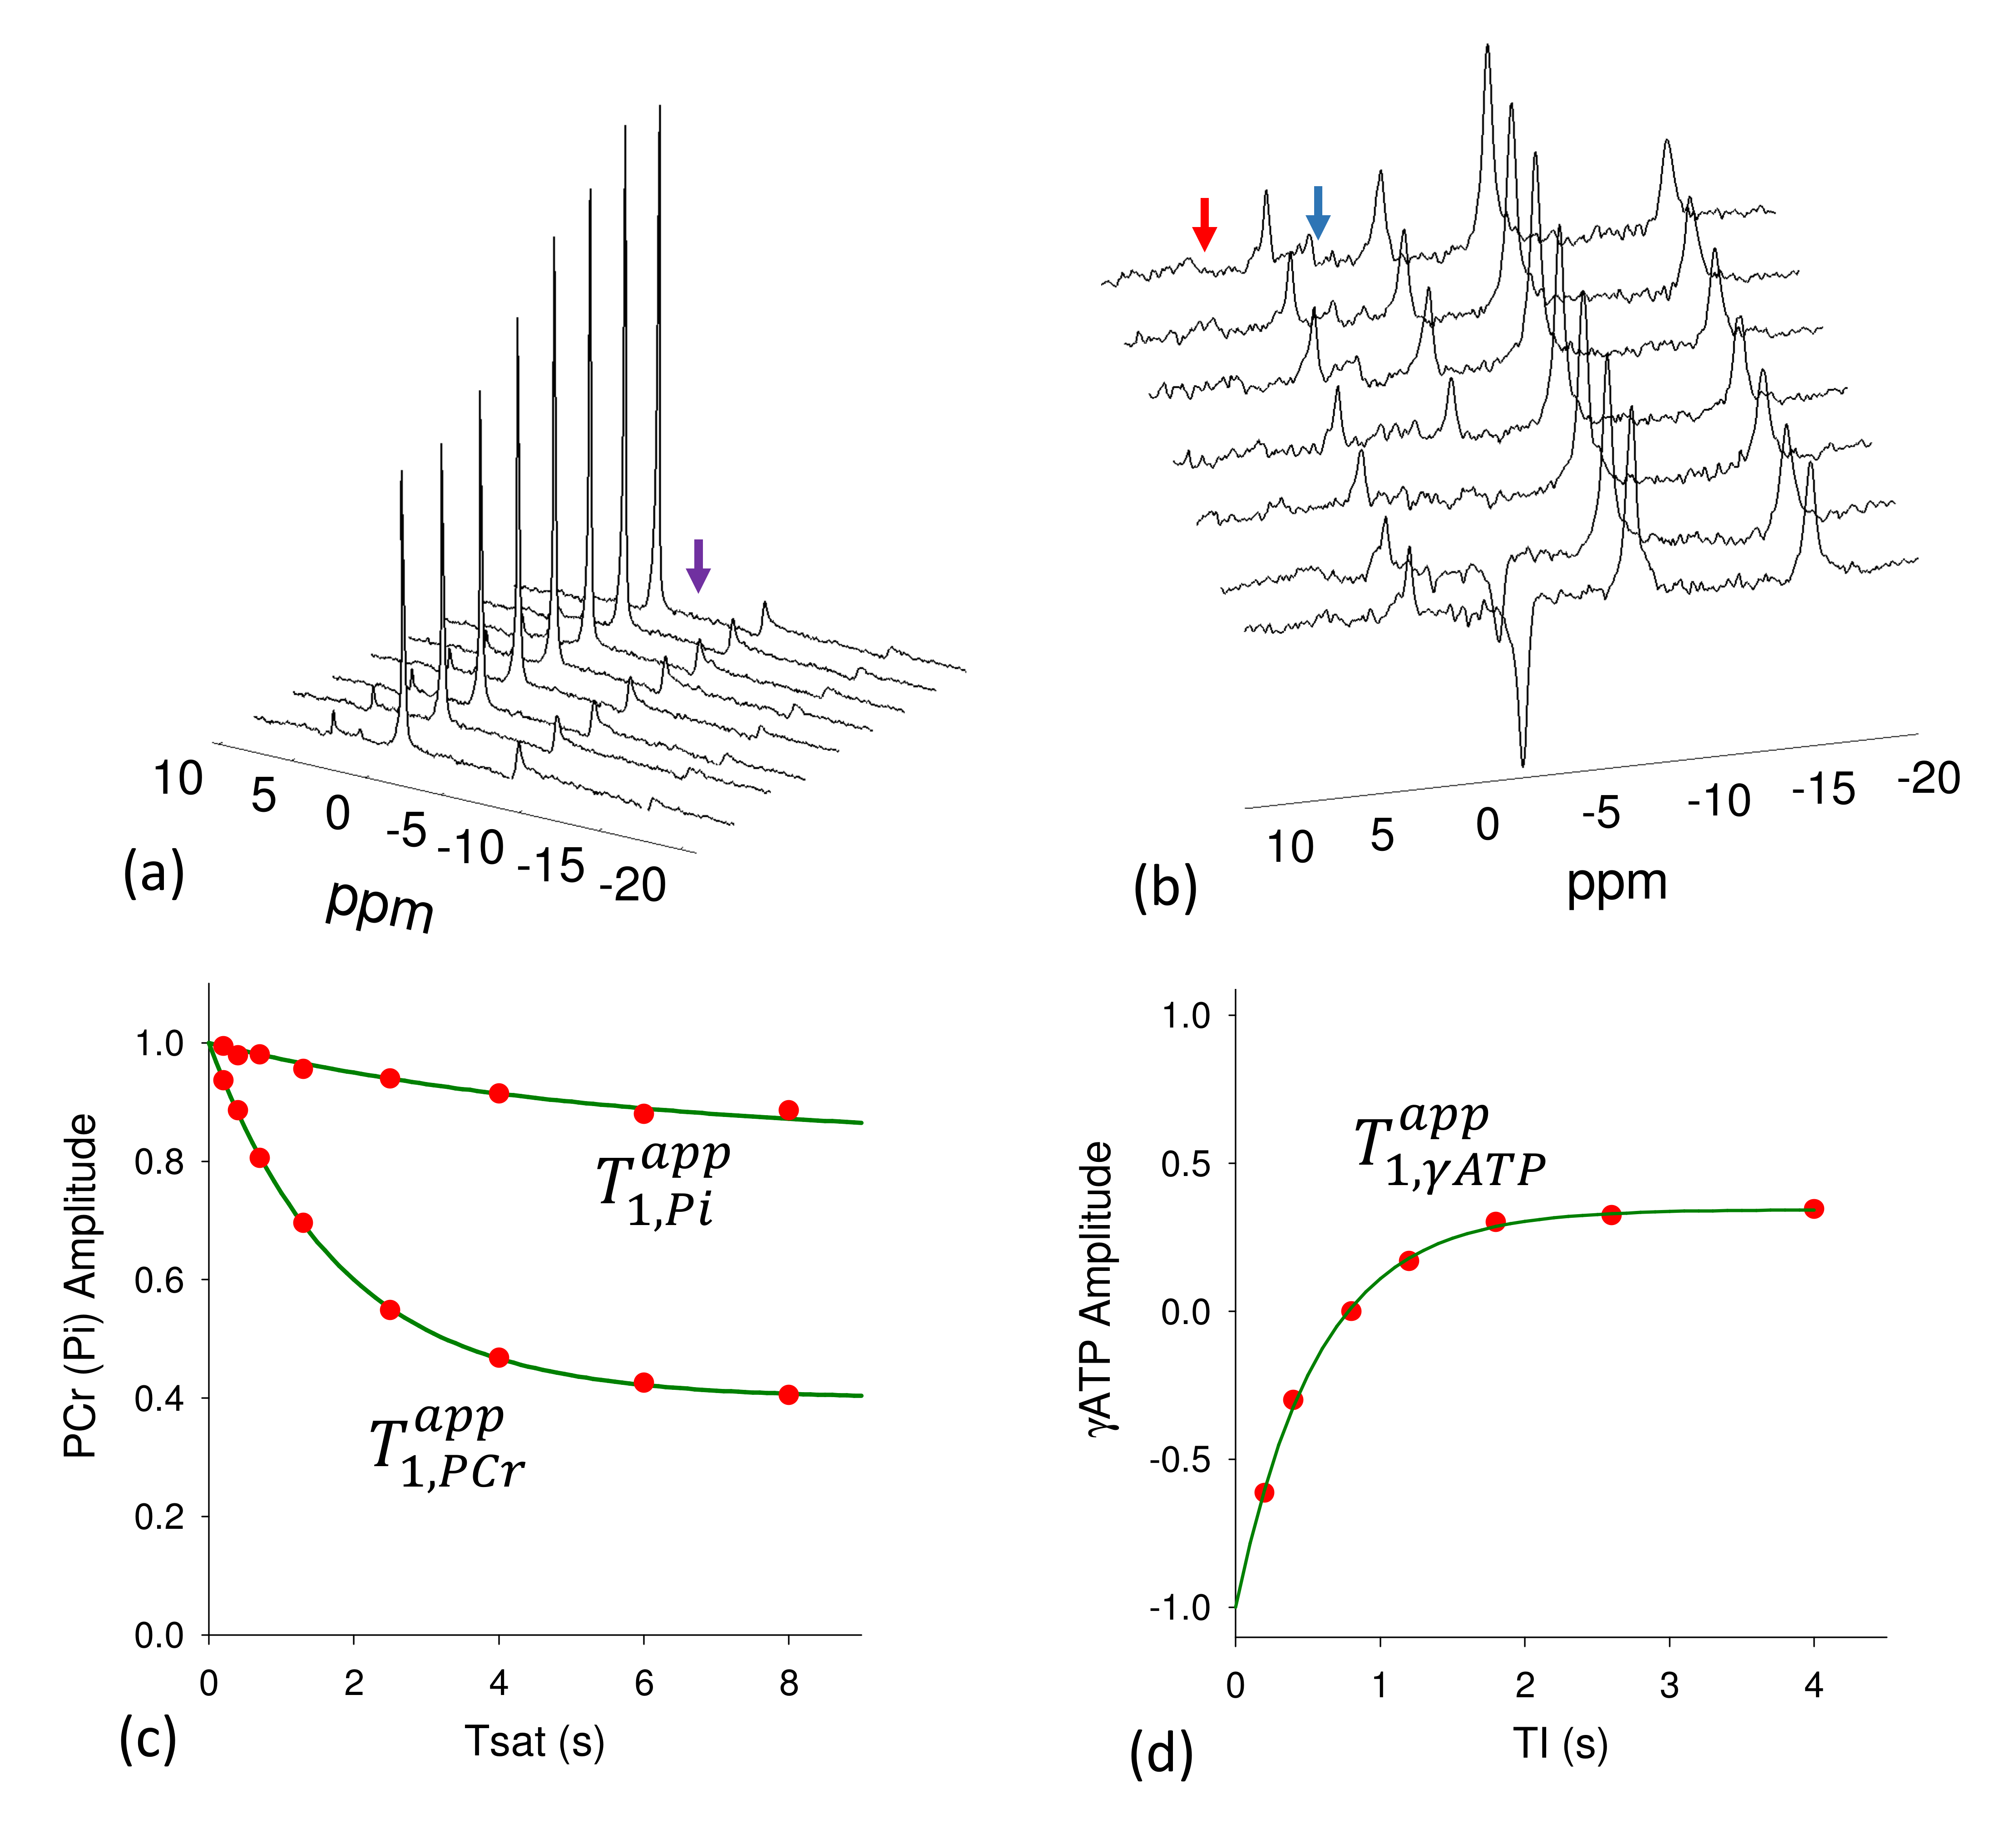
Experiments were performed on a Siemens 7T Magnetom (Erlangen, Germany) using a dual tuned 31P/1H loop coil in healthy subjects (n=4). Subjects were placed supine in the scanner with the RF coil under the calf. 31P MR spectra were acquired with 2.56 ms adiabatic half passage RF pulse for excitation and selective saturation of γ-ATP or of both PCr and Pi was achieved by using the B1-insentitive train to obliterate signal (BISTRO) technique [10] (Figure 1). The complete protocol consisted of five experiments, (1) Fully relaxed control spectrum to determine Mo,PCr, Mo,Pi and Mo,γ-ATP (d1=12 s, averages=4). (2) Spectrum with γ-ATP saturated to determine Ms,PCr and Ms,Pi (d1=15 s, averages = 8). (3) Spectrum with both PCr and Pi saturated to determine Ms,γ-ATP (d1=6 s averages=8). (4) Inversion recovery experiment with both PCr and Pi saturated to measure the intrinsic T1 of γ-ATP (d1=4 s, TI=0.2, 0.4. 0.8, 1.2, 1.8, 2.6, 4 s, aveages=8) 11. (5) Progressive saturation transfer experiment with γ-ATP saturated to measure intrinsic T1 or PCr and Pi (d1 = 14s, Tsat=0.2, 0.4, 0.8, 1.4, 2.6, 5.0, 8.0s, averages=4). The spectral width was 6 kHz and 1024 data points were acquired. Spectra were processed offline using the jMRUI (Java-based magnetic resonance user interface) software to determine resonance areas for γ-ATP, PCr and Pi. The forward rate constants were determined by8,11 $$k_{PCr(Pi)\rightarrow ATP}=\left(\frac{M_{o,PCr(Pi)}-M_{s,PCr(Pi)}}{M_{o,PCr(Pi)}}\right)/T_{1,PCr(Pi)}^{app}\;\;\;\;\;\;\;\;\;\;\;\;\;\;\;(1) $$and the reverse rate constant $$k_{ATP,total}=\left(\frac{M_{o,\gamma ATP}-M_{s,\gamma ATP}}{M_{o,\gamma ATP}}\right)/T_{1\gamma ATP}^{app}\;\;\;\;\;\;\;\;\;\;\;\;\;\;\;\;\;\;\;\;\;\;\;\;\;\;\;\;\;\;(2)$$ where $$$ k_{ATP,total}=k_{ATP \rightarrow Pcr} + k_{ATP \rightarrow Pi} $$$. ATP hydrolysis rate constant $$$ k_{ATP \rightarrow Pi} $$$ is determined by subtracting $$$ k_{ATP \rightarrow PCr} $$$ from $$$ k_{ATP,total} $$$ where $$ k_{ATP \rightarrow PCr} =\frac{M_{o,PCr}}{M_{o,\gamma ATP}}k_{PCr \rightarrow \gamma ATP} \;\;\;\;\;\;\;\;\;\;\;\;\;\;\;\;\;\;\;\;\;\;\;\;\;\;\;\;\;\;\;\;\;\;\;\;\;\;\;\;\;\;\;\;\;\;(3) $$ assuming CK reaction is in equilibrium. Energy fluxes were calculated by multiplying the rate constant with the previously reported metabolite concentrations11.RESULTS:
Typical MST spectra are displayed in Figure 2 and 3. Results from experiments 4 and 5 are used to calculate the intrinsic T1s for PCr (6.4±0.3 s), γ-ATP (1.9±0.4 s) and Pi (7.25±1.9 s). The declines in PCr and Pi that occurred in response γ-ATP saturation (Experiment 1 and 2) were used to calculate the forward rate constants for the PCr→ATP (kPCr→ATP=0.25±0.03 s-1) and Pi→ATP (kPi→ATP=0.03±0.01 s-1) using Eq 1. The decrease in γ-ATP that occurred due to double saturation of PCr and Pi (Experiments 1 and 3) was used to calculate the reverse rate constant for the combined ATP→PCr and ATP→Pi reactions (kATP,tot=1.32±0.10 s-1) using Eq 2 and 3. The total ATP production flux (10.18±0.9 mM.s-1) calculated by conventional MST approach with saturation on γ-ATP ( sum of the fluxes of PCr→ATP and Pi→ATP reactions) matched the total ATP utilization flux (10.23±0.67 mM.s-1) i.e. combined ATP→PCr and ATP→Pi reactions measured by indirect approach thus demonstrating the validity of the technique.DISCUSSION:
We have demonstrated and validated a method to measure ATP utilization flux without need to quantify Pi. Specifically, we measured the forward chemical exchange flux of the CK and ATPase reaction and compared it with the reverse chemical exchange flux of ATP hydrolysis and CK at 7T in human skeletal muscle. The two fluxes are in agreement thus validating the double saturation approach. Similar fluxes have been reported using inversion transfer MST approach13. The indirect 31P MRS-MST method has the potential to significantly reduce the scan time by eliminating the need to quantify Pi levels.CONCLUSION:
The indirect methods to quantify ATP hydrolysis flux has direct application in cardiac studies where Pi resonance is not measureable. This may provide important insights into biological mechanisms of impaired bioenergetics associated with heart diseases. The method can be applied to organs where Pi is visible with improved SNR since Pi concentration is low and has longer TR.Acknowledgements
We would like to thank Dr. Ronald Beyers and Sultan Zaman Mahmud for helpful discussion with experimental setup and analysis.References
1. Schrauwen‐Hinderling VB, Roden M, Kooi ME, Hesselink MK, Schrauwen P. Muscular mitochondrial dysfunction and type 2 diabetes mellitus. Curr Opin Clin Nutr Metab Care. 2007;10: 698–703.
2. Petersen KF, Befroy D, Dufour S, et al. Mitochondrial dysfunction in the elderly: possible role in insulin resistance. Science. 2003;300:1140–1142.
3. Pecoraro M, Pinto A, Popolo A. Mitochondria and Cardiovascular Disease: A Brief Account. Crit Rev Eukaryot Gene Expr. 2019;29(4):295-304.
4. Role of mitochondrial dysfunction in Alzheimer's disease. Castellani R, Hirai K, Aliev G, Drew KL, Nunomura A, Takeda A, Cash AD, Obrenovich ME, Perry G, Smith MA. J Neurosci Res. 2002 Nov 1;70(3):357-60
5. Schapira AH. Mitochondrial dysfunction in neurodegenerative diseases. Neurochem Res. 2008 Dec;33(12):2502-9.
6. Smith CS, Bottomley PA, Schulman SP, Gerstenblith G, Weiss RG. Altered creatine kinase adenosine triphosphate kinetics in failing hypertrophied human myocardium. Circulation. 2006;114:1151–1158.
7. Bashir A, Gropler RG. Reproducibility of Creatine Kinase Reaction Kinetics in Human Heart: A 31P Time Dependent Saturation Transfer Spectroscopy. NMR Biomed. 2014 Jun; 27(6): 663–671.
8. Xiong Q, Du F, Zhu X, Zhang P, Suntharalingam P, Ippolito J, Kamdar FD, Chen W, Zhang J. ATP production rate via creatine kinase or ATP synthase in vivo: a novel superfast magnetization saturation transfer method. Circ Res. 2011 Mar 18;108(6):653-63.
9. Xiong Q, Ye L, Zhang P, Lepley M, Tian J, Li J, Zhang L, Swingen C, Vaughan JT, Kaufman DS, Zhang J. Functional consequences of human induced pluripotent stem cell therapy: myocardial ATP turnover rate in the in vivo swine heart with postinfarction remodeling. Circulation. 2013 Mar 5;127(9):997-1008.
10. de Graaf RA, Luo Y, Garwood M, Nicolay K. B1-insensitive, singleshot localization and water suppression. J Magn Reson B 1996;113(1): 35–45.
11. Friedrich J, Nascimben L, Liao R, Ingwall JS. Phosphocreatine T1 measurements with and without exchange in the heart. Magn Reson Med. 1993 Jul;30(1):45-50.
12. Kemp GJ, Meyerspeer M, Moser E. Absolute quantification of phosphorus metabolite concentrations in human muscle in vivo by 31P MRS: a quantitative review. NMR Biomed. 2007 Oct;20(6):555-65.
13. Ren J, Sherry AD, Malloy CR. Modular 31 P wideband inversion transfer for integrative analysis of adenosine triphosphate metabolism, T1 relaxation and molecular dynamics in skeletal muscle at 7T. Magn Reson Med. 2019 Jun;81(6):3440-3452.
Figures