0385
MRSI of the prostate revisited: The potential role of GOIA-sLASER in multiparametric MRI of central gland prostate cancer1Health Science, The University of Newcastle, Newcastle, Australia, 2Radiation Oncology, Calvary Mater Newcastle, Newcastle, Australia, 3Physics and mathematics, The University of Newcastle, Newcastle, Australia, 4Radiology, Calvary Mater Newcastle, Newcastle, Australia, 5Imaging Centre, Hunter Medical Research Institute (HMRI), Newcastle, Australia, 6Radiology and Nuclear Medicine, Radboud University Medical Center, Nijmegen, Nijmegen, Netherlands
Synopsis
Due to histological heterogeneity of the central gland, accurate detection of central gland prostate cancer remains a challenge. A reliable and non-invasive imaging technique could increase the sensitivity and specificity for identification of central gland lesions missed by PI-RADS V2 or biopsies. This study evaluates the diagnostic performance of individual and combined parameters of an mp-MRI exam, employed for PI-RADS evaluations (T2WI, DWI, DCE) and advanced GOIA-sLASER MRSI using an external phased-array coil for central gland prostate cancer detection, localization and grading. The results demonstrate that MRSI using GOIA-sLASER considerably improves central gland prostate cancer detection and localization.
Introduction
Clinical applications of mp-MRI including T2-weighted imaging (T2WI), diffusion weighted imaging (DWI) and dynamic contrast enhanced (DCE) imaging as defined by the Prostate Imaging Reporting and Data System (PI-RADS V2.1) has shown poor to moderate diagnostic performance for the central gland prostate cancer.1 The diagnostic potential of proton MR spectroscopic imaging (MRSI) in combination with anatomical and functional MRI for the improvement of prostate cancer detection, localization and characterization has been demonstrated.2-4 MRSI provides important information on metabolites such as, citrate (Cit), choline (Cho), creatine (Cr) and polyamines, mostly spermine (Spm).5 However, MRSI has been excluded from routine clinical mp-MRI mainly due to long acquisition times and lack of robustness.1,6,7 Recently, a gradient-modulated offset-independent adiabatic (GOIA) semi-localized adiabatic selective refocusing (sLASER) sequence was introduced wich shows much better robustness then previously used sequences and does not need an endorectal coil, 8,9 which may lead to a renewed prominent role for MRSI in prostate cancer management, especially in classification of central gland prostate cancer tissue where diagnosis remains challenging.2 In this study we evaluated the diagnostic performance of different combinations of conventional mp-MRI protocols (T2WI, DWI and quantitative DCE) with and without MRSI GOIA-sLASER for central gland prostate cancer detection and localization.Methods
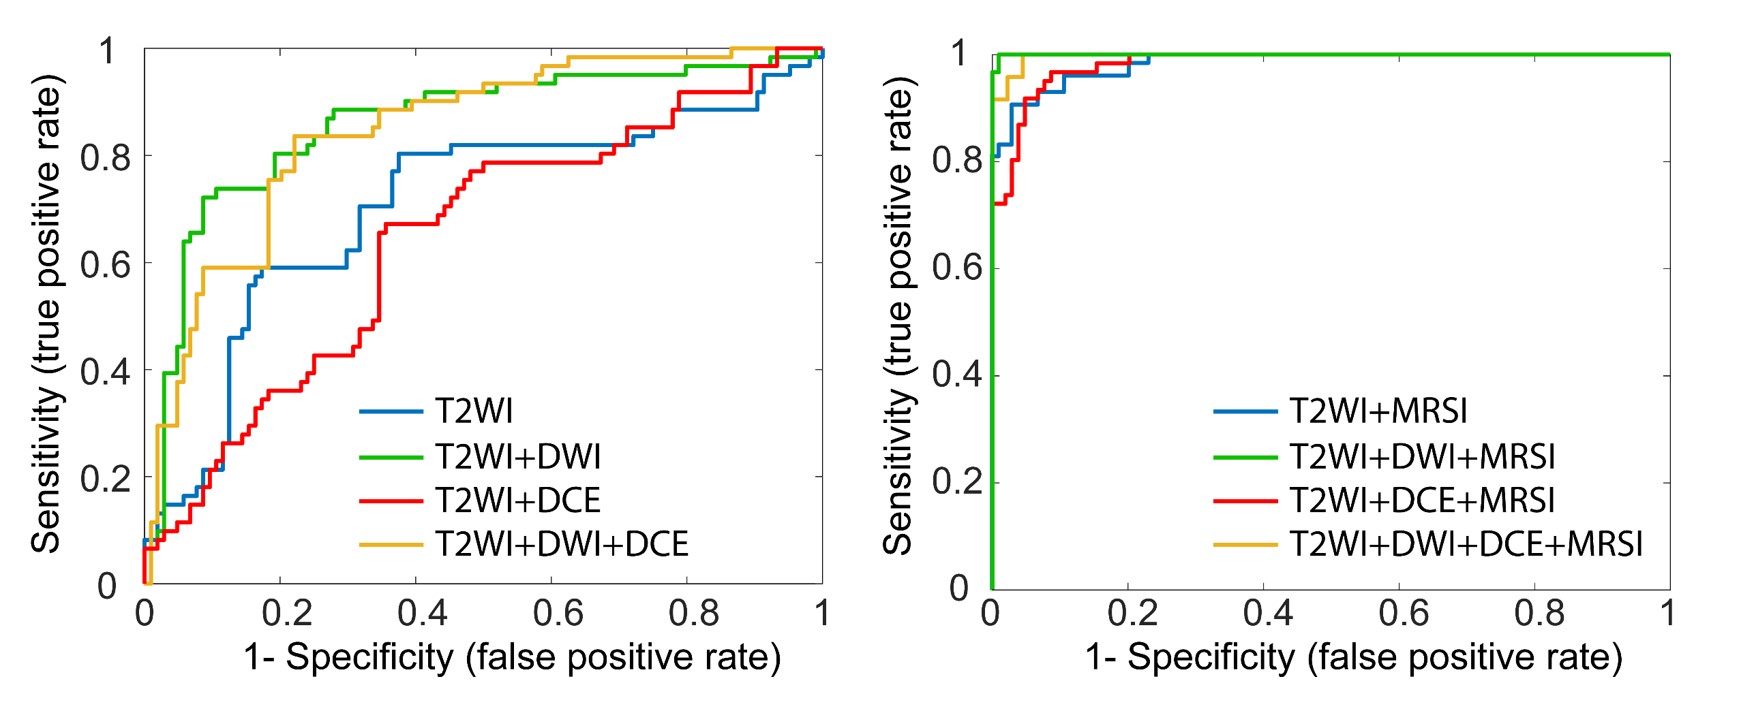
Mp-MRI was performed on 36 patients with biopsy-proven central gland prostate cancer (age range: 53-72years) using a 3T MRI scanner (Skyra, Siemens) with external phase-array coil. To evaluate the capability of mp-MRI parameters for discriminating between different cancer grades, the mean values of apparent diffusion coefficient (ADC) map of DWI, Ktrans, Kep and the area under gadolinium curve (iAUGC) of DCE and (Cho+Spm+Cr)/Cit and Cho/Cit and Cho/Cr metabolite ratios of MRSI were calculated for each voxel within the ROIs. The cancer tissues were further sub-divided into low-risk (GS=3+3; 97ROIs), intermediate-risk (GS=3+4; 31ROIs) and high-risk (GS≥4+3; 69ROIs). Support vector machine (SVM) classifications with a radial basis function (RBF) kernel (RBF SVM) method and area under receiver operator characteristic (ROC) using an in-house Matlab routine (Matlab 2017b; The MathWorks Inc, Natick, MA) were used to describe and compare the diagnostic performance of different combinations of T2WI, T2WI+DWI, T2WI+DCE, T2WI+DWI+DCE, T2WI+MRSI, T2WI+DWI+MRSI, T2WI+DCE, and T2WI+DWI+DCE+MRSI. Mp-MRI parameters with a statistically significant difference between two groups were used to develop each model (p<0.05). The sensitivity, specificity and overall accuracy of each classifier were measured. Furthermore, Spearman correlation coefficient (r) was used to measure the correlation between risk groups (low-risk, intermediate-risk and high risk) and mp-MRI parameters (IBM SPSS statistics version 0.24.0).Results and Discussion
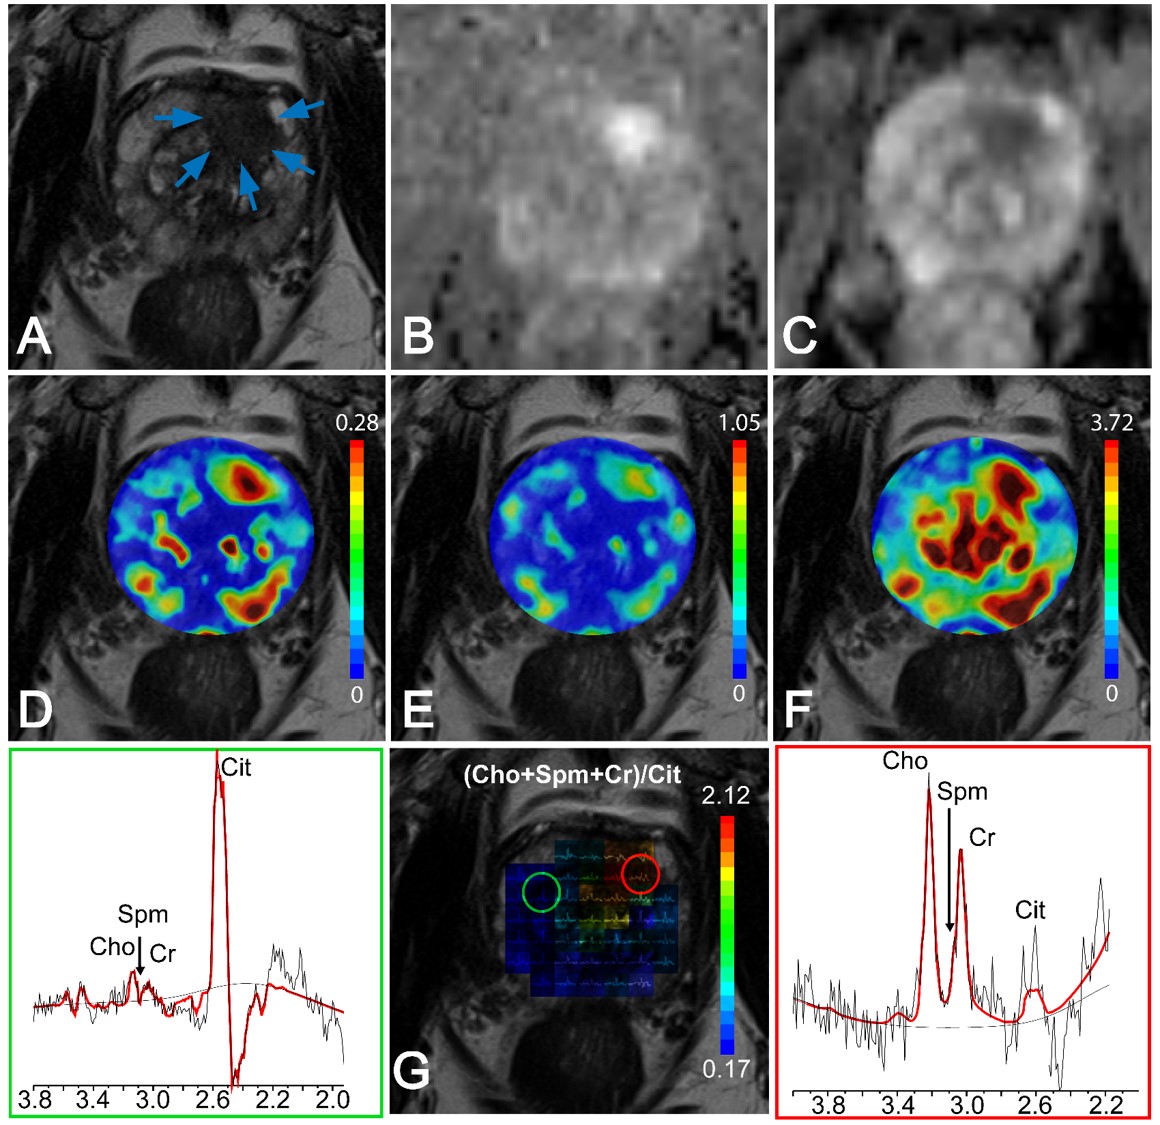
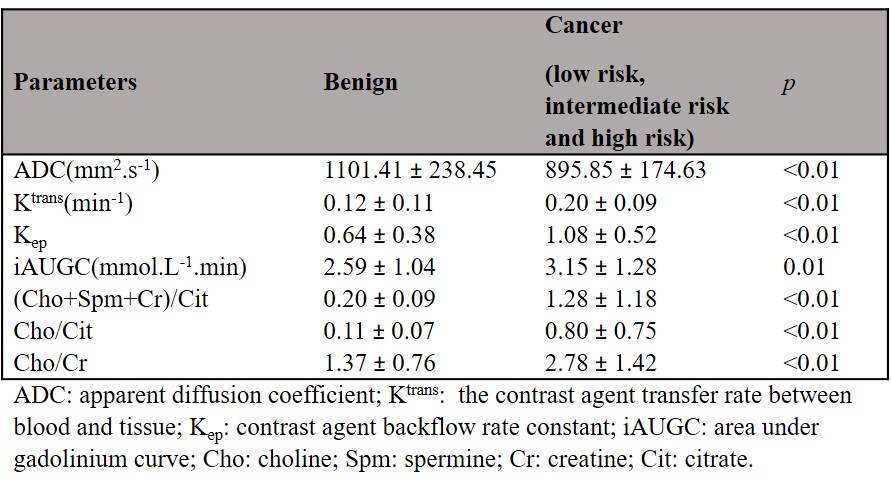
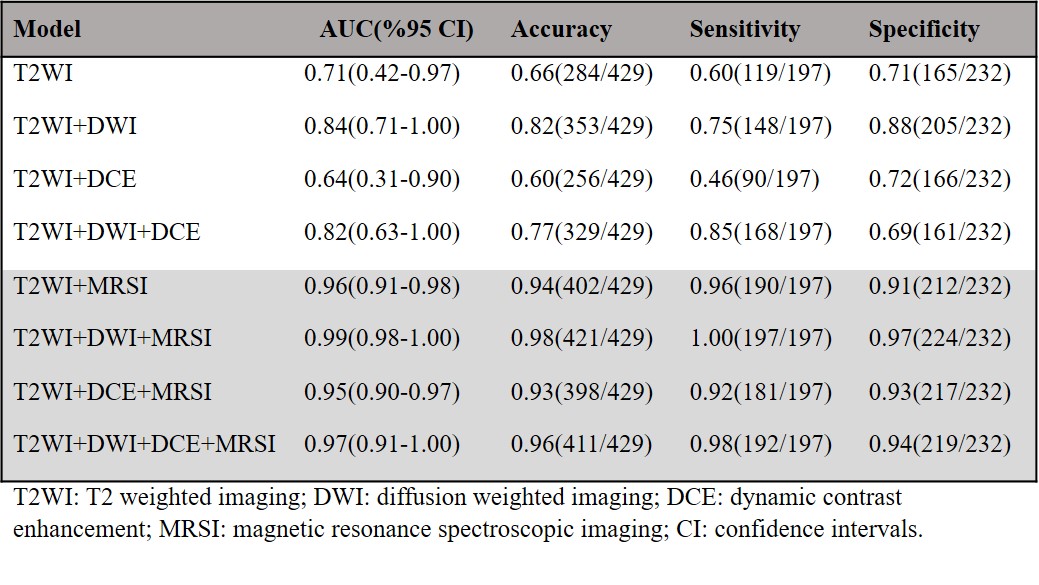
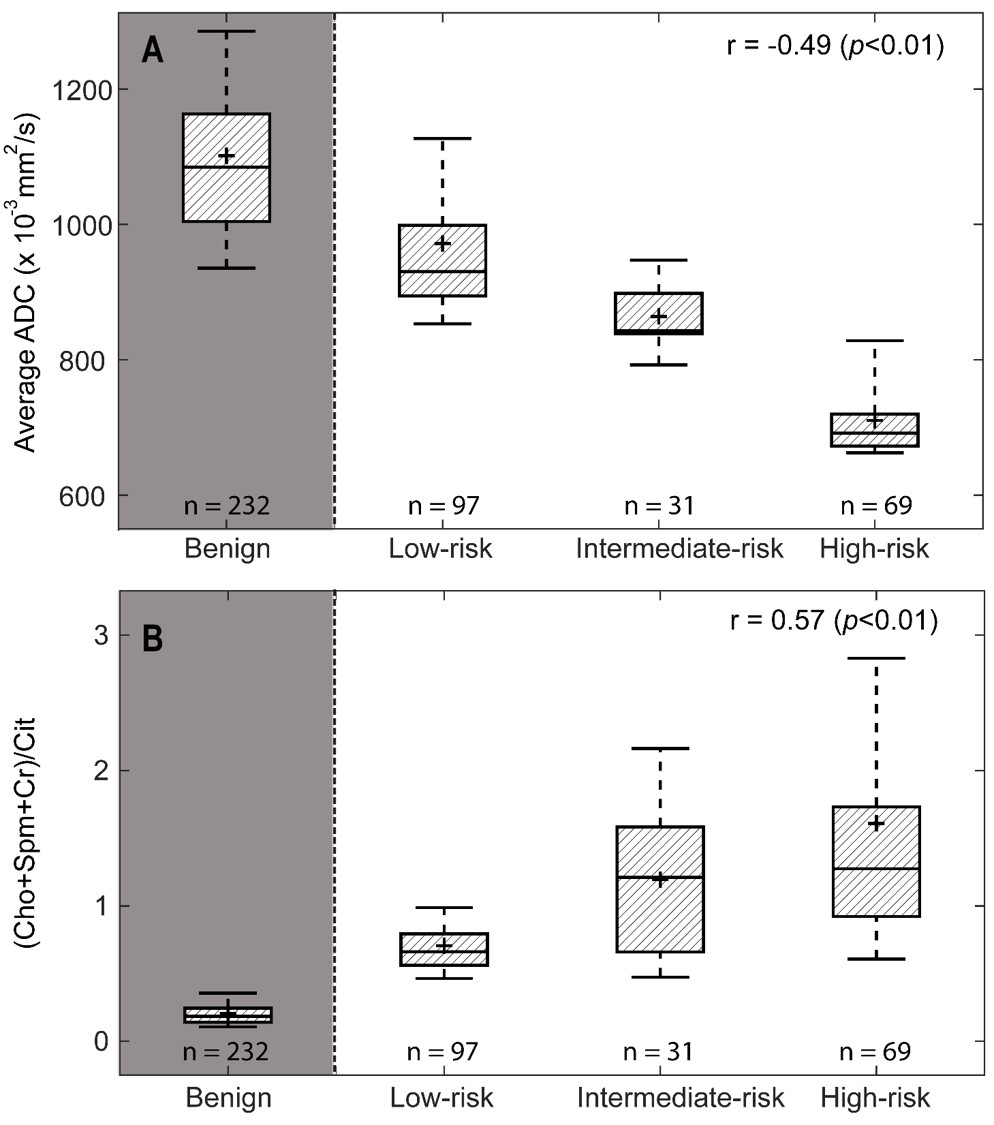
In patients with central gland prostate cancers, tumor tissue commonly presented as low signal intensity on T2WI and ADC maps and high signal intensity on pharmacokinetic parameter maps of DCE exams (Figure 1A-F). MRSI spectral maps of the entire prostate showed low signal intensity levels for Cit and high intensity levels for Cho in tumor areas, whereas benign central gland tissue showed relatively high levels of Cit and low levels of Cho (Figure 1G). The mean (±SD) values of mp-MRI parameters in cancer and benign ROIs for all patients were calculated (Table 1). ADC values were significantly lower in cancerous ROIs than benign ROIs (p<0.01). The pharmacokinetic parameters Ktrans, Kep and iAUGC, derived from DCE MRI, increased in cancer ROIs compared to benign ROIs (p<0.05). The mean values of (Cho+Spm+Cr)/Cit, Cho/Cit and Cho/Cr from GOIA-sLASER MRSI examinations in cancer ROIs were significantly higher than benign ROIs (p<0.01). The area under the curve (AUC) of RBF SVM models demonstrated that adding MRSI to mp-MRI exam substantially improved the diagnostic performance of detecting cancer in the central gland, in contrast to DCE MRI (Figure 2 and Table 2)). The average ADC demonstrated good correlation with the different aggressiveness groups (r= -0.49, p<0.01) (Figure 3A). A poor correlation was found for Ktrans (r= 0.26, p=0.05), a parameter derived from DCE. The (Cho+Spm+Cr)/Cit ratio derived from MRSI had the highest correlation with tumour aggressiveness (r= 0.57, p<0.01) (Figure 3B). The correlation of Cho/Cit and Cho/Cr with different risk groups were (r=0.36, p=0.01) and (r=0.30, p=0.02), respectively. Correlation coefficients for the normalized T2WI, Kep, and iAUGC parameters with Gleason grade groups were very low and non-significant (| r | < 0.25, p>0.05).Conclusion
This study demonstrates that the addition of GOIA-sLASER MRSI to structural T2WI and DWI substantially enhanced central gland cancer detection. As the inclusion of DCE did not improve central gland cancer detection and localization accuracy, a robust MRSI may be an attractive alternative in mp-MRI. Moderate correlation between cancer aggressiveness and metabolite ratios as well as ADC values was observed.Acknowledgements
This study was supported by the Hunter Cancer Research Alliance (HCRA). Authors would especially like to acknowledge the contribution of the Clinical Research and Statistical Support unit in Hunter Medical Research Institute (HMRI).References
1. Turkbey B, Rosenkrantz AB, Haider MA, et al. Prostate Imaging Reporting and Data System Version 2.1: 2019 Update of Prostate Imaging Reporting and Data System Version 2. European urology 2019;76(3):340-351.
2. Gholizadeh N, Greer PB, Simpson J, et al. Supervised risk predictor of central gland lesions in prostate cancer using (1) H MR spectroscopic imaging with gradient offset-independent adiabaticity pulses. Journal of magnetic resonance imaging 2019.
3. Kobus T, Wright AJ, Scheenen TW, et al. Mapping of prostate cancer by 1H MRSI. NMR in biomedicine 2014;27(1):39-52.
4. Kobus T, Wright AJ, Weiland E, et al. Metabolite ratios in 1H MR spectroscopic imaging of the prostate. Magnetic Resonance in Medicine 2015;73(1):1-12.
5. Kurhanewicz J, Vigneron DB, Nelson SJ. Three-Dimensional Magnetic Resonance Spectroscopic Imaging of Brain and Prostate Cancer. Neoplasia 2000;2(1-2):166-189.
6. Barentsz JO, Weinreb JC, Verma S, et al. Synopsis of the PI-RADS v2 Guidelines for Multiparametric Prostate Magnetic Resonance Imaging and Recommendations for Use. European urology;69(1):41-49.
7. Tayari N, Heerschap A, Scheenen TWJ, et al. In vivo MR spectroscopic imaging of the prostate, from application to interpretation. Anal Biochem 2017;529:158-170.
8. Steinseifer IK, Philips BW, Gagoski B, et al. Flexible proton 3D MR spectroscopic imaging of the prostate with low‐power adiabatic pulses for volume selection and spiral readout. Magnetic resonance in medicine 2017;77(3):928-935.
9. Tayari N, Steinseifer IK, Selnaes KM, et al. High-Quality 3-Dimensional 1H Magnetic Resonance Spectroscopic Imaging of the Prostate Without Endorectal Receive Coil Using A Semi-LASER Sequence. Invest Radiol 2017;52(10):640-646.
Figures