0384
Detection of Carbonic Anhydrase Activity in the Frontal Lobe of Human Brain
Shizhe Li1, Li An1, Christopher Johnson1, Maria Ferraris-Araneta1, Milalynn Victorino1, Jyoti Tomar1, and Jun Shen1
1National Institutes of Health, Bethesda, MD, United States
1National Institutes of Health, Bethesda, MD, United States
Synopsis
This study demonstrates the feasibility of detecting carbonic anhydrase activity in the frontal lobe of the human brain. Upon saturation of carbon dioxide, a very large magnetization transfer effect catalyzed by carbonic anhydrase was measured in the frontal lobe of healthy human subjects using 13C MRS with oral administration of [U-13C6]glucose. The results showed that it is feasible to examine carbonic anhydrase activity using magnetization transfer 13C MRS in the frontal cortex—where structural lesions, disturbed function, and morphology are strongly associated with many psychiatric symptoms.
INTRODUCTION
Carbonic anhydrase (CA) is an enzyme that catalyzes the reversible hydration of carbon dioxide and dehydration of bicarbonate. It plays a central role in life including in the CNS. CA abnormalities have been implicated in many brain disorders including several psychiatric disorders.1-3 Both carbonic anhydrase inhibitors and activators may have significant therapeutic effects.2-6 Using the technique of 13C magnetization transfer (MT) MRS, CA activity was previously measured in in the occipital lobe of the human brain.7 Here we demonstrate that CA activity can be measured in the frontal lobe of the human brain using 13C MT MRS, demonstrating the feasibility of characterizing CA in psychiatric disorders. The MT effects catalyzed by CA in frontal and occipital lobes are also compared.METHODS
Hardware: 13C MRS was performed on a Siemens 7T scanner using a home-built coil assembly. The proton coil was a shielded quadrature half-volume coil (two overlapping octagon loops, the nominal size of each loop was 12.7 x 12.7 cm2). The 13C coil was a 7-cm surface coil. For each subject, the angle of the headrest was adjusted so that the skin of the forehead is parallel to the B0 field. As a result, the axial 13C B1 field is perpendicular to the static magnetic field (Fig. 1).Glucose administration: Healthy volunteers were instructed to fast overnight before the scan. Solution of 20% w/w 99% enriched [U-13C6]glucose was orally administrated (n = 3) at the dosage of 0.75 g [U-13C6]glucose per kg of body weight.8
13C MRS: A rectangular voxel of 3.5 cm (SI) x 4 cm (AP) x 5 cm (LR) in the frontal lobe was shimmed by adjusting first- and second-order shims. The typical half-height water linewidth from the shimmed voxel was 17~20 Hz. The pulse sequence consisted of the following interleaved acquisition scheme: {control irradiation – bicarbonate excitation – acquisition} – {carbon dioxide saturation – bicarbonate excitation – acquisition}. TR = 30 s, SW = 8 kHz, data point = 2048, with NA = 8 per spectrum. The 13C excitation hard pulse (duration = 0.25 ms) was placed at the bicarbonate frequency (160.7 ppm). No proton decoupling was applied. During the 30 s delay, a 50 ms pulse block was repeatedly executed. In each pulse block, a 1.0 ms proton hard pulse (120o) was applied first at the water frequency to generate heteronuclear NOE, then a 48.0 ms continuous wave pulse (γB1 = 50 Hz) was applied at 228.0 ppm for control irradiation or at 125.0 ppm to saturate carbon dioxide. The average RF power for the entire sequence was 3 W.
RESULTS
Fig. 2 shows time-course spectra acquired from a subject after oral administration of [U-13C6]glucose without saturation of carbon dioxide. Glutamate C1 and C5; glutamine C1 and C5; aspartate C1 and C4; as well as bicarbonate C1 were detected in the carboxylic/amide region. Fig. 3A shows the MT effect catalyzed by CA during the 90-120 min interval after oral administration. Spectrum (a) is the sum of the last three control spectra (NA = 24), (b) is the sum of the last three spectra with saturation of carbon dioxide (NA = 24), and (c) is the difference spectrum. The saturation transfer ratio (the ratio of the bicarbonate peak area with carbon dioxide saturation to that with control irradiation) was 0.33 ± 0.06 (n = 3) in the frontal lobe. For the comparison purpose, the corresponding spectra from the occipital lobe of a different subject are shown in Fig. 3B7. The saturation transfer ratio calculated from the occipital lobe spectra was 0.34 ± 0.03 (n = 3). An unpaired t-test was performed to compare the saturation transfer ratios from the two regions. There was no statistical difference in the carbonic anhydrase activities between the occipital (n = 3) and frontal lobes (n = 3) of healthy subjects.DISCUSSION
This study demonstrates that it is practically feasible to measure CA activity in vivo in the frontal lobe of the human brain and to characterize this important enzyme in many neuropsychiatric disorders. To our best knowledge, this is the first report of detection of carbonic anhydrase activity in the frontal lobe of human brain in vivo. Frontal lobe 13C MRS has been challenging due to technical hurdles. The frontal sinus, nasal cavity, and sphenoid sinus lay below the frontal cortex. The sinuses reduce the total volume of brain tissue near the 13C coil. They also create strong B0 field inhomogeneity in the frontal lobe. As the result, the linewidth of the frontal lobe spectra (Fig. 3A) was generally greater than that from the occipital lobe (Fig. 3B). Despite the above difficulties our results showed that high quality 13C MT data can be readily acquired. The saturation transfer ratio of the frontal lobe was found to be essentially the same as that of the occipital lobe. The dramatic signal change in the bicarbonate signal intensity due to MT effect makes this technique highly viable for a broad range of clinical applications involving carbonic anhydrase.Acknowledgements
The authors gratefully acknowledge the support of the Intramural Research Program of the National Institute of Mental Health, National Institutes of Health.References
- Johnston-Wilson NL, et
al. Disease-specific alterations in frontal cortex brain proteins in
schizophrenia, bipolar disorder, and major depressive disorder. Mol Psychiatry. 2000;5:142–149.
- Sacks W, et al. Acetazolamide and thiamine: an ancillary therapy for chronic mental illness. Psychiatry Res. 1989;28:279-288
- Hayes SG., Acetazolamide in bipolar affective disorders. Ann Clin Psychiatry. 1994;6:91-98.
- Sun MK, Alkon DL. Carbonic anhydrase gating of attention: memory therapy and enhancement. Trends Pharmacol Sci. 2002;23:83-89.
- Sly WS, et al. Carbonic anhydrase II deficiency in 12 families with the autosomal recessive syndrome of osteopetrosis with renal tubular acidosis and cerebral calcification. N Engl J Med. 1985;313:139-145.
- Thiry A, et al. Carbonic anhydrase inhibitors as anticonvulsant agents. Curr Top Med Chem. 2007;7:855-64.
- Li S, et al. Determine the rate of carbonic anhydrase reaction in the human brain. Scientific Report. 2018;8:2328-2335.
- Mason GF, et al. A comparison of 13C NMR measurements of the rates of glutamine synthesis and the tricarboxylic acid cycle during oral and intravenous administration of [1-13C]glucose. Brain Research Protocols. 2003;10:181-190.
Figures
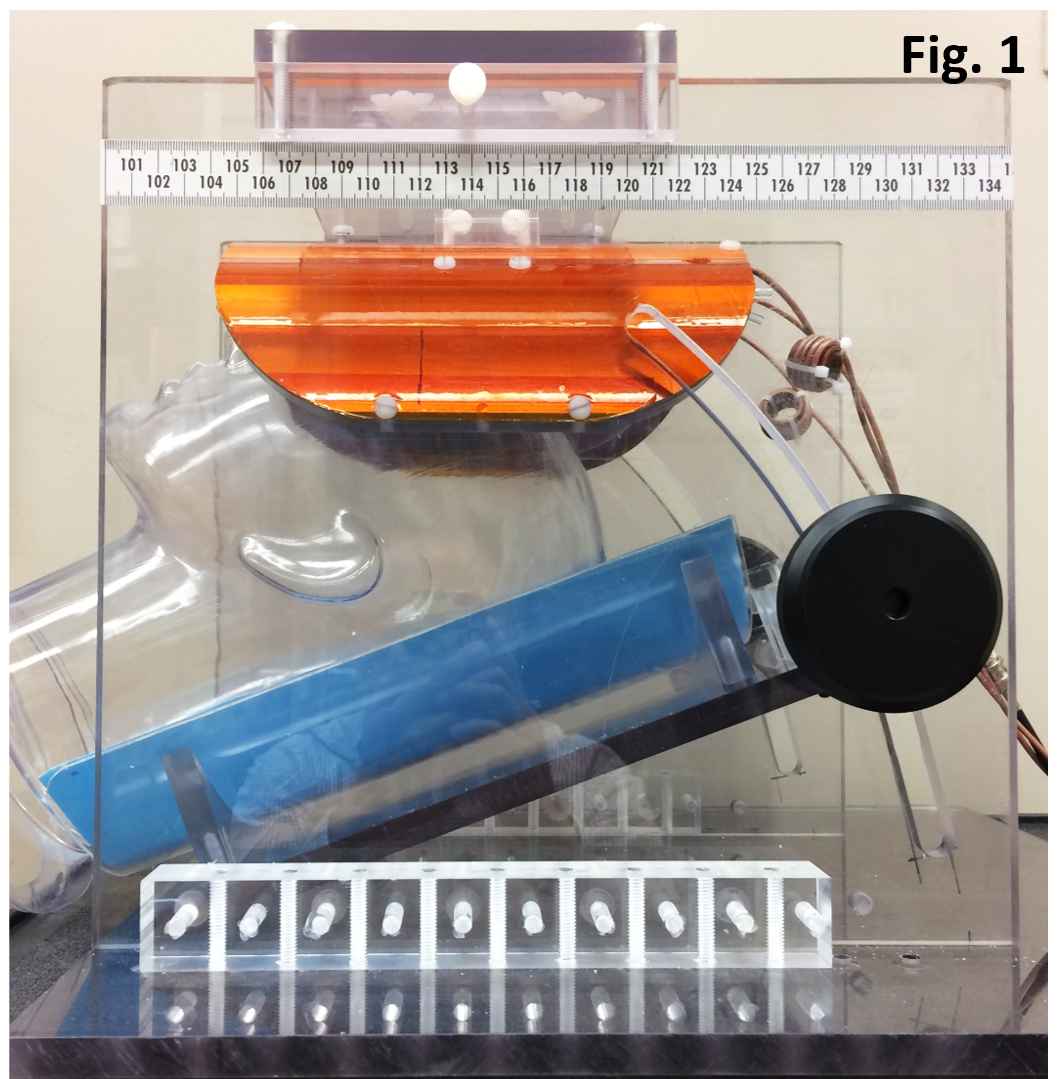
Fig. 1. The home-built RF coil assembly. The
proton coil was a shielded quadrature half-volume coil. The 13C coil
was a 7-cm surface coil. For each subject, the angle of the headrest was
adjusted so that the skin the forehead is parallel to B0 field,
thus the axial B1 field of the 13C coil is perpendicular
to B0 field in order to maximize 13C sensitivity.
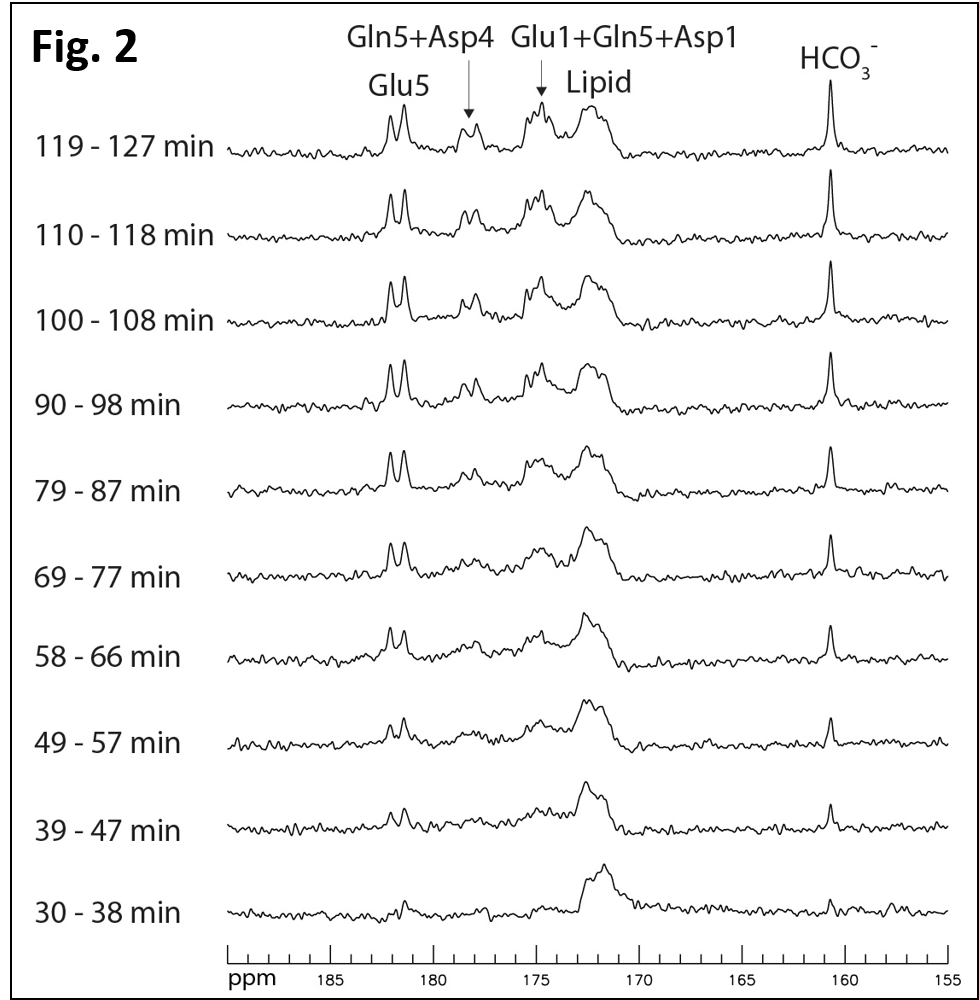
Fig. 2.
Time-course of 13C MRS spectra acquired from the frontal lobe of a
healthy subject after oral administration of [U-13C6]glucose
and without saturation of carbon dioxide. TR = 30 s, BW = 8 kHz, Data point = 2048,
NA = 8 per spectrum, GB = 10 Hz.
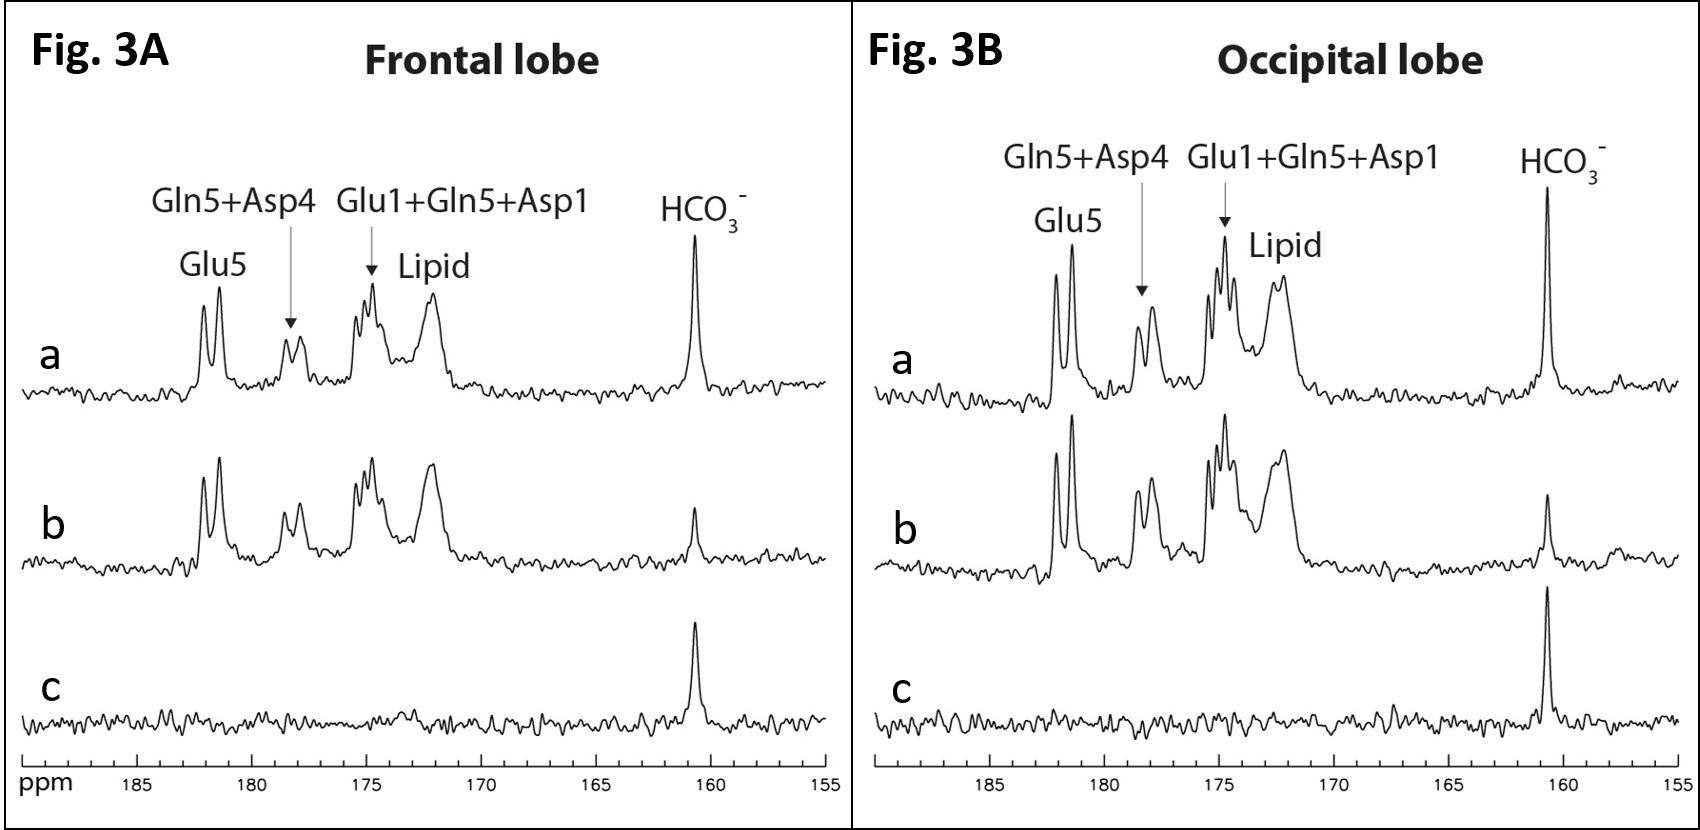
Fig. 3A. MT effect catalyzed by carbonic
anhydrase in the frontal lobe of a subject acquired between 90-110 min after
oral glucose administration. (a) Control spectrum (NA = 24), (b) Magnetization transfer
spectrum (NA = 24) with saturation pulse placed at the resonance of carbon
dioxide at 125.0 pm, and (c) the difference spectrum. TR = 30 s, BW = 8 kHz, Data
point = 2048, GB = 10 Hz. For the comparison purpose, the corresponding spectra
from the occipital lobe7 of a different subject are shown in Fig.
3B.