0383
Penumbra Identification in Acute Stroke Using Fast 3D 1H-MRSI1Institute for Medical Imaging Technology, School of Biomedical Engineering, Shanghai Jiao Tong University, Shanghai, China, 2Radiology Department, The Fifth People's Hospital of Shanghai, Fudan University, Shanghai, China, 3Beckman Institute for Advanced Science and Technology, University of Illinois at Urbana-Champaign, Urbana, IL, United States, 4Department of Electrical and Computer Engineering, University of Illinois at Urbana-Champaign, Urbana, IL, United States, 5Department of Biomedical Engineering, Case Western Reserve University, Cleveland, OH, United States
Synopsis
Impaired metabolism was a key factor in the definition of ischemic penumbra. 1H-MRSI has been recognized as a potentially powerful tool for metabolic imaging of stroke. In this proof of concept clinical study, we explored the potential of fast 3D high-resolution 1H-MRSI to investigate brain neurometabolic changes at tissue-level in acute stroke. In a 6-min scan, we obtained N-acetylaspartate (NAA) and lactate (Lac) maps simultaneously. Our experimental results showed different NAA and Lac concentrations between hypoperfused tissue recruited to final infarct and that survived, indicating an improved delineation of penumbra by incorporating the tissue neuronal damage and acidosis information.
Introduction
Rapid and accurate assessment of brain tissue viability or identification of ischemic penumbra is of great importance in acute stroke 1. Impaired metabolism was identified as a hallmark in the original description of ischemic penumbra 2,3. MRSI has long been recognized as a potentially powerful tool for detection of neurometabolic alterations induced by stroke noninvasively. Using 1H-MRSI, N-acetylaspartate (NAA) can be measured as a marker of neuronal integrity, lactate (Lac) as a marker of anerobic glycolysis and tissue acidosis. However, most existing MRSI studies in stroke were performed using single-slice MRSI or single-voxel techniques at low spatial resolution 3,4. The long data acquisition time and partial volume effects reduced the sensitivity of detecting metabolic alterations. In this proof of concept study, we explored the potential of brain metabolic imaging to investigate neurometabolic changes at tissue-level in acute stroke using a fast 3D high-resolution 1H-MRSI technology, known as SPICE (SPectroscopic Imaging by exploiting spatiospectral CorrElation). In a 6-min scan, we obtained maps of NAA and Lac at a nominal spatial resolution of 2.0 × 3.0 × 3.0 mm3. Our experimental results showed different NAA and Lac concentrations between hypoperfused tissue recruited to infarct and that survived, which indicates an improved delineation of penumbra by separating diffusion-perfusion mismatch areas into areas of benign oligemia and ischemic penumbra. Our study may lay a foundation for further investigation of whole brain 3D high-resolution 1H-MRSI of stroke in various clinical settings.Methods
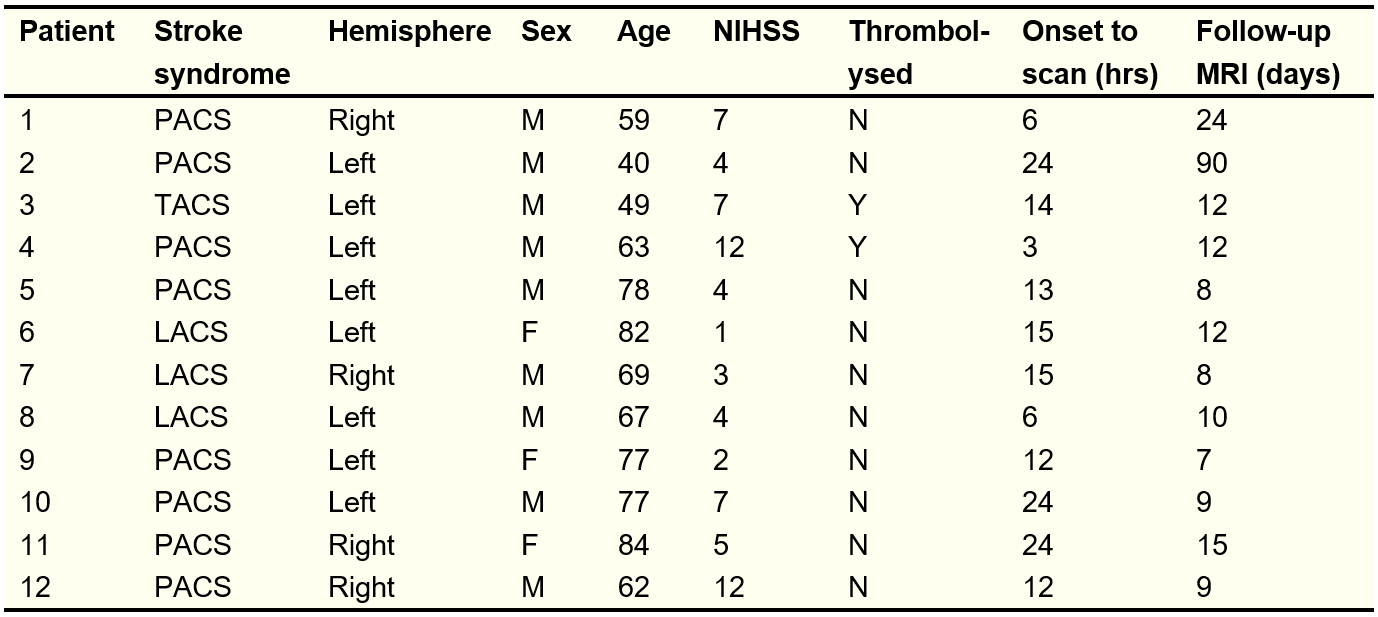
We recruited 12 patients with ischemic stroke within 24 h of symptom onset. The MR scans were performed at acute stage and repeated at 7 days or later to determine infarct expansion. The study was approved by the Institutional Review Board of the Fifth People’s Hospital of Shanghai, China.The rapid high-resolution metabolic imaging was performed using SPICE technology 5,6 (2.0 × 3.0 × 3.0 mm3, FOV: 240 × 240 × 72 mm3, TE = 1.6 ms, TR = 160 ms). We also performed structural imaging, including diffusion-weighted imaging (DWI) (1.3 x 1.3 x 4.0 mm3, FOV = 220 mm, b = 0 and b = 1000 s/mm2, TR = 5200 ms, TE = 64 ms), 3D MPRAGE imaging (1.0 × 1.0 × 1.0 mm3, FOV = 256 mm, TR = 2500 ms, TE = 2.26 ms, TI = 900 ms) and T2-weighted Fluid-Attenuated Inversion Recovery (FLAIR) imaging (0.5 × 0.5 × 2.0 mm3, FOV = 240 mm, TR = 9000 ms, TE = 89 ms). The perfusion images were acquired using multiple post-labelling delays pseudo-continuous arterial spin labelling (3.75 × 3.75 × 3.75 mm3, FOV = 240 mm, TR = 3300 ms, TE = 10.3 ms, TI = 150 ms, delays = 0.8 s, 1.0 s, 1.5 s, 2.2 s, 3.0 s) 7. All the scans were performed on a 3.0T Siemens Skyra scanner.
The spatiospectral functions from the SPICE data were reconstructed using a union-of-subspaces model, incorporating pre-learned spectral basis functions 5,6. The spectral quantification was done using an improved LCmodel-based algorithm 8,9. All the images were coregistered to T1-weighted images using affine linear transformation. The ADC lesion area was defined as ADC below 620 × 10-6 mm2/s. The hypoperfusion area was defined as CBF below 20 ml/100g/min. The final infarct was manually defined on the follow-up FLAIR images. Three individual regions of interest masks were generated: 1) infarct core: tissue present in both acute ADC lesion and final FLAIR infarct; 2) infarct growth: tissue present in final FLAIR infarct but not in the acute ADC lesion; 3) oligemia: tissue present in the hypoperfusion area but not the ADC lesion and final infarct.
We performed group comparisons using SPSS v24. The Mann Whitney test was used to compare the voxel-wise means between two different regions of interest. Analysis of variance (ANOVA) test was utilized for multiple regions of interest comparisons.
Results
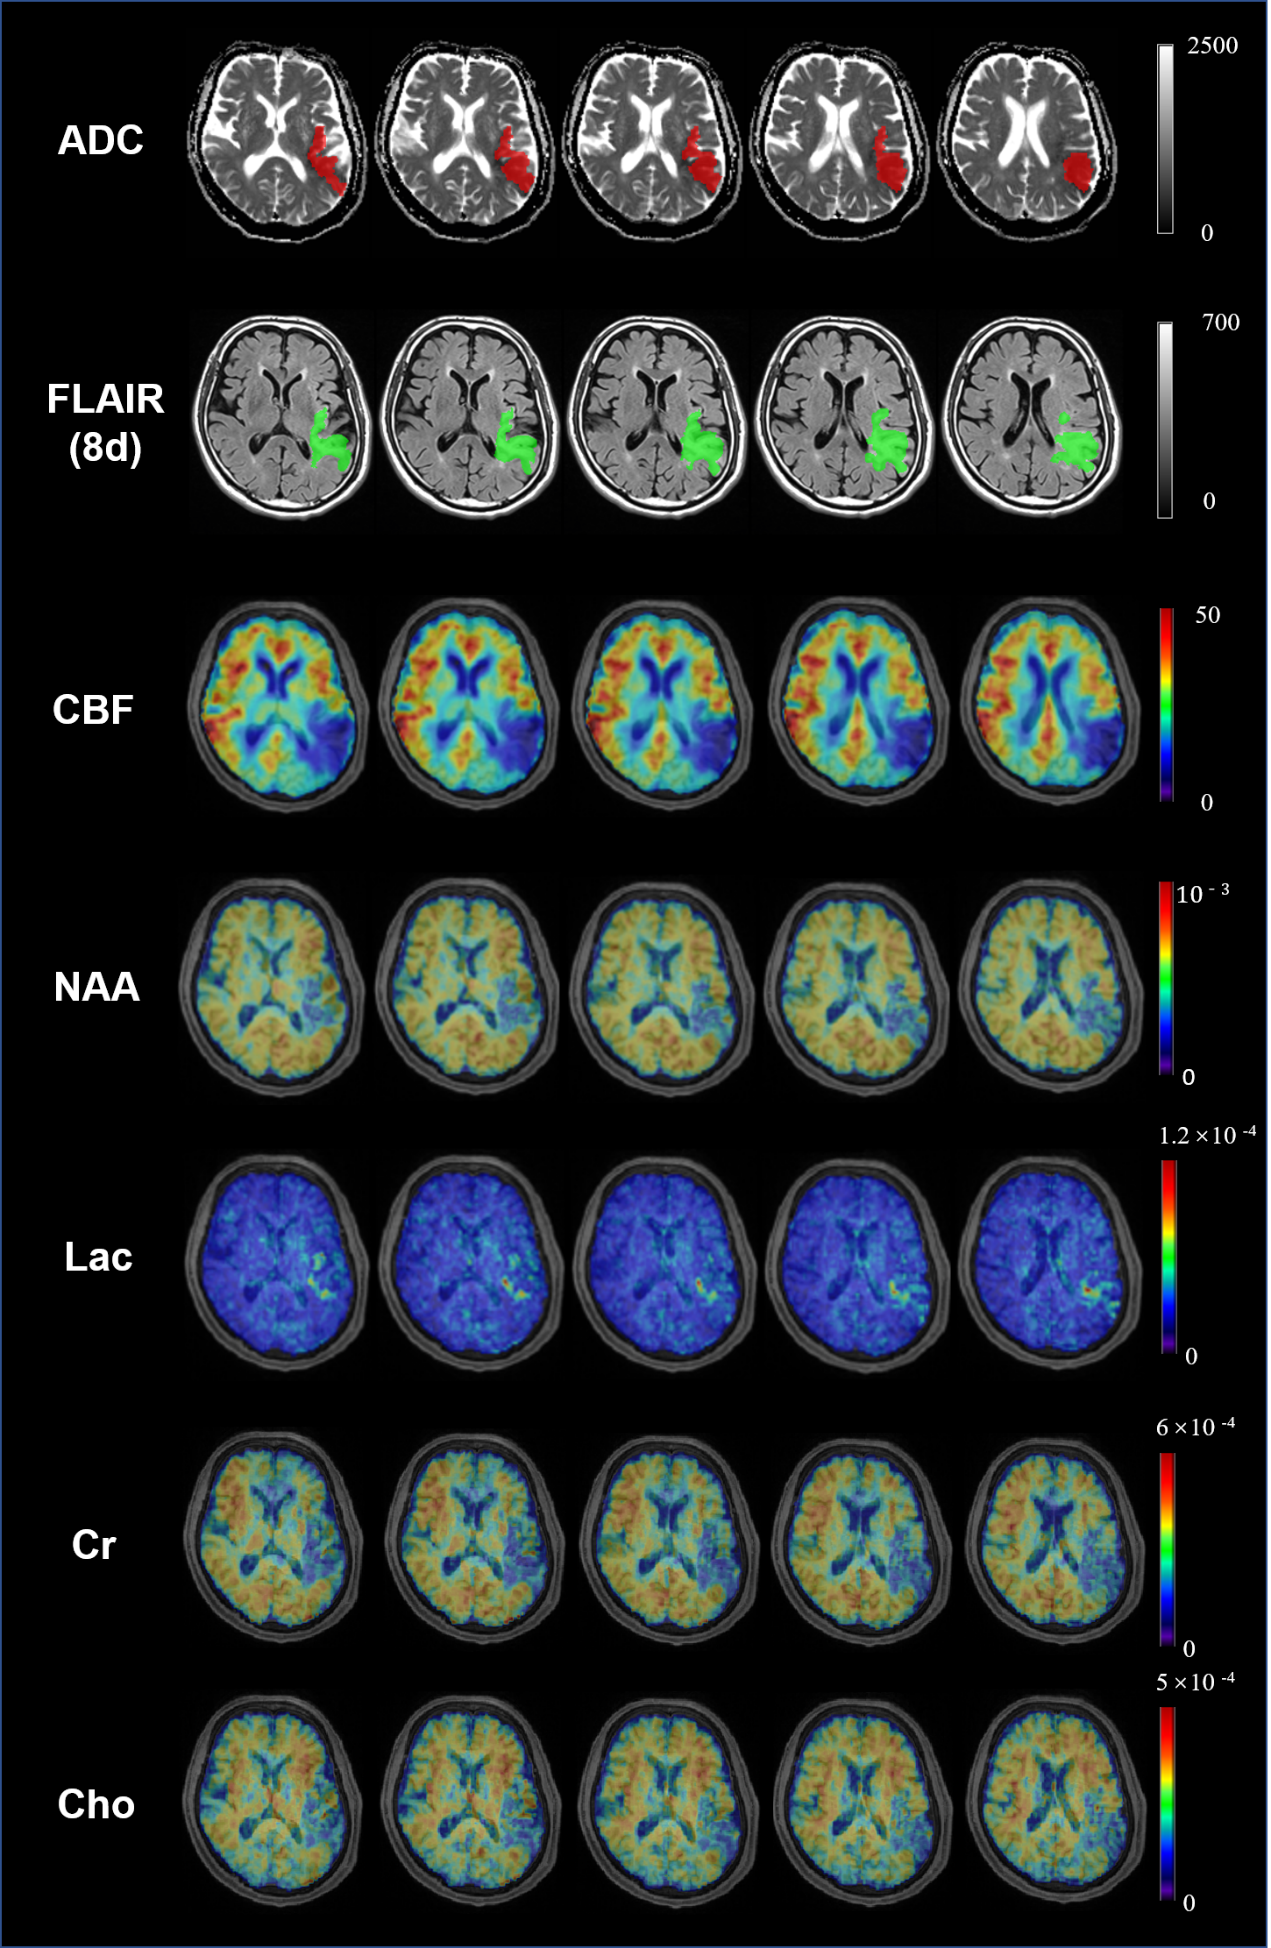
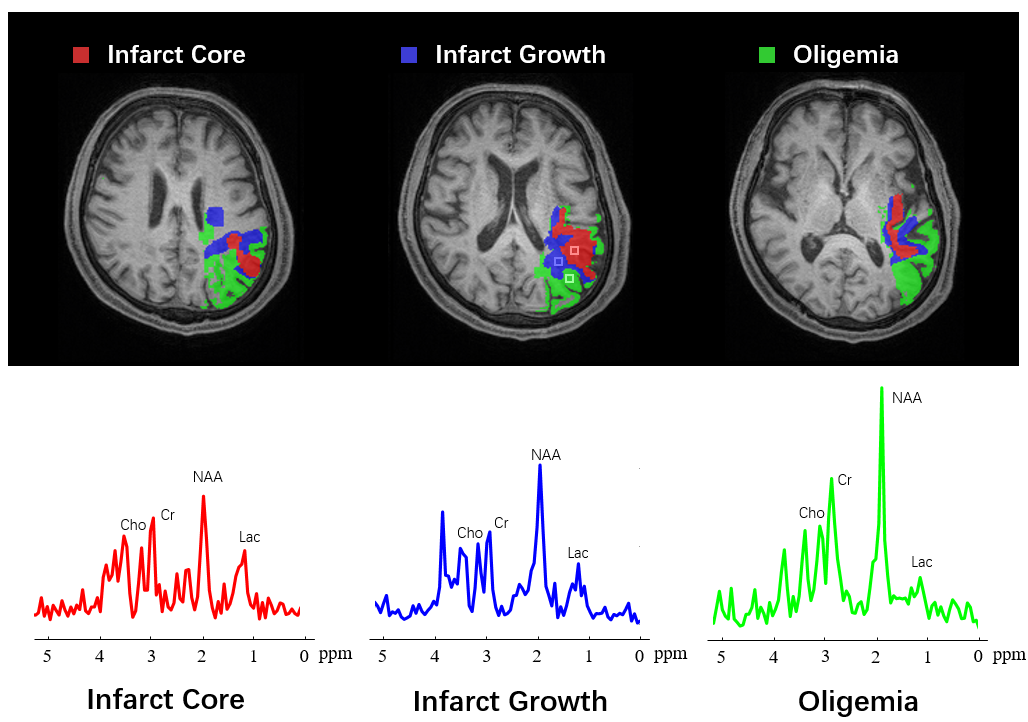
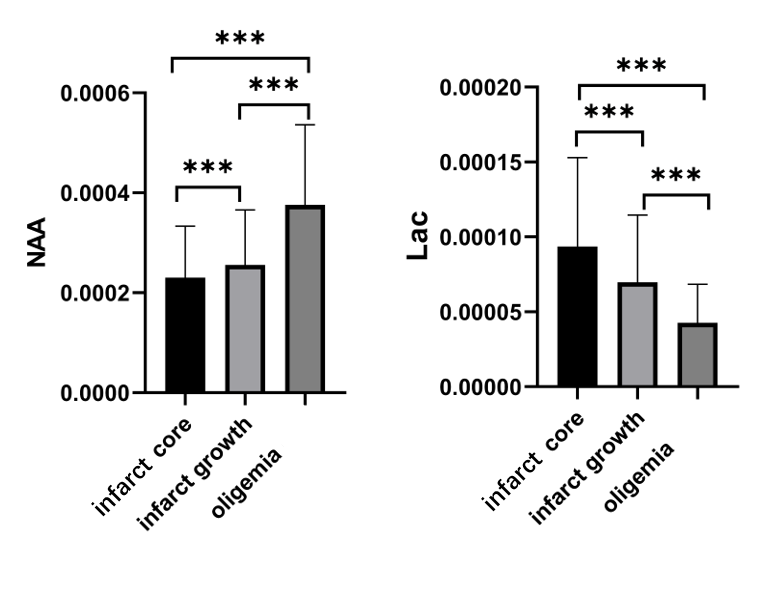
Figure 1 shows the high-resolution metabolite maps of an acute stroke patient. Figure 2 shows the representative spectra from the infarct core, infarct growth and oligemia areas, respectively. The NAA reduction and Lac increase in both the infarct core and infarct growth areas can be clearly observed. Figure 3 shows the group comparison results. Voxels within infarct core had a lower level of NAA and a higher level of Lac than hypoperfused tissue recruited to the final infarct (p<0.001), which was in turn lower in NAA and higher in Lac than hypoperfused tissue that survived (p<0.001). These results indicate that NAA and Lac might serve as biomarkers to separate diffusion-perfusion mismatch area into benign oligemia and ischemic penumbra in acute stroke, as proposed in previous literature 3.Conclusion
We explored the potential of fast 3D high-resolution 1H-MRSI of brain metabolic imaging for penumbra identification. In a 6-min acquisition, we obtained the 3D mappings of NAA and Lac simultaneously. We showed metabolic mapping using SPICE provides an improved delineation of penumbra by separating diffusion-perfusion mismatch areas into areas of benign oligemia and ischemic penumbra. Our study opens the possibilities of investigating in vivo whole brain neurometabolic changes of stroke in various clinical settings.Acknowledgements
This work is supported by National Science Foundation of China (No.61671292 and 81871083).References
1. Leigh R, Knutsson L, Zhou J, et al. Imaging the physiological evolution of the ischemic penumbra in acute ischemic stroke. J Cereb Blood Flow Metab 2018, 38:1500-1516.
2. Heiss W-D. The ischemic penumbra: correlates in imaging and implications for treatment of ischemic stroke. Cerebrovascular Diseases 2011, 32(4):307-20.
3. Dani KA and Warach S. Metabolic imaging of ischemic stroke: the present and future, Am J Neuroradiol 2014, 35:37-43.
4. Cvoro V, Wardlaw JM, Marshall I, et al. Associations between diffusion and perfusion parameters, N-acetyl aspartate, and lactate in acute ischemic stroke. Stroke 2009, 40:767-772.
5. Fan L, Ma C, Clifford B, et al. High‐resolution 1H‐MRSI of the brain using SPICE: data acquisition and image reconstruction. Magn Reson Med 2016, 76:1059-1070.
6. Peng X, Lam F, Li Y, et al. Simultaneous QSM and metabolic imaging of the brain using SPICE. Magn Reson Med 2018, 79:13-21.
7. Vidorreta M, Wang Z, Chang Y V, et al. Whole-brain background-suppressed pCASL MRI with 1D-accelerated 3D RARE Stack-Of-Spirals readou. PloS one 2017, 12(8): e0183762.
8. Li Y, Lam F, Clifford B, et al. A Subspace Approach to Spectral Quantification for MR Spectroscopic Imaging. IEEE Trans Biomed Eng 2017, 64:2486-2489.
9. Ma C, Lam F, Johnson C L, et al. Removal of nuisance signals from limited and sparse 1H MRSI data using a union‐of‐subspaces model. Magn Reson Med 2016, 75:488-497.
Figures