0382
Multi-sample measurement of pyruvate/lactate flux in melanoma cells using an HP micromagnetic resonance spectrometer and D2O solvation1Memorial Sloan Kettering Cancer Center, NEW YORK, NY, United States, 2University of California, Berkeley, Berkeley, CA, United States
Synopsis
The pyruvate-lactate flux, kPL, shows promise as a biomarker of cancer presence and aggressiveness, and assessment of kPL in patient-derived cells may be a useful tool to assess treatment response for advanced personalized medicine. Here we present a novel experimental protocol for the real-time measurement of pyruvate-lactate metabolic flux in multiple mass-limited cell suspension samples using a single dissolution, thereby increasing efficiency and providing greater control of the methodological variability associated with HP experiments. We then applied this protocol to the measurement of pyruvate-lactate flux in melanoma cells for the assessment of treatment response to BRAF inhibition.
Introduction
Hyperpolarized (HP) pyruvate has been examined for its potential clinical value in oncology,1-5 due to the Warburg effect,6 a metabolic hallmark of cancer7 characterized by the excess conversion of pyruvate to lactate, even in the presence of oxygen.8 The pyruvate-lactate flux, kPL, may therefore serve as a useful biomarker of cancer presence, aggressiveness and treatment response,9 and assessment of kPL in patient-derived cells and organoid cultures may be a useful tool for assessment of response to multiple treatment regimens for advanced personalized medicine.10 Traditional DNP-MRS in vitro experiments require that the HP probe be dissolved for each cell sample independently, a costly process in both time and resources. We previously developed a hyperpolarized micromagnetic resonance spectrometer (HMRS), featuring a microcoil in the horizontal plane, for the real-time quantitative measurement of metabolic flux in live cells,11 with greatly increased detection sensitivity (103-fold). Here we present a novel system and experimental protocol to allow for the real-time measurement of metabolic flux in multiple mass-limited cell suspension samples, thereby increasing efficiency and providing greater control of the methodological variability associated with HP experiments. Following development of the experiment protocol, we applied this technique to the measurement of pyruvate-lactate flux in melanoma cells for the assessment of treatment response to BRAF inhibition.Methods
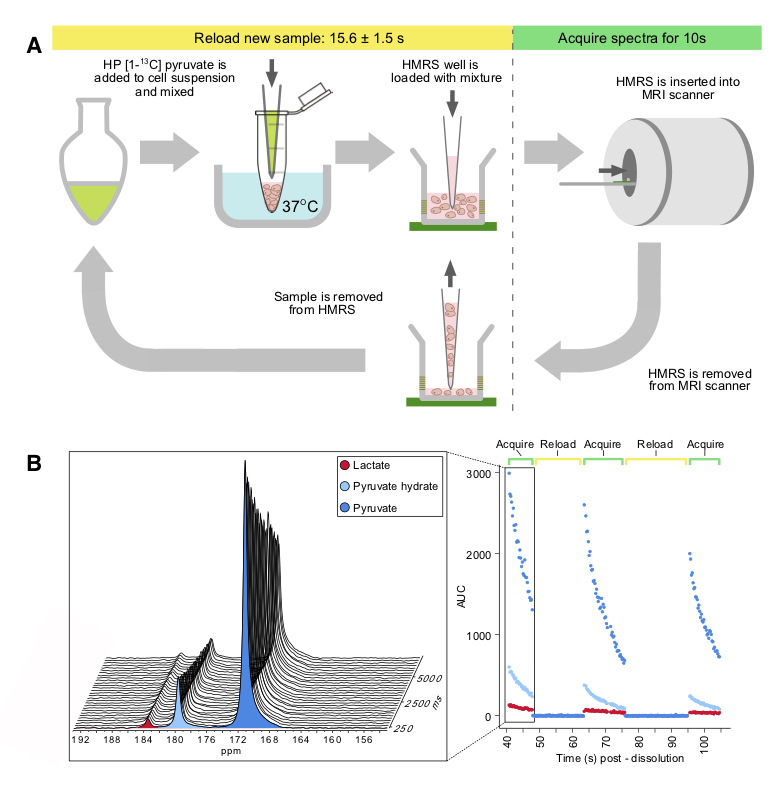
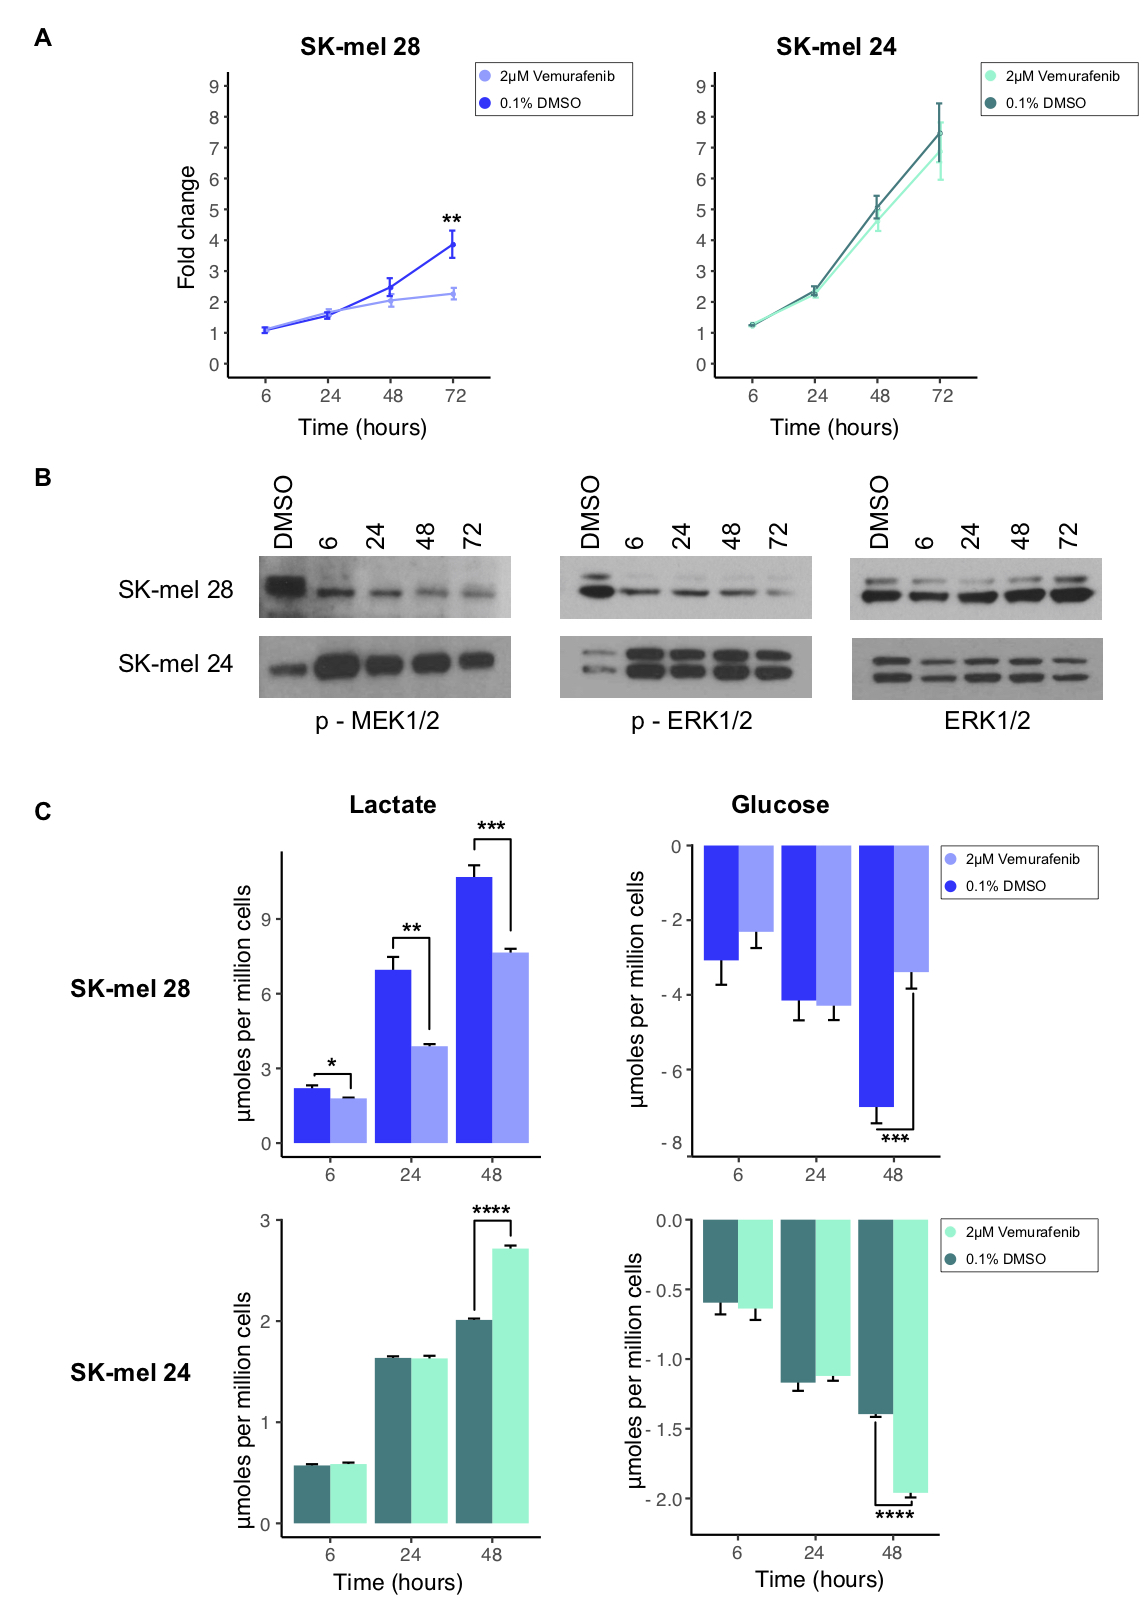
The HMRS system was designed and assembled as previously described,11 with a microcoil in the vertical plane to allow for rapid cell suspension sample load/unload/reload capability. Two human melanoma cell lines: SK-mel 28 (BRAFV600E) and SK-mel 24 (BRAFWT ) were used; cell proliferation was measured with an IncuCyte HD system and target inhibition by the BRAFi was assessed using Western blot analysis. The treatment protocol for cell proliferation/Western blot experiments was 2µM Vemurafenib treatment at 6, 24, 48 and 72 hours. 1H NMR spectroscopy (14.1T, Bruker Biospin) was used to measure media lactate and glucose concentrations following 2µM Vemurafenib treatment at 6, 24 and 48 hours. HP [1-13C]pyruvate was prepared using trityl radical, as previously described,11 using the DNP method (SPINlab polarizer, 5T) and dissolved in 10mL of TRIS buffer (100mM TRIS, 1 mM EDTA, pH 7.4 in D2O), neutralized with sodium hydroxide, to give a solution of 50mM, pH 7.4. Cells were treated for 24 hours with the BRAFi or 0.1% DMSO as a vehicle control. HP pyruvate was added to cell suspension samples with a ratio of 1:5 (final concentration ~10mM). Time-resolved HP-MRS data were acquired using a permanent 3T MRI system (Bruker); a 13C single pulse was acquired every 250ms, using a 15° excitation and a free induction decay of 2048 points. HP spectroscopic data were processed using a custom script (MATLAB).Results and Discussion
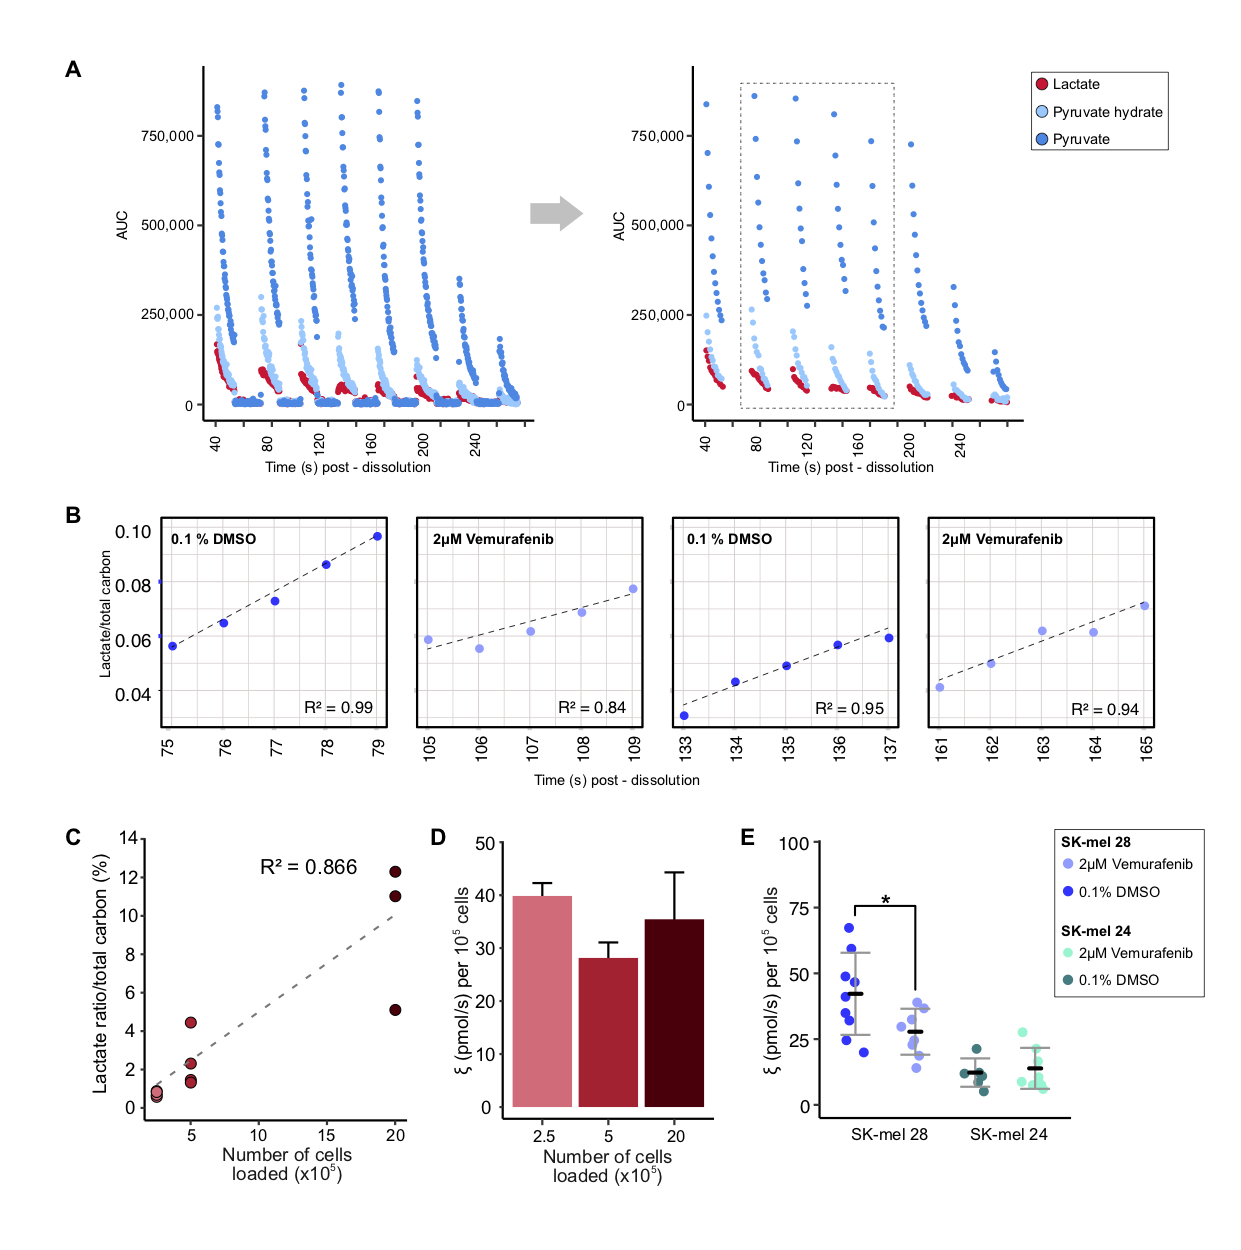
The use of deuterated buffer for dissolution extended the T1 of HP [1-13C]pyruvate from 73.8± 2.0s to 147.4± 6.3s at 1T. This extended T1 decay allowed for up to 8 sample measurements to be acquired per dissolution. A summary of the developed experimental protocol for measuring the kPL of multiple cell suspension samples is shown in Figure 1A. The peak areas acquired for HP [1-13C]pyruvate, HP [1-13C]pyruvate hydrate and HP [1-13C]lactate (Figures 1B, 2A) in the first 5 seconds are used to calculate the ratio of lactate relative to the total carbon signal, per second, and a linear model is fit to determine the slope (Figure 2B), which represents the initial conversion rate of pyruvate to lactate, kPL.11 The sensitivity of the system was tested and demonstrated reproducible results with 2.5x10⁵ SK-mel 28 melanoma cells and scales linearly with cell number (R2=0.866, Figure 2C); this calculated metric is normalized to the number of cells loaded to give ξ (pmols/s) per 105 cells and allows for comparison across samples (Figure 2D). A 24 hour treatment with 2µM Vemurafenib led to a significant reduction in the rate of HP pyruvate to lactate conversion (p=0.03), in BRAFV600E SK-mel 28 cells (Figure 2E), this is supported by significant changes in the pool size of lactate production and glucose consumption from 6 to 48 hours, respectively, and in cell proliferation following 72 hours of treatment (Figure 3). As expected, BRAFi-insensitive BRAFWT cells showed no significant change in metabolic flux, reflected in no difference observed in 1H NMR media pool size and cell proliferation measurements acquired for this duration of treatment. These data were acquired with an average of 6 measurements per dissolution, representing a 6-fold increase in efficiency for measurement of kPL in cell suspension samples, compared to traditional methods.Conclusions
Deuterated solvation of [1-13C]pyruvate, combined with a highly-sensitive HMRS system, enabled reproducible, “high throughput” measurements of pyruvate-lactate metabolic flux in multiple independent samples using a single HP dissolution. The benefits of this approach include a reduction in costs and variability associated with each dissolution experiment, and expedited experimental progress, with the potential for a two group comparative in vitro study (n=4) to be completed with one dissolution. The increased sensitivity of the HMRS system, relative to traditional HP cell suspension methodology, may be particularly useful for translation to slow-growing patient-derived primary cells or organoid cultures whereby biological material is limited.Acknowledgements
NIH/NCI S10 OD016422, R21 CA212958, Cancer Center Support Grant P30 CA008748 and The Alan and Sandra Gerry Metastasis and Tumor Ecosystems Center. SK-mel 28 and SK-mel 24 cell lines were a generous gift from the Jedd Wolchok Lab. Vemurafenib was kindly donated by the Neal Rosen Lab.References
1. Kurhanewicz, J.; Vigneron, D. B.; Brindle, K.; Chekmenev, E. Y.; Comment, A.; Cunningham, C. H.; Deberardinis, R. J.; Green, G. G.; Leach, M. O.; Rajan, S. S.; Rizi, R. R.; Ross, B. D.; Warren, W. S.; Malloy, C. R., Analysis of cancer metabolism by imaging hyperpolarized nuclei: prospects for translation to clinical research. Neoplasia 2011, 13 (2), 81-97.
2. Golman, K.; Zandt, R. i.; Lerche, M.; Pehrson, R.; Ardenkjaer-Larsen, J. H., Metabolic Imaging by Hyperpolarized <sup>13</sup>C Magnetic Resonance Imaging for <em>In vivo</em> Tumor Diagnosis. Cancer Research 2006, 66 (22), 10855.
3. Day, S. E.; Kettunen, M. I.; Gallagher, F. A.; Hu, D.-E.; Lerche, M.; Wolber, J.; Golman, K.; Ardenkjaer-Larsen, J. H.; Brindle, K. M., Detecting tumor response to treatment using hyperpolarized 13C magnetic resonance imaging and spectroscopy. Nature Medicine 2007, 13 (11), 1382-1387.
4. Nelson, S. J.; Kurhanewicz, J.; Vigneron, D. B.; Larson, P. E. Z.; Harzstark, A. L.; Ferrone, M.; van Criekinge, M.; Chang, J. W.; Bok, R.; Park, I.; Reed, G.; Carvajal, L.; Small, E. J.; Munster, P.; Weinberg, V. K.; Ardenkjaer-Larsen, J. H.; Chen, A. P.; Hurd, R. E.; Odegardstuen, L.-I.; Robb, F. J.; Tropp, J.; Murray, J. A., Metabolic Imaging of Patients with Prostate Cancer Using Hyperpolarized [1-<sup>13</sup>C]Pyruvate. Science Translational Medicine 2013, 5 (198), 198ra108.
5. Kurhanewicz, J.; Vigneron, D. B.; Ardenkjaer-Larsen, J. H.; Bankson, J. A.; Brindle, K.; Cunningham, C. H.; Gallagher, F. A.; Keshari, K. R.; Kjaer, A.; Laustsen, C.; Mankoff, D. A.; Merritt, M. E.; Nelson, S. J.; Pauly, J. M.; Lee, P.; Ronen, S.; Tyler, D. J.; Rajan, S. S.; Spielman, D. M.; Wald, L.; Zhang, X.; Malloy, C. R.; Rizi, R., Hyperpolarized (13)C MRI: Path to Clinical Translation in Oncology. Neoplasia 2019, 21 (1), 1-16.
6. Warburg, O.; Wind, F.; Negelein, E., The metabolism of tumors in the body. The Journal of General Physiology 1927, 8 (6), 519.
7. Hanahan, D.; Weinberg, Robert A., Hallmarks of Cancer: The Next Generation. Cell 2011, 144 (5), 646-674.
8. Vander Heiden, M. G.; Cantley, L. C.; Thompson, C. B., Understanding the Warburg Effect: The Metabolic Requirements of Cell Proliferation. Science 2009, 324 (5930), 1029.
9. Keshari, K. R.; Sriram, R.; Van Criekinge, M.; Wilson, D. M.; Wang, Z. J.; Vigneron, D. B.; Peehl, D. M.; Kurhanewicz, J., Metabolic Reprogramming and Validation of Hyperpolarized 13C Lactate as a Prostate Cancer Biomarker Using a Human Prostate Tissue Slice Culture Bioreactor. The Prostate 2013, 73 (11), 1171-1181.
10. Drost, J.; Clevers, H., Organoids in cancer research. Nature Reviews Cancer 2018, 18 (7), 407-418.
11. Jeong, S.; Eskandari, R.; Park, S. M.; Alvarez, J.; Tee, S. S.; Weissleder, R.; Kharas, M. G.; Lee, H.; Keshari, K. R., Real-time quantitative analysis of metabolic flux in live cells using a hyperpolarized micromagnetic resonance spectrometer. Science Advances 2017, 3 (6), e1700341.
Figures