0381
Functional spectroscopic imaging (fMRSI) detects metabolite changes in the activated primary sensorimotor cortex at 7T1Department of Medical Imaging and Image-guided Therapy, Medical University of Vienna, Vienna, Austria, 2Department of Psychiatry and Psychotherapy, Medical University of Vienna, Vienna, Austria
Synopsis
Functional single-voxel MRS (fMRS) was capable to sensitively detect metabolite responses to sensory stimulation, but suffered from large partial volume effects, that questioned the clinical utility of fMRS. Free-induction decay (FID)-MRSI promises to possess sufficient SNR to reach the sensitivity of SV-MRS and overcome its limitations by selective mapping the volume of interest with multiple voxels and thus, with higher spatial resolution, minimize the partial volume issue. Concentric-ring-trajectories (CRT)-based 3D FID-MRSI showed sufficient sensitivity and temporal stability to detect functional glutamate changes in the dominant sensorimotor region with expected most robust metabolite responses during finger tapping task.
Introduction
Single-voxel MRS (SV-MRS) sensitively detected small functional metabolite responses to a visual stimulus or finger tapping task in the primary visual1 and dominant left sensorimotor cortex (SM),2 respectively. Glutamate (Glu) increase was detected with high reliability and thus Glu was proposed as a marker of activated brain energetic metabolism.1 However, SV-MRS suffered from large partial volume effects. Usually, ~ 50% of the SV-MRS volume contains brain tissue not activated by the task. This leads to the high between-subject variance of Glu responses and that questioned the clinical utility of fMRS.3 Also, it is not possible to monitor functional changes in multiple brain regions at once. Therefore, we aimed to test the capability of an optimized 3D free induction decay (FID)-MRSI sequence to detect glutamate changes in the activated SM at 7T4. FID-MRSI promises to possess sufficient SNR to reach the sensitivity of SV-MRS and overcome its limitations by selective mapping the volume of interest with multiple voxels and thus, with higher spatial resolution, minimize the partial volume issue.Methods
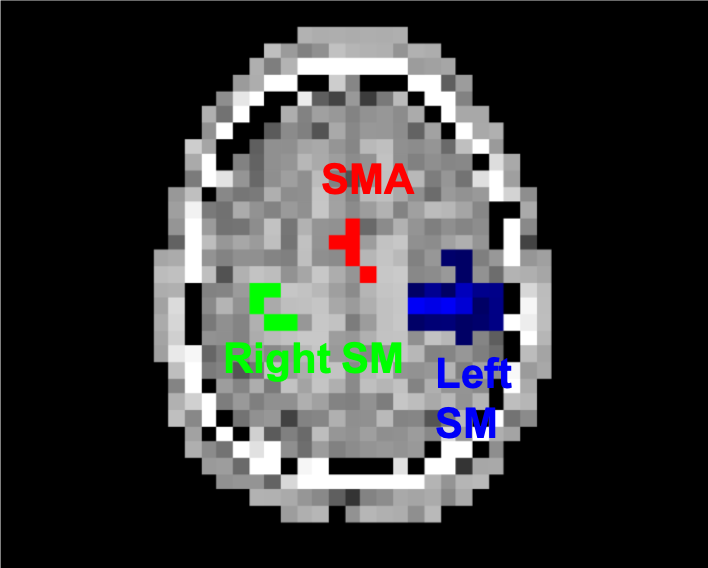
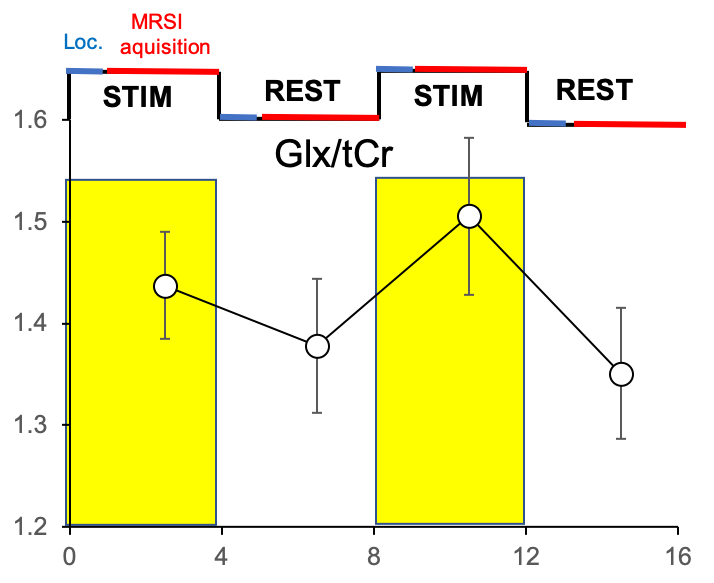
Seven healthy right-handed volunteers (30±12 y.o., 5 males) were scanned at a 7T whole-body MR scanner (Magnetom, Siemens Healthcare, Erlangen) utilizing a 32-channel receive-array Nova coil. Functional MRSI data were obtained via the FID-MRSI sequence with 3D k-space ellipsoid encoding using concentric ring trajectories (CRT) and variable temporal interleaves 36x36x27 matrix and 5x5x4.8 mm3 effective voxel size. The FOV was set to 180x180x130 cm to minimize acquisition time (3 min) and lipid contamination. A slab of 4cm was excited in order to cover the bilateral primary sensorimotor cortex (SM) and supplementary motor area (SMA). Rapid WET water suppression and a short acquisition window allowed a short TR of 280 ms. Four MRSI datasets were acquired during 4 blocks (each ~4 min. long) of finger tapping task (FT) (STIM-REST-STIM-REST). During the first minute of the STIM/REST blocks Autoalign localizer was acquired prior to MRSI data acquisition to assure consistent position of the acquired volume. Off-line MRSI data post-processing and reconstruction were described previously.4,5 Spectra were quantified via LCmodel. Concentrations were assessed as ratios to total creatine (tCr). Functional MRI data were additionally acquired during a short (4 min.) FT experiment (4x 30s STIM/30s REST). Thresholded parametric BOLD-fMRI maps were used as masks (Fig. 1) to extract metabolite concentrations from MRSI maps (right and left SM, SMA). The metabolite concentrations were compared between STIM and REST with standard paired t-test.Results
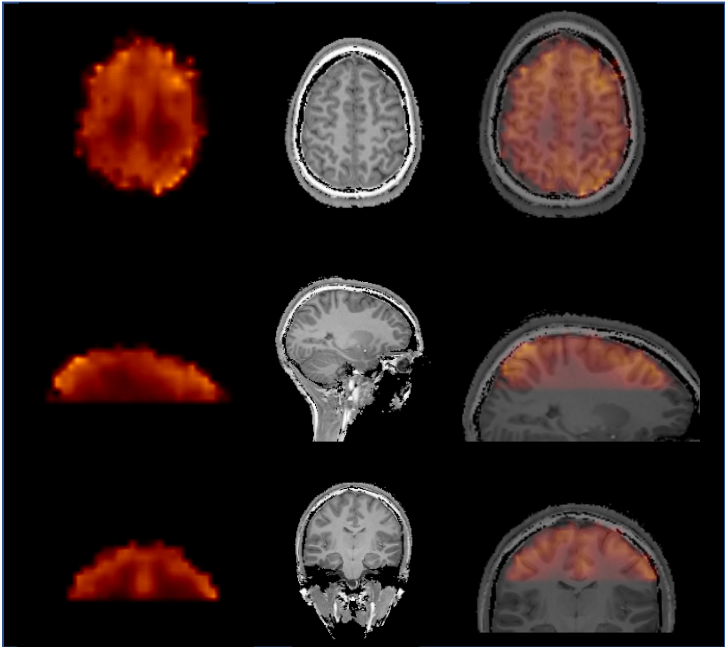
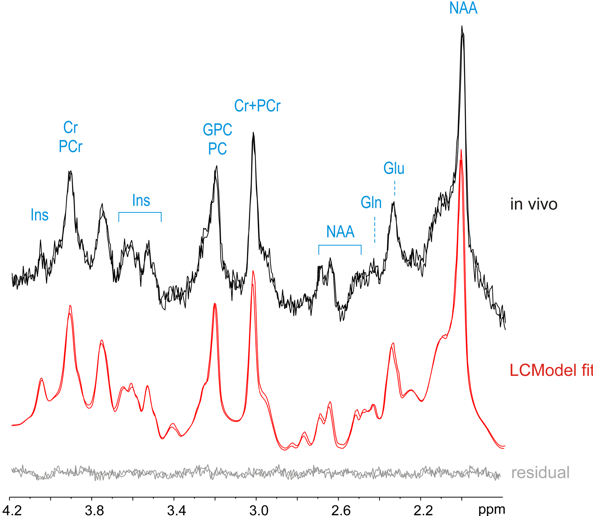
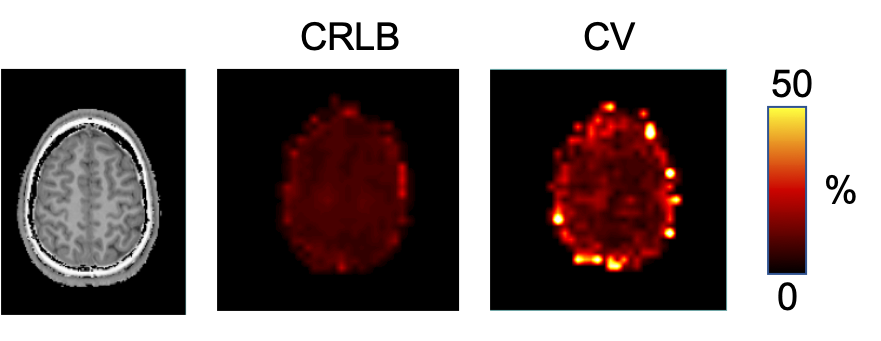
An example of high-quality Glx map is shown in Fig. 2. Reproducible spectral quality is demonstrated in Fig. 3. The CRLBs were consistently below 5 % for Glx (and for Glu) in the regions of interest. An example of the CRLB distribution is shown in Fig. 4. The CVs (SD/mean) were calculated from REST periods to avoid their fluctuations due to the task effect. The CVs were below 10% in most of the brain regions (the SM and SMA in particular). [Glx/tCr] increased by 8.2%±7.6% during STIM in the left SM cortex (p = 0.03 uncorrected, Fig. 5), while we did not observe significant changes of other reliably quantified metabolites (CRLB<20%), i.e. myo-Ins/tCr, tNAA/tCr, Glu/tCr, tCho/tCr in the bilateral SM cortex and in SMA. Metabolite concentrations in voxels with CV >10% were not taken into account.Discussion
We assume that detected Glx changes reflect Glu responses, since Gln was shown to be stable during brain activation.1,2,3 Changes in [Glu] in the order of 8% are likely closer to real concentration changes of Glu than those that were measured with single-voxel methods (2-4%). The higher Glu responses could be detected by MRSI due to the minimization of partial volume effects. The variance of the Glu responses remains high and can be partially explained by variance in the BOLD-fMRI responses. The addition of motion correction could help to further decrease CVs potentially down to the level of CRLBs.6Conclusion
CRT-based 3D FID-MRSI showed sufficient sensitivity and temporal stability to detect functional changes in the dominant sensorimotor region with expected most robust metabolite responses during FT.Acknowledgements
PB was supported by a NARSAD Young Investigator Grant from the Brain and Behavior Research Foundation (Grant No. 27238) and by the European Union’s Horizon 2020 research and innovation program under the Marie Skłodowska-Curie grant agreement No 846793. AS was supported by the European Union’s Horizon 2020 research and innovation program under the Marie Skłodowska-Curie grant agreement No 794986.References
1. Bednarik P. et. al., J Cereb Blood Flow Metab, 2015, 35:601
2.
Schaller B. et al.,Neuroimage, 2014, 93:138
3. Bednarik P. et al., J Cereb Blood Flow Metab, 2018, 38:347
4. Hingerl L. et al., Investigative Radiology, 2019, [in press]
5. Hingerl L.et al., Magn Reson Med, 2018, 79:2874 6. Moser P et al., Magn Reson Med, 2019, [in press]
6. Moser P. et al., Magn Reson Med, 2019, [in press]Figures