0379
Simultaneous High-Resolution 3D MRSI and Oxygen Extraction Fraction Mapping in Acute Stroke Using SPICE1Institute for Medical Imaging Technology, School of Biomedical Engineering, Shanghai Jiao Tong University, Shanghai, China, 2Radiology Department, The Fifth People's Hospital of Shanghai, Fudan University, Shanghai, China, 3Beckman Institute for Advanced Science and Technology, University of Illinois at Urbana-Champaign, Urbana, IL, United States, 4Department of Electrical and Computer Engineering, University of Illinois at Urbana-Champaign, Urbana, IL, United States, 5Neurology Department, The Fifth People's Hospital of Shanghai, Fudan University, Shanghai, China, 6Shanghai Minhang Hospital of Integrated Traditional Chinese and Western Medicine Hospital, Shanghai, China, 7Department of Biomedical Engineering, Case Western Reserve University, Cleveland, OH, United States
Synopsis
Mapping the concurrent changes in oxygen extraction fraction (OEF) and neurometabolic markers could provide a powerful tool for evaluation of brain tissue viability after stroke. In this work, we investigated the feasibility of fast simultaneous 3D brain OEF and neurometabolic imaging noninvasively in acute ischemic stroke using SPICE. We achieved concurrent mapping of OEF (1.2×1.2×1.2 mm3 nominal resolution) and MRSI (2.0×3.0×3.0 mm3 nominal resolution) within a 7-minute scan. Our experimental results demonstrated the feasibility of mapping OEF and neurometabolic alterations in acute stroke.
Introduction
Impaired metabolism is a hallmark in the original description of ischemic penumbra to identify tissue at risk that may benefit from intervention in acute stroke 1. Following arterial occlusion and precipitous drop in cerebral blood flow (CBF), the oxygen extraction fraction (OEF) increases concomitantly with anaerobic metabolism, which leads to lactate production 2. A series of pathologic processes including excitotoxicity, peri-infarct depolarization, oxidative stress, inflammation, and apoptosis will result in the ultimate tissue damage if blood supply is not restored in a timely fashion. Therefore, metabolic biomarkers have been recognized as important parameters to characterize the tissue at risk in acute stroke, and mapping the concurrent changes in OEF and neurometabolic markers could provide a powerful tool to evaluate tissue viability. Recently, utilizing the blood water T2 or T2* differences with deoxyhemoglobin content, a variety of MRI methods have been developed for OEF imaging 3-6. QSM-based methodology provides a contrast-free technique to measure OEF within cerebral veins 5,6. In addition to oxygen metabolism, MR can also map neurometabolism using MRSI techniques. In this study, we investigated the feasibility of rapid simultaneous 3D brain OEF and neurometabolic imaging using a recently developed high-resolution MRSI technique known as SPICE (SPectroscopic Imaging by exploiting spatiospectral CorrElation) 7-9. We performed concurrent whole brain venous OEF imaging (at 1.2×1.2×1.2 mm3 nominal resolution) and MRSI (at 2.0×3.0×3.0 mm3 nominal resolution) in acute stroke patients using a 7-minute scan. Our results demonstrated that SPICE captured OEF and neurometabolic alterations simultaneously in acute stroke effectively.Methods
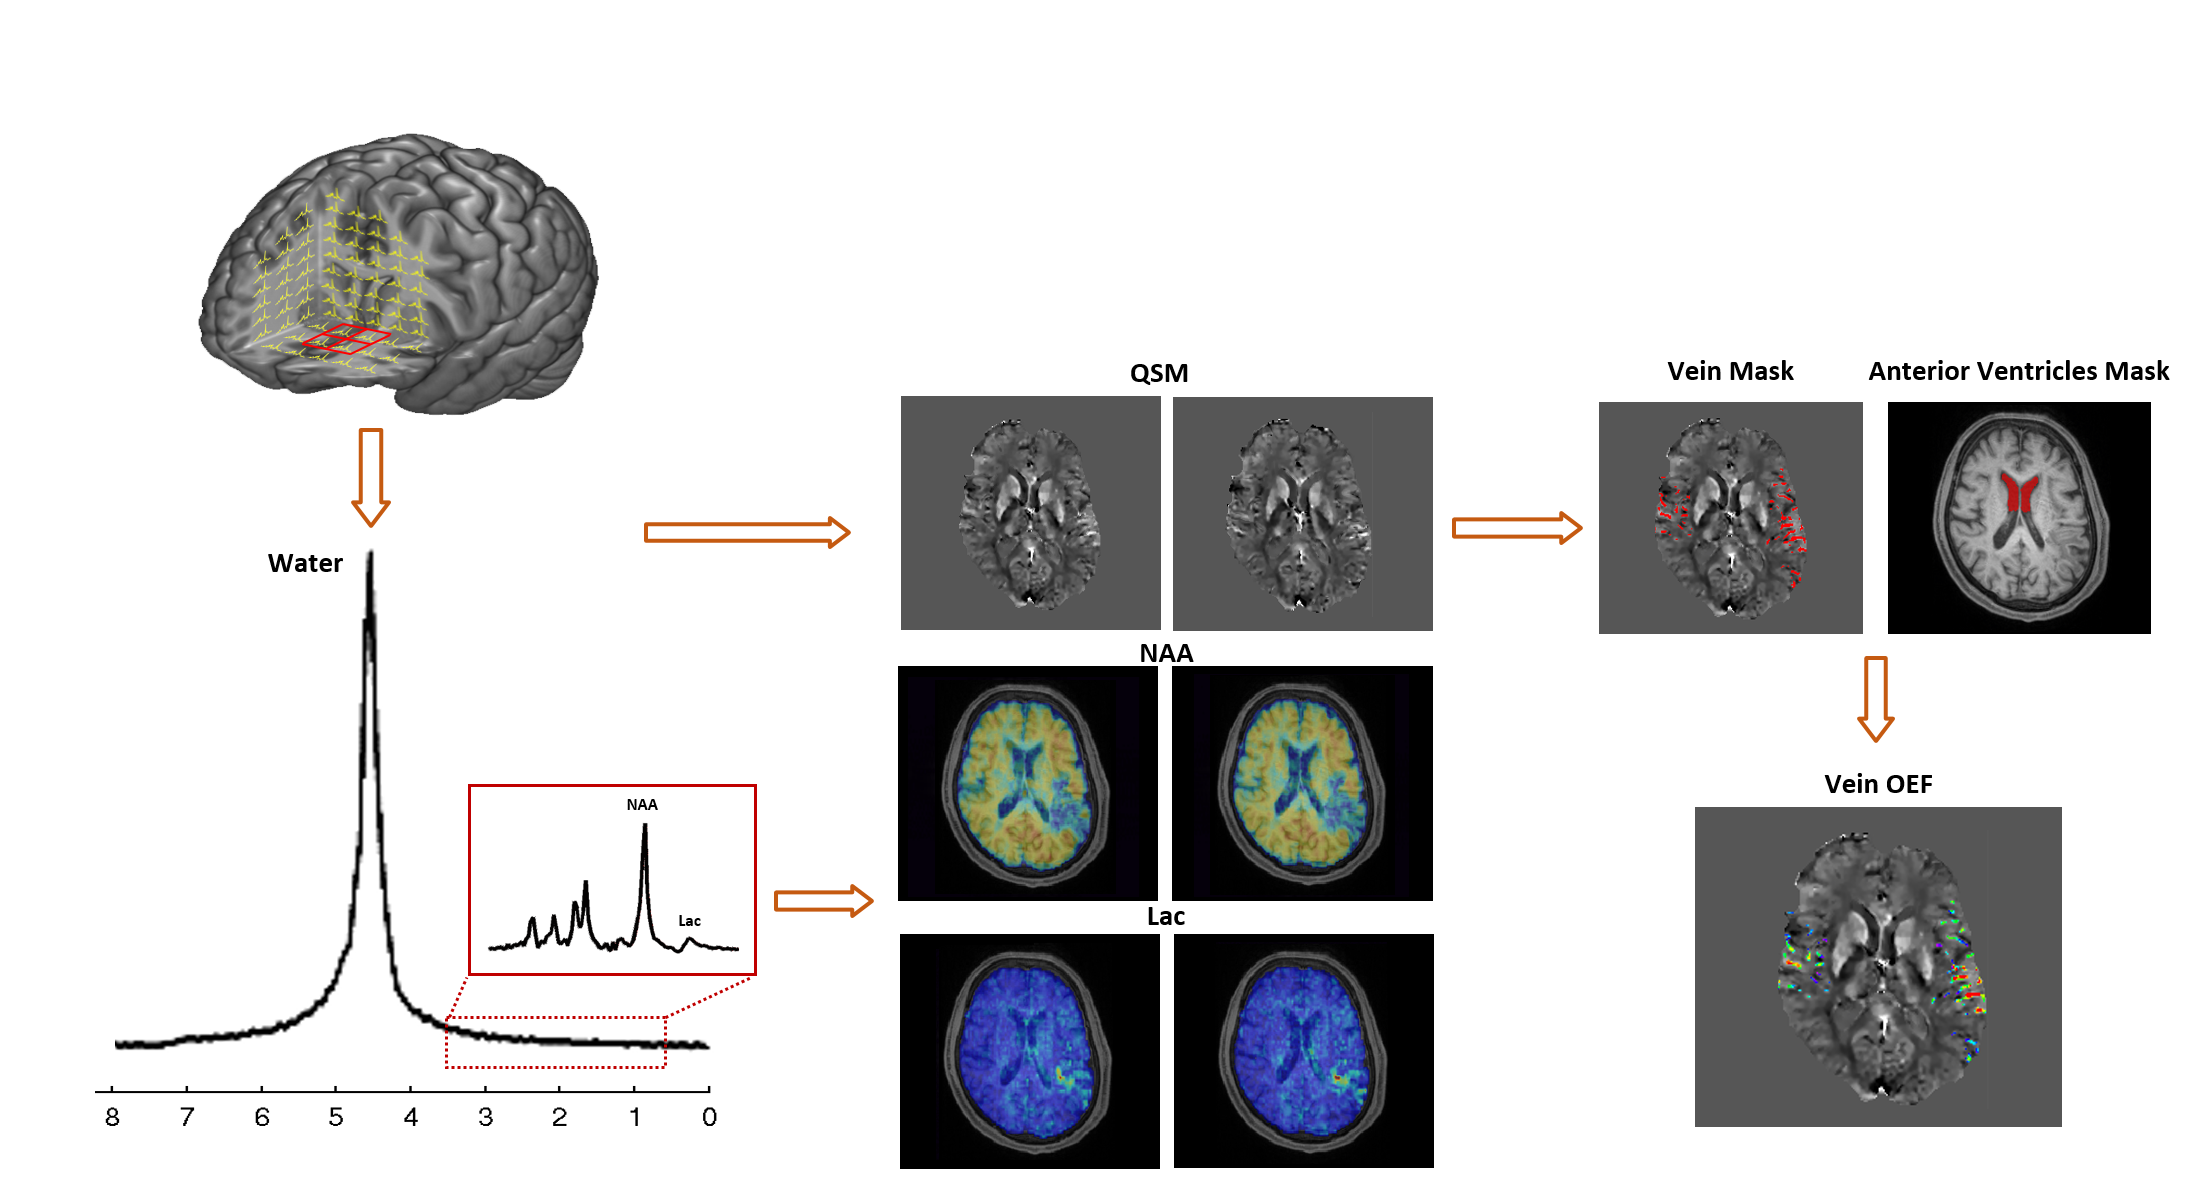
Figure 1 illustrates the proposed scheme for simultaneous OEF mapping and MRSI using SPICE. By eliminating the water suppression, SPICE is able to simultaneously acquire water and metabolic signals 7-9. With fast EPSI-based trajectory and sparse sampling of (k, t)-space, the water and metabolic signals can be collected at 1.2×1.2×1.2 mm3 and 2.0×3.0×3.0 mm3 resolution, respectively. From the metabolic signals, the spatial distributions of various molecules (including NAA and Lac) can be obtained through the reconstruction using a union-of-subspaces model, incorporating pre-learned spectral basis functions 9. From the water signal, QSM can be extracted by solving inverse dipole model 8. In this work, we further extract the OEF from QSM map. To this end, we first apply the Hessian-based filter to extract the vein masks from QSM 10. Then, the venous OEF is calculated using the following formula 5:$$\Delta\chi_{\text{vein-water}}=\text{OEF}\times\Delta\chi_{\text{do}}\times\text{Hct}+\Delta\chi_{\text{oxy-water}}\times\text{Hct}$$
where $$$\Delta\chi_{\text{vein-water}}$$$ is the susceptibility shift between venous blood (measured from the vein mask) and water (measured from the cerebrospinal fluid within the anterior region of lateral ventricles), $$$\Delta\chi_{\text{do}}$$$ = 0.27 ppm (cgs) is the susceptibility shift per unit hematocrit (Hct) between the fully oxygenated and fully deoxygenated erythrocytes 11,12, and $$$\Delta\chi_{\text{oxy-water}}$$$ = -0.03 ppm (cgs) denotes the susceptibility shift between oxygenated erythrocytes and water 13. The Hct values were acquired from clinical records (average value of 41.1±2.1%).
Seven acute stroke patients with stroke onset <24h were enrolled in the study. All the MR scans were performed on a 3.0T Siemens Skyra scanner. The experimental protocols included SPICE (1.2×1.2×1.2 mm3 for QSM, 2.0×3.0×3.0 mm3 for MRSI, FOV = 240×240×72 mm3, TR = 160 ms, TE = 1.6 ms, 7 minutes), 3D MPRAGE (1.0×1.0×1.0 mm3, FOV = 256 mm, TR = 2500 ms, TE = 2.26 ms, TI = 900 ms), diffusion-weighted imaging (DWI) (1.3×1.3×4.0 mm3, FOV = 220 mm, b = 0 and b = 1000 s/mm2, TR = 5200 ms, TE = 64 ms), and multiple post-labelling delays pseudo-continuous arterial spin labelling for CBF mapping (3.8×3.8×3.8 mm3, FOV = 240 mm, TR = 3300 ms, TE = 10.3 ms, TI = 150 ms, delays = 0.8 s, 1.0 s, 1.5 s, 2.2 s, 3.0 s). The study was approved by the Institutional Review Board of the Fifth People’s Hospital of Shanghai, China.
Results and Discussion
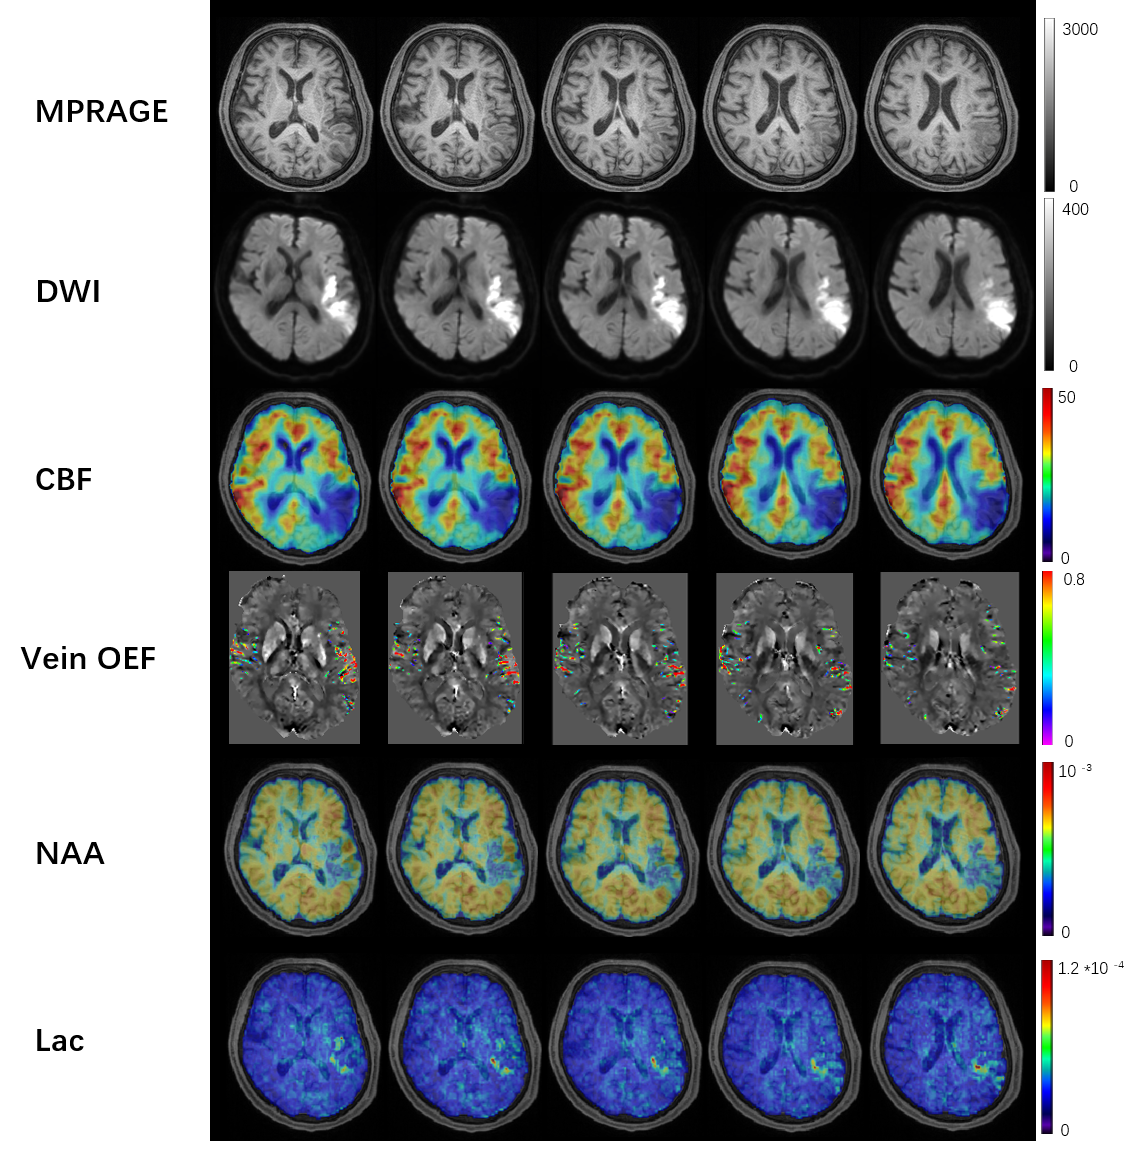
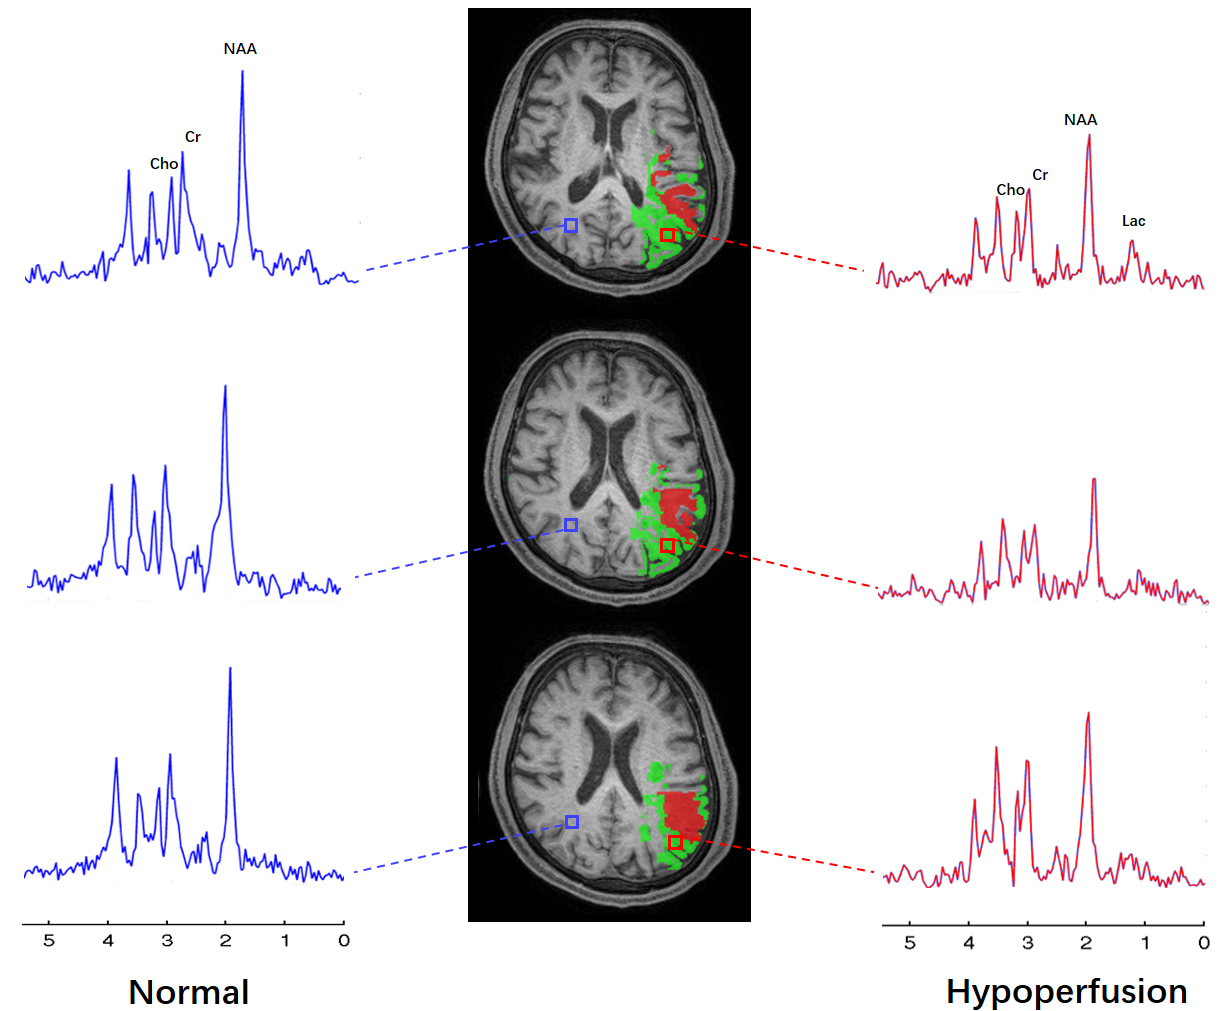
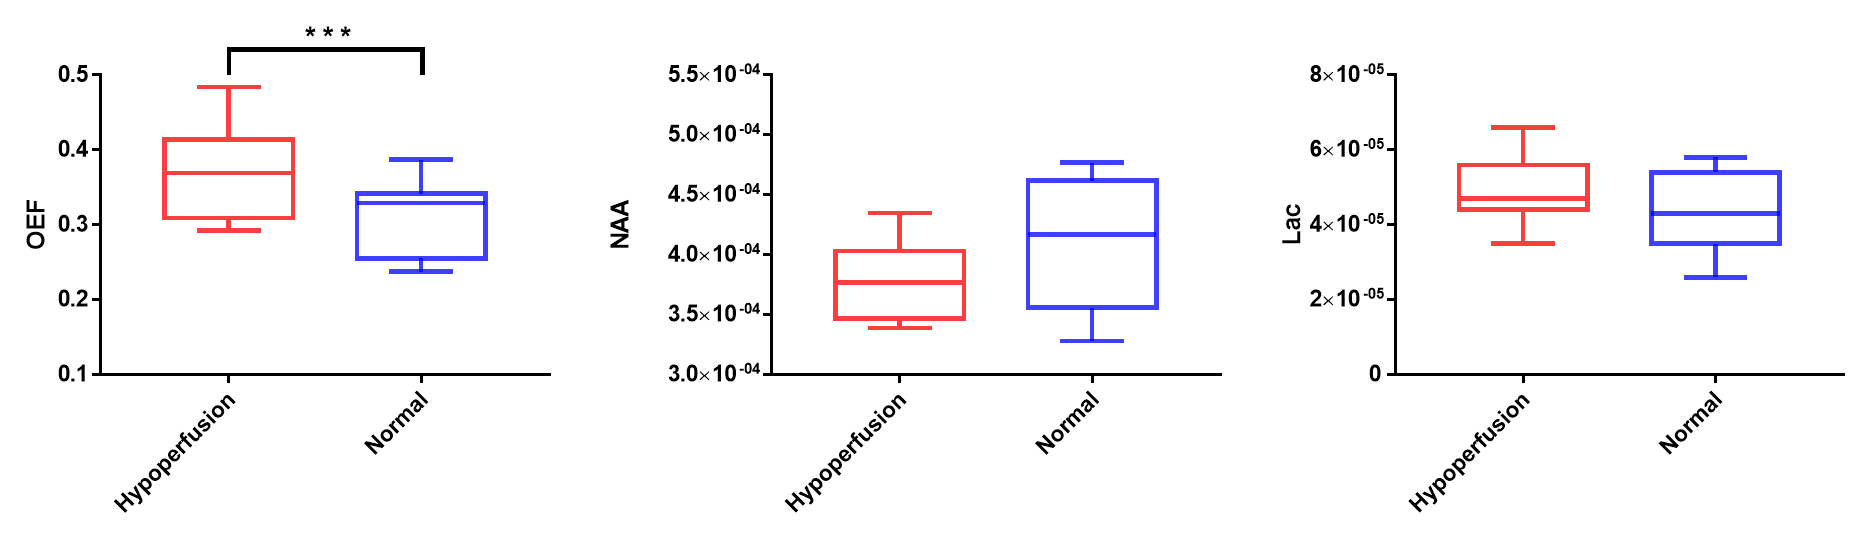
Figure 2 shows a set of representative results from an acute stroke patient using SPICE, including the simultaneously obtained OEF map, NAA map and Lac map. From the OEF map, we can observe that OEF increased in the hypoperfusion region compared to the contralateral region. From the metabolic maps, Lac increased and NAA decreased in the ipsilateral hemisphere, which can also be observed in the spatially resolved spectra displayed in Fig. 3. The group comparison involving all the seven subjects is shown in Fig. 4. As seen from the result, the OEF increased significantly in the hypoperfusion region compared to the contralateral region (p=0.0006). A reduction of NAA and an increase of Lac were observed in the hypoperfusion region but the significant level was not reached due to the limited sample size. The findings are consistent with the literature 6.Conclusions
This study successfully demonstrated the feasibility of rapid simultaneous high-resolution brain 3D MRSI and OEF imaging in acute stroke using SPICE. Our experimental results may lay a foundation for further investigation of tissue viability in acute stroke using noninvasive multimodal high-resolution metabolic imaging. Quantification of multiple metabolic parameters enabled by SPICE may provide more accurate delineation of penumbra tissue for improved treatment outcomes.Acknowledgements
This work is supported by National Science Foundation of China (No.61671292 and 81871083).References
1. Astrup J, Siesjö BK and Symon L. Thresholds in cerebral ischemia-the ischemic penumbra. Stroke. 1981;12(6):723-725.
2. Dani KA and Warach S. Metabolic imaging of ischemic stroke: the present and future. Am J Neuroradiol. 2014;35(6):S37-S43.
3. Davis TL, Kwong KK, Weisskoff RM, et al. Calibrated functional MRI: mapping the dynamics of oxidative metabolism. Proc Natl Acad Sci. 1998;95(4):1834-1839.
4. He X and Yablonskiy DA. Quantitative BOLD: mapping of human cerebral deoxygenated blood volume and oxygen extraction fraction: default state. Magn Reson Med. 2007;57:115-126.
5. Fan AP, Bilgic B, Gagnon L, et al. Quantitative oxygenation venography from MRI phase. Magn Reson Med. 2014;72:149-159.
6. Fan AP, Khalil AA, Fiebach JB, et al. Elevated brain oxygen extraction fraction measured by MRI susceptibility relates to perfusion status in acute ischemic stroke. J Cereb Blood Flow Metab. 2019:0271678X19827944.
7. Fan L, Ma C, Clifford B, et al. High‐resolution 1H‐MRSI of the brain using SPICE: data acquisition and image reconstruction. Magn Reson Med. 2016;76:1059-1070.
8. Peng X, Lam F, Li Y, et al. Simultaneous QSM and metabolic imaging of the brain using SPICE. Magn Reson Med. 2018;79:13-21.
9. Li Y, Lam F, Clifford B, et al. A Subspace Approach to Spectral Quantification for MR Spectroscopic Imaging. IEEE Trans Biomed Eng. 2017;64:2486-2489.
10. Frangi AF, Niessen WJ, Vincken KL, et al. Multiscale vessel enhancement filtering. Med Image Comput Comput Assist Interv, Springer, Berlin, Heidelberg. 1998:130-137.
11. Langham MC, Magland JF, Epstein CL, et al. Accuracy and precision of MR blood oximetry based on the long paramagnetic cylinder approximation of large vessels. Magn Reson Med. 2009;62:333-340.
12. Jain V, Langham MC and Wehrli FW. MRI estimation of global brain oxygen consumption rate. J Cereb Blood Flow Metab. 2010;30:1598-1607.
13. Weisskoff RM and Kiihne S. MRI susceptometry: image-based measurement of absolute susceptibility of MR contrast agents and human blood. Magn Reson Med. 1992;24:375-383.
14. Leigh R, Knutsson L, Zhou J, et al. Imaging the physiological evolution of the ischemic penumbra in acute ischemic stroke. J Cereb Blood Flow Metab. 2018;38(9):1500-1516.
Figures