0378
Diffusion of brain metabolites highlights altered brain microstructure in chronic hepatic encephalopathy1Centre d'Imagerie Biomedicale, École Polytechnique Fédérale de Lausanne, Lausanne, Switzerland, 2Laboratory for functional and metabolic imaging, École Polytechnique Fédérale de Lausanne, Lausanne, Switzerland, 3Service of Clinical Chemistry, University of Lausanne and University Hospital of Lausanne, Lausanne, Switzerland, 4Biological Electron Microscopy Facility, École Polytechnique Fédérale de Lausanne, Lausanne, Switzerland
Synopsis
In chronic hepatic encephalopathy (HE), high ammonium delivery to the brain is causing the accumulation of glutamine (Gln) and gradual release of other osmolytes. We aimed to follow the longitudinal evolution of brain Gln and other metabolite properties in chronic-HE using diffusion-weighted spectroscopy (DW-MRS) and evaluate the potential changes in diffusion behavior which might provide information on Gln localization and potential microstructural alterations during chronic-HE. Increased diffusivity and reduced kurtosis in BDL rats, showcased by DW-MRS analysis, are fully consistent with a less complex microstructure and swollen soma as highlighted by fluorescence and electron microscopy leading to increased molecule mobility.
Introduction
In chronic hepatic encephalopathy (HE), increased brain ammonium is causing the accumulation of glutamine (Gln) and gradual release of osmolytes (myo-Inositol (Ins), taurine (Tau), total choline (tCho)) as osmotic response1. In spite of this apparent osmoregulation, an increase in water apparent diffusion coefficient (ADC) has been sometimes observed in patients with chronic HE and has been associated with edema2. Gln synthesis in the central nervous system is largely confined to astrocytes3. So far the effects of Gln accumulation on astrocytes morphology together with the molecular mechanisms behind these changes in chronic-HE are unknown. In addition, the exact biochemical changes that generate the accumulation of Gln also remain only partially understood. It might be due to an increase in glutamine synthetase activity, a decrease in Gln transfer to neurons or a decrease in glutamine efflux from brain tissue, or any combination of these processes. Understanding the mechanisms and the direct effects behind Gln accumulation by non-invasive means could inform whether Gln lowering strategies would be useful for improving cognitive impairment in chronic-HE. The aim of our study was to follow the longitudinal evolution of brain Gln and other metabolites in chronic-HE using diffusion-weighted spectroscopy (DW-MRS) and evaluate the potential changes in diffusion behavior which might provide information on Gln localization and potential microstructural alterations during chronic-HE.Methods
All experiments were performed on a 9.4T/26cm horizontal magnet using a home-built 1H quadrature transceiver. Adult male Wistar rats where bile duct ligated (BDL) to induce chronic-HE1. Animals were scanned before surgery (n=5) and at 6-weeks post-BDL (n=5) under isoflurane anesthesia (~1.5%). First an 1H-MRS scan was performed in the hippocampus (2x2.8x2mm3) using the SPECIAL sequence (TE=2.8ms, TR=4s, 160averages) to measure the neurometabolism. Then, DW-MRS data were acquired using localized STEAM-based spectroscopic pulse sequence4 (TE/TM=15/112ms) in a voxel of 245μl. Diffusion gradients were applied simultaneously along three orthogonal directions (δ=6 ms, Δ=120 ms). A total of ten b-values (ms/μm2) with the following number of repetitions were acquired: 0.4(160), 1.5(160), 3.4(160), 6.0(160), 7.6(160), 13.4(320), 15.7(480), 20.8(480), 25.2(480) and 33.3(480).Spectra were corrected for phase and frequency drift and averaged. Metabolite signals were quantified using LCModel with an appropriate basis-set. Metabolites signal decays were then fitted using three different approaches. First, Callaghan’s model of randomly oriented sticks (neurites or processes) with metabolite diffusivity Din along the neurite/process5:
$$\frac{S}{S_{0}}=\sqrt{\frac{\pi}{4bD_{in}}}erf\left(\sqrt{bD_{in}}\right)\quad(1)$$
Second, a model of randomly oriented cylinders (neurites or processes) of radius r and diffusivity Din, using van Gelderen’s formula6:
$$\frac{S}{S_{0}}=\frac{1}{\pi}\int_{0}^{\pi}S_{vG}\left(\theta,g,\delta,\Delta;r,D_{in}\right)\cdot e^{-bD_{in}\cos^2\theta}d\theta \quad(2)$$
Lastly, the cumulant expansion:
$$ -\ln\frac{S}{S_{0}}=-bD+\frac{1}{6}\left(bD\right)^2K \quad(3)$$
yielding the apparent diffusion coefficient D and kurtosis K7. Assuming an underlying isotropic distribution of sticks (Callaghan’s model), the radius of convergence of the cumulant expansion is given by the first zero of the error function in the complex plane, whereby, assuming a diffusivity of about 0.3 μm2/ms, bc = 19 ms/μm2. b-values up to bc were used for this fit.
GFAP (glia-specific intermediate filament protein) and DAPI (nucleus) were used together with morphometric Sholl-analysis. For the cytoarchitecture of the hippocampus and detailed neuronal morphology the Golgi-Cox staining (metallic impregnation of neurons) was applied.To study morphological alterations at sub-cellular level electron microscopy was also performed.
Results
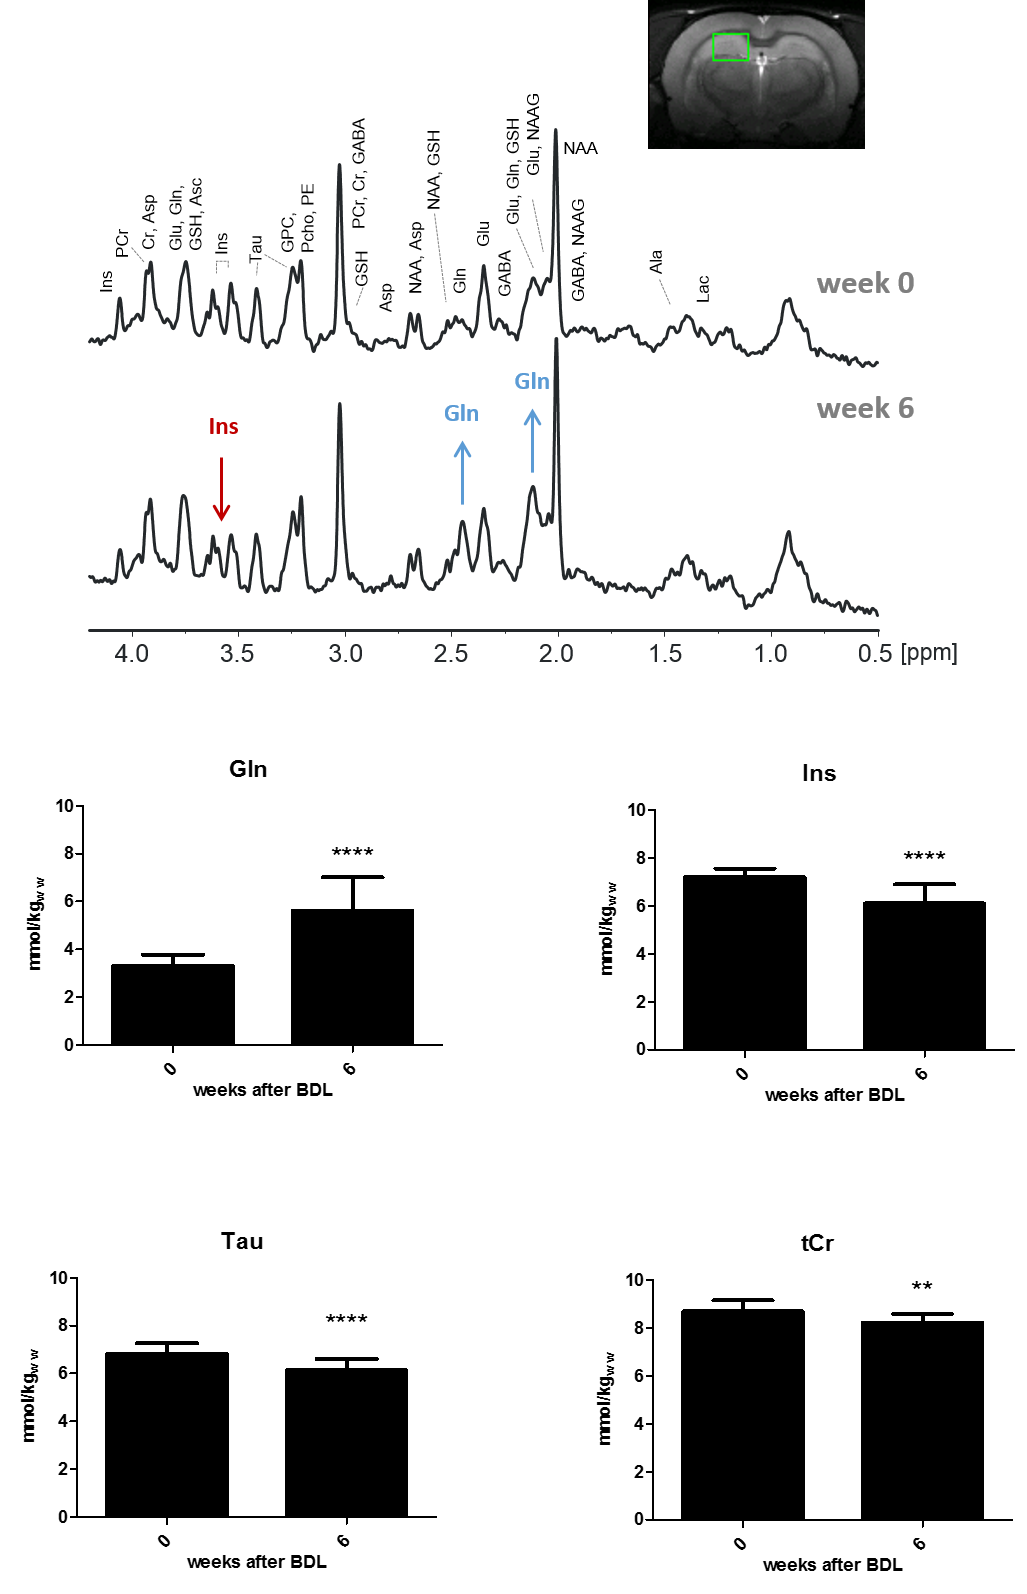
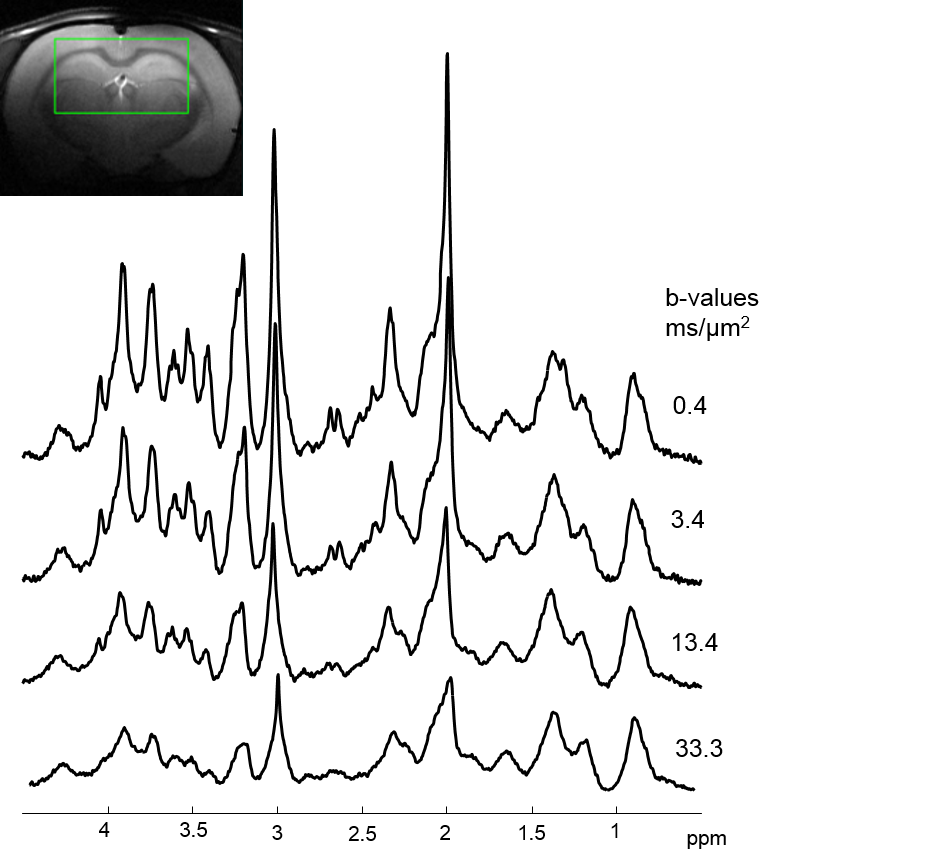
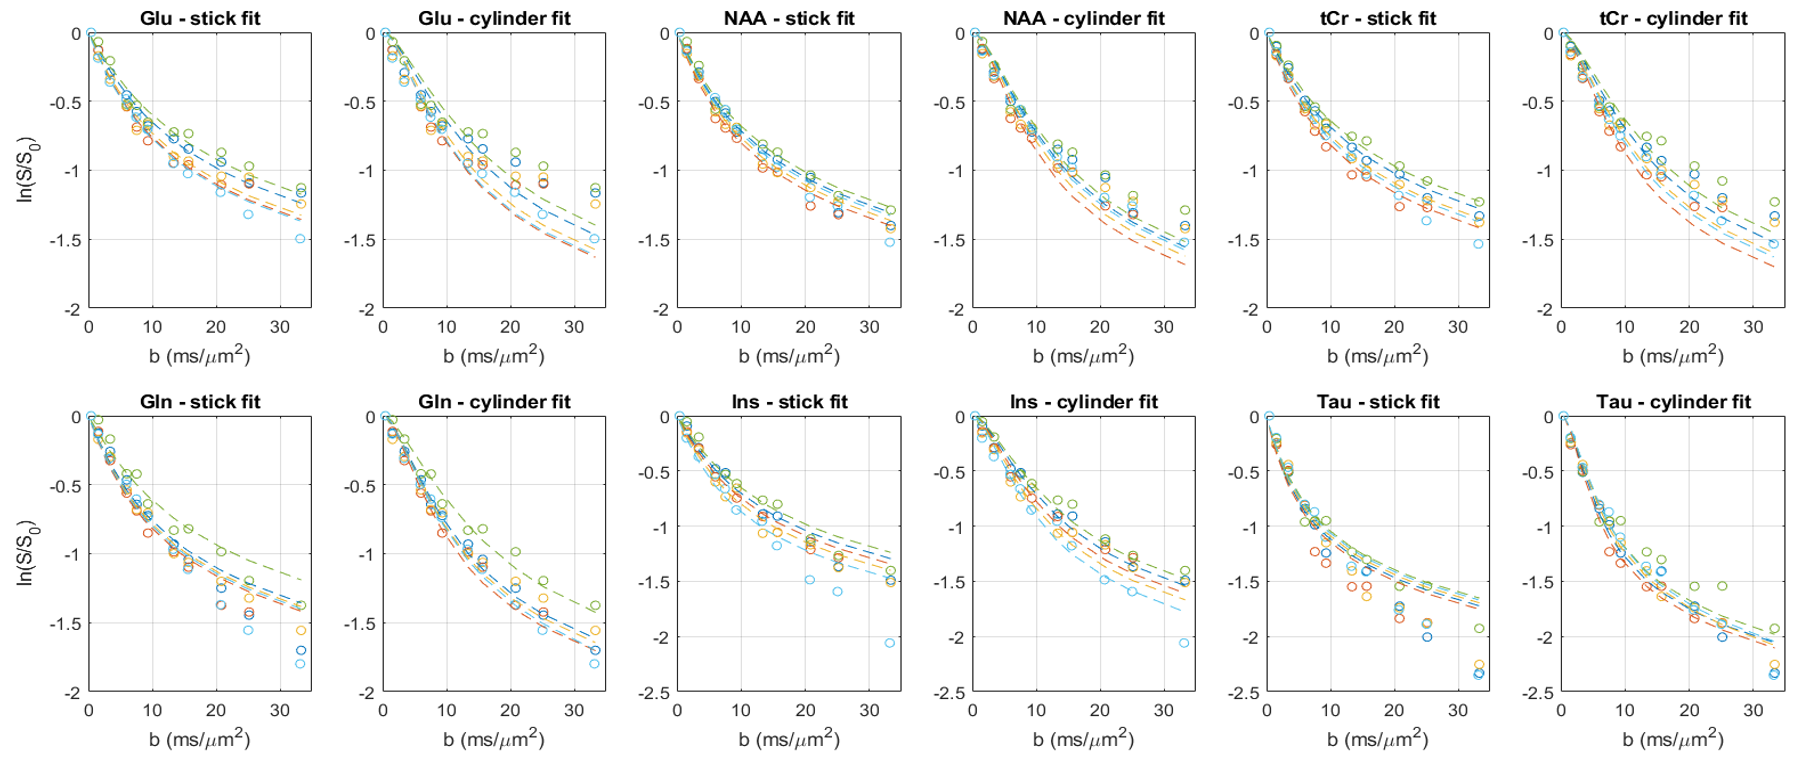
The characteristic pattern of chronic-HE, gradual increase of Gln as a result of ammonia detoxification1 and decrease in main organic osmolytes as an osmoregulatory response is shown in Fig.1. The quality of the resulting spectra presented in Fig.2 allowed the estimation of diffusion parameters of glutamine (Gln), glutamate (Glu), N-acetylaspartate (NAA), myo-inositol (Ins), taurine (Tau) and total creatine (tCr: Cr+PCr) at both time points.The b-value range was overall insufficient to reliably estimate cylinder radius using van Gelderen’s model, particularly for neuronal metabolites. Indeed, the stick model fit the data better than the cylinder model for Glu, NAA and tCr (Fig.3). On the contrary, the cylinder model fit the data better for Gln, Ins (largely astrocytic) and Tau (ubiquitous) and yielded a radius estimate of 1.5–2μm.
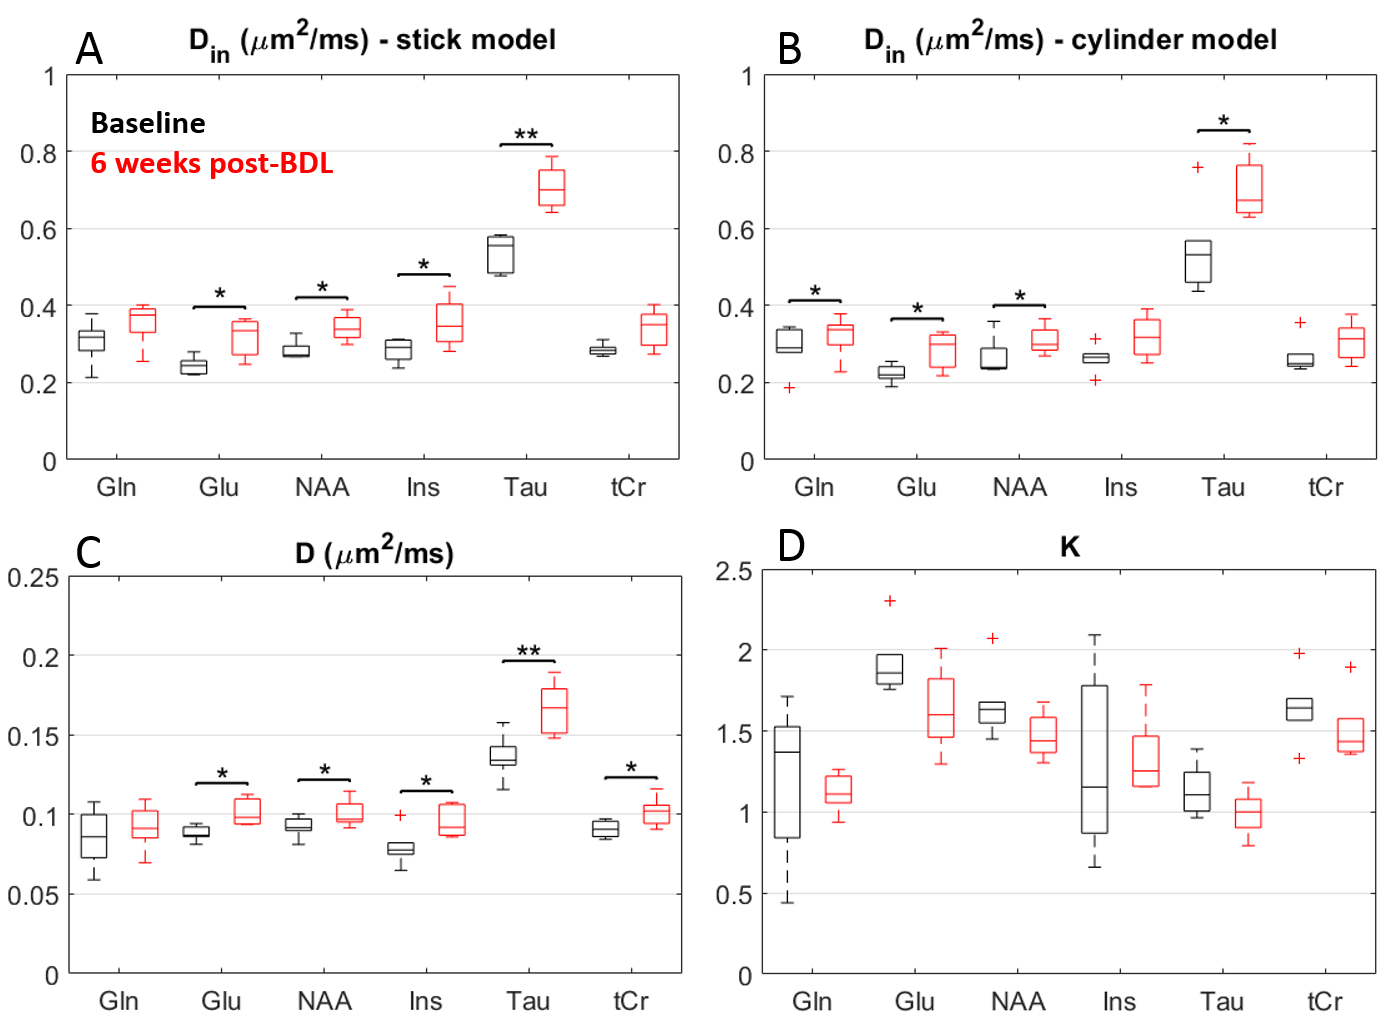
The derived diffusivity parameters before-surgery (Fig.4) were in good agreement with results in the healthy rodent brain8. Six weeks after surgery, an increase in intra-neurite/process diffusivity Din was measured for all metabolites, as estimated from both the stick and cylinder models (Fig.4A-B). The cumulant expansion fit also suggested an increase in apparent diffusion coefficient and decrease in kurtosis for all metabolites (Fig.4C-D).
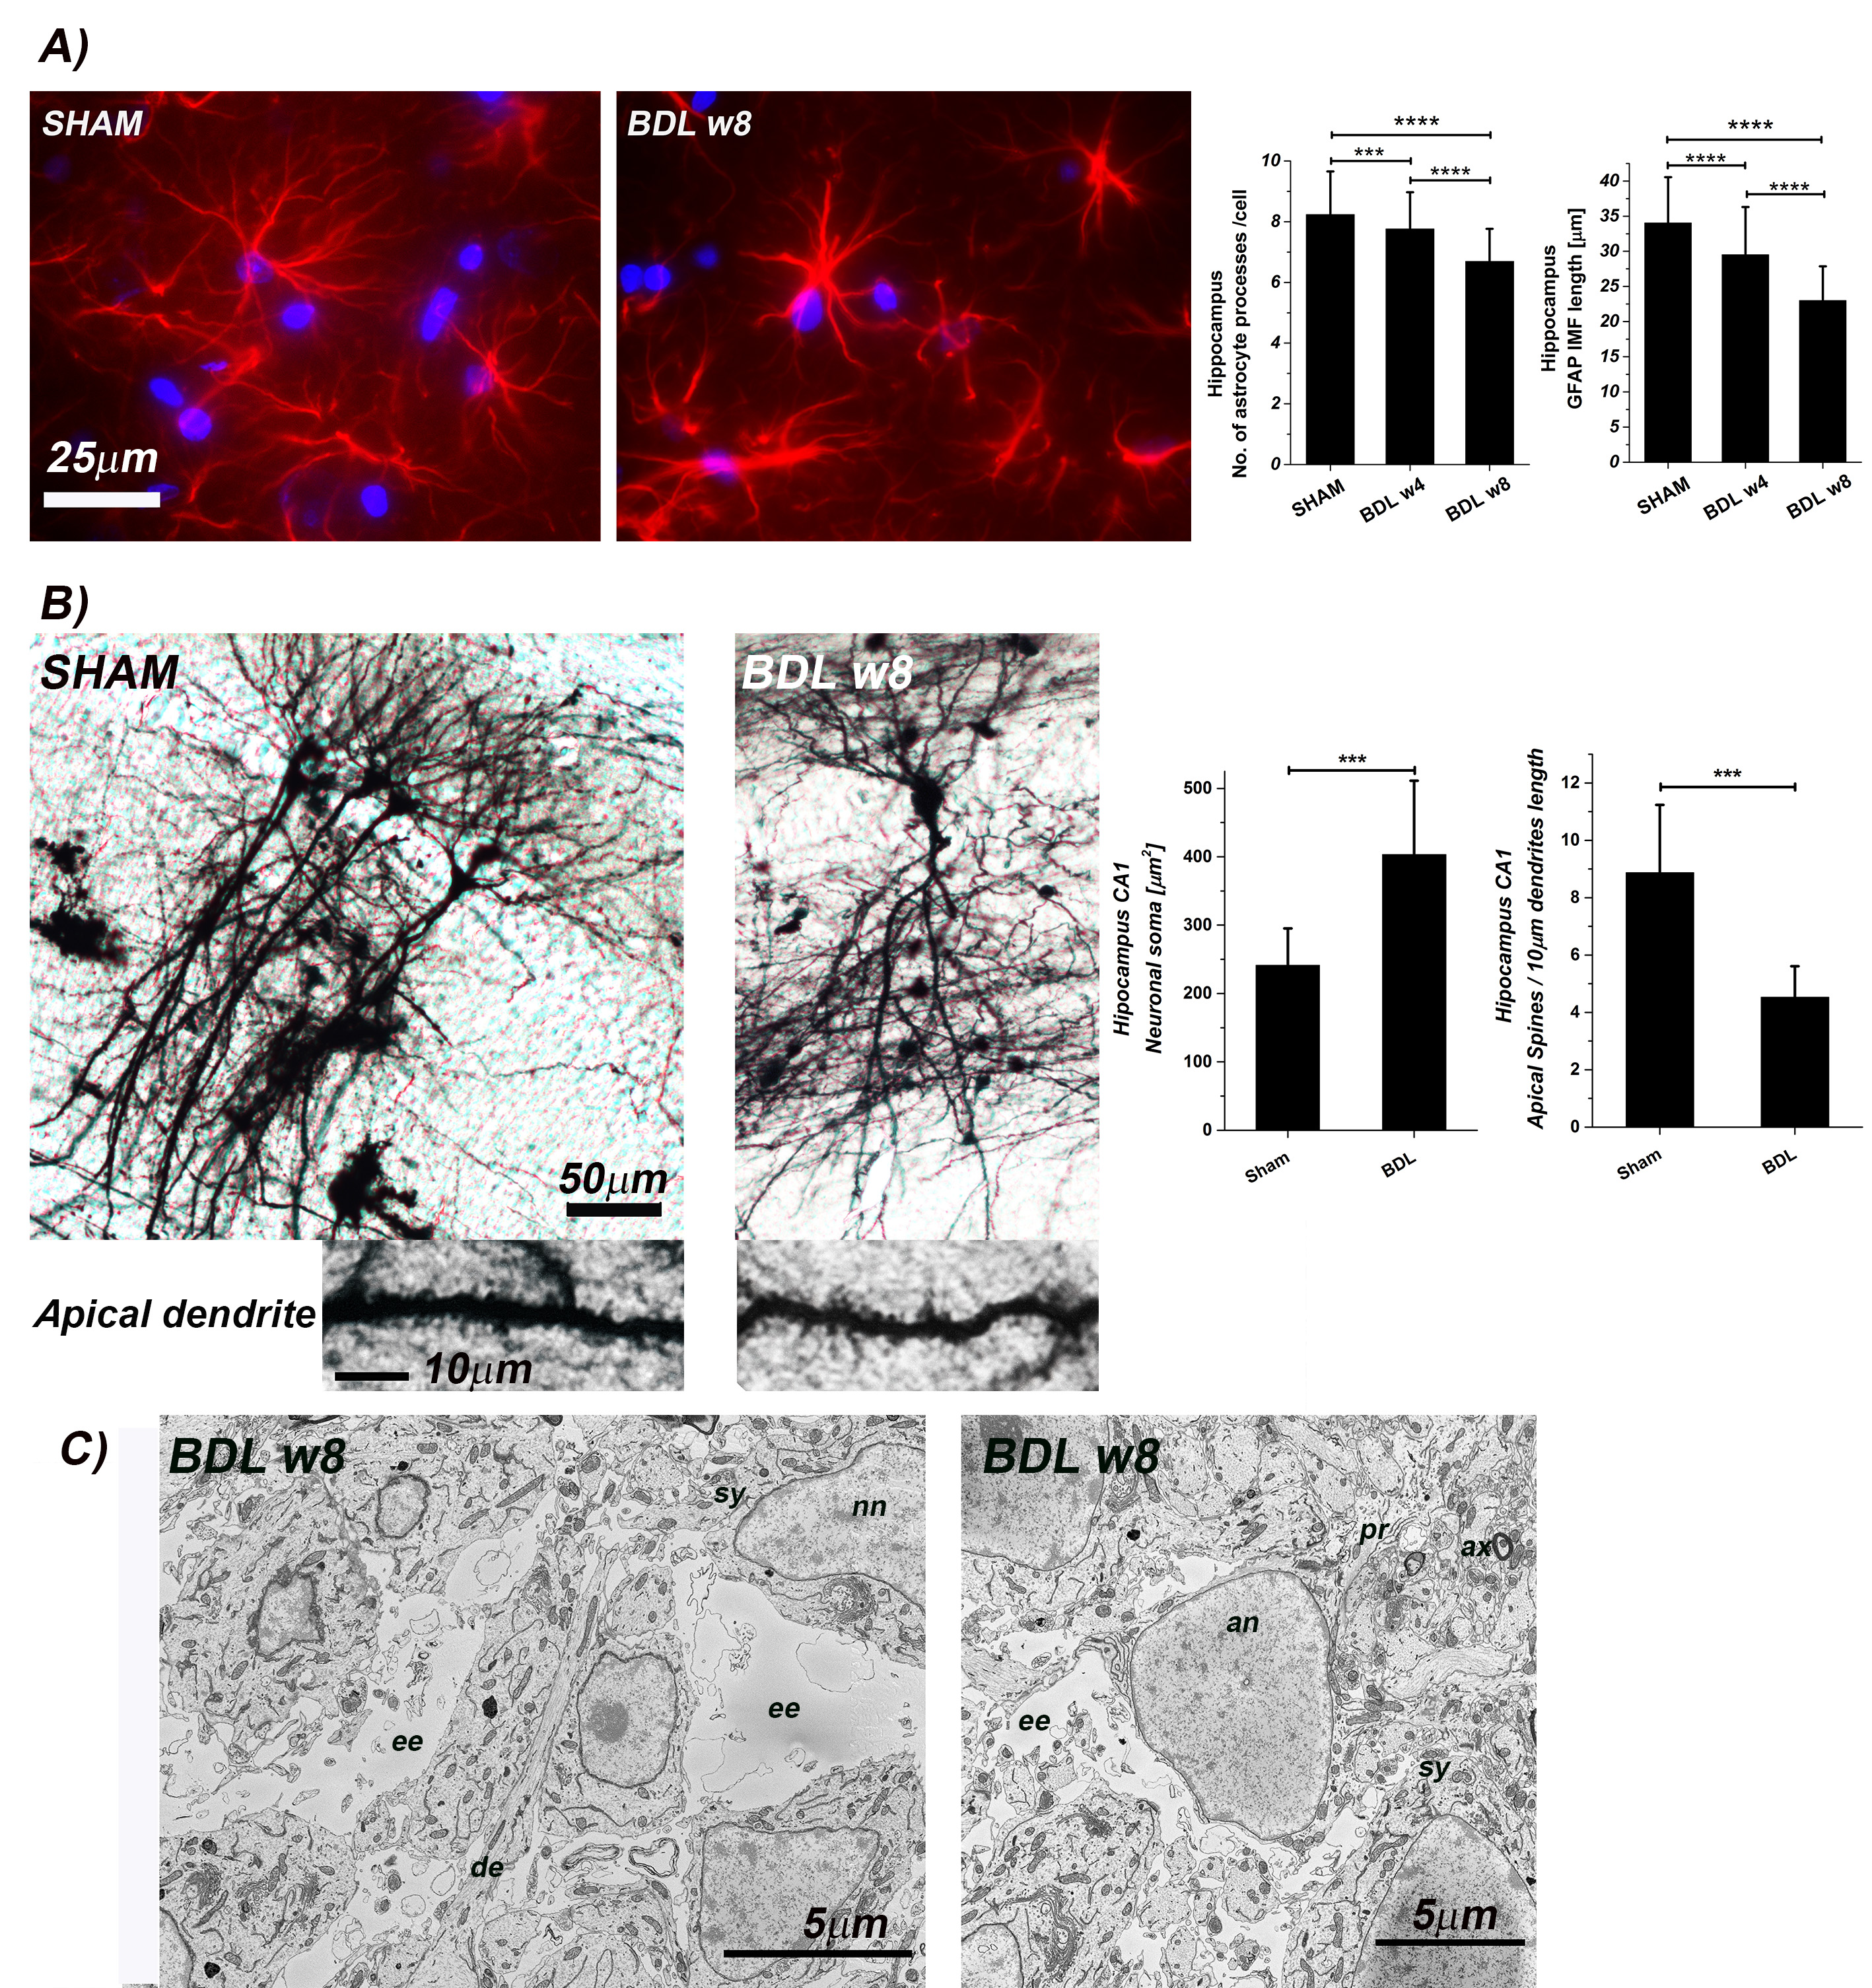
GFAP staining showed significant alterations in astrocytes count and important morphological changes (Fig.5) suggesting an astrocytic activation and synaptic depression induction. In addition, Golgi-Cox staining showed a significant increase in CA1 and DG neuronal soma surface and a significant loss of dendritic spines density in CA1 and DG in hippocampal neurons (Fig.5). Finally, electron micrograph of the BDL rat hippocampus demonstrated the enlarged extracellular space (Fig.5).
Increased diffusivity and reduced kurtosis in BDL rats, showcased by DW-MRS analysis, are fully consistent with a less complex microstructure and swollen soma as highlighted by fluorescence and electron microscopy leading to increased molecule mobility. An increased membrane permeability in BDL rats would also contribute to reduced compartmentalization of metabolites and faster diffusion.
Overall these results show that HE leads to profound microstructural alterations of both neurons and astrocytes, which can be probed in vivo using DW-MRS
Acknowledgements
Supported by CIBM of the UNIL, UNIGE, HUG, CHUV, EPFL, the Leenaards and Jeantet Foundations and the SNSF project no 310030_173222/1.
The authors thank Stefanita Mitrea (CIBM) and Dario Sessa (HUG) for their help during BDL surgery, animal follow-up, sample collection and assistance with histology; and
Dubois Anaëlle Fabienne from Biological Electron Microscopy Facility, EPFL.
References
1 Braissant O, Rackayová V, Pierzchala K, Grosse J, McLin VA, Cudalbu C. Longitudinal neurometabolic changes in the hippocampus of a rat model of chronic hepatic encephalopathy. J Hepatol. 2019 Sep;71(3):505-515
2 Cudalbu C, Taylor-Robinson SD. Brain Edema in Chronic Hepatic Encephalopathy. J Clin Exp Hepatol. 2019 May-Jun;9(3):362-382.
3 Norenberg MD. Distribution of glutamine synthetase in the rat central nervous system. J Histochem Cytochem 1979;27:756–762.
4 N. Kunz, C. Cudalbu, V. Mlynarik, P. S. Huppi, S. V. Sizonenko,and R. Gruetter, Diffusion-Weighted Spectroscopy: A Novel Approach to Determine Macromolecule Resonances in Short-Echo Time 1H-MRS, Magnetic Resonance in Medicine 2010; 64:939–946
5 P.T. Callaghan, K.W. Jolley, J. Lelievre. Diffusion of water in the endosperm tissue of wheat grains as studied by pulsed field gradient nuclear magnetic resonance, Biophysical journal, 28 (1979) 133-141.
6 P. Vangelderen, D. Despres, P.C.M. Vanzijl, C.T.W. Moonen. Evaluation of Restricted Diffusion in Cylinders. Phosphocreatine in Rabbit Leg Muscle, Journal of Magnetic Resonance, Series B, 103 (1994) 255-260.
7 J.H. Jensen, J.A. Helpern. MRI quantification of non-Gaussian water diffusion by kurtosis analysis, NMR in biomedicine, 23 (2010) 698-710.
8 M. Palombo, C. Ligneul, J. Valette. Modeling diffusion of intracellular metabolites in the mouse brain up to very high diffusion-weighting: Diffusion in long fibers (almost) accounts for non-monoexponential attenuation, Magnetic Resonance in Medicine, 77 (2017) 343-350.
Figures