0377
In vivo 2D COSY reveals metabolic and lipid variations between low and high BI RADS density breasts in an average breast cancer risk cohort of 65 women1Translational Research Institute, Brisbane, Australia, 2Queensland University of Technology, Brisbane, Australia, 3Princess Alexandra Hospital, Brisbane, Australia
Synopsis
Breast density is a strong risk factor for breast cancer with a four to six fold increase for those in BI-RADS high density group versus low density group. The current study acquired MRI and MRS in 65 women at average lifetime risk of developing breast cancer, and found statistically significant differences in various MR-visible lipids and metabolites as well as cholesterol between low and high breast density groups. Results implicate that increased metabolic activity underlies increased mammographic breast density. 2D COSY offers a non-invasive window into breast tissue chemistry, without the use of gadolinium-based contrast media.
Introduction
Mammographic breast density is an established risk factor for breast cancer1-5,7,8, with an estimated two to six fold increase in incidence in the dense breast cohort1-3. Understanding how breast tissue chemistry differs according to breast density is an emerging area of research. The current study used in vivo two-dimensional correlated spectroscopy (2D COSY) to explore variations in the breast tissue chemistry of a cohort of women at an average clinical risk of breast cancer, depending on their breast density. It is hypothesised that chemical differences exist depending on the amount of fatty vs fibroglandular tissue, and that this can be measured using 2D COSY.Materials and Methods
Data from 65 women with a National Institute for Health and Care Excellence (NICE)9 risk rating of 'low' and with no personal history of breast disease were collected between October 2017 and August 2019 following non-contrast MRI and 2D COSY magnetic resonance spectroscopy (MRS). A low NICE score is assigned to a person with nil or one first degree relative who developed breast cancer above age forty, and is deemed at average population risk of around twelve percent. All gave informed consent, with Institutional Review Board approval. Fourty-six women had no family history of breast cancer and nineteen had one first-degree relative who developed breast cancer. Age, body mass index (BMI), age at menarche, parity, age at first birth, hormonal exposure, menopausal status, length of menopause cancer were recorded. Individual and familial BRCA1 and/or BRCA2 status, age of familial breast cancer, and whether disease was unilateral or bilateral was also recorded. Two radiologists with ten and twenty years’ MRI reporting experience determined BI-RADS (Breast Imaging and Reporting System of the American College of Radiolgy)10 breast density. In addition to the NICE score, an IBIS lifetime risk of developing breast cancer was also calculated for each participant using the above demographic and familial data (using the Tyrer-Kuzick Model (IBIS Tool)11. MRI and MRS data were collected between day six and fourteen of the menstrual cycle on a 3T Prisma or a 3T Skyra scanner (Siemens AG, Erlangen, Germany) using an 18-channel (Siemens) or 16-channel breast coil (RAPID Biomedical, Germany). MR sequences included diffusion-weighted imaging, T2, T1 and T1 fat-suppressed volume acquisitions, which were used to position a 20mm3 voxel medially in the left breast to include a region representative of overall breast density. A single operator positioned each voxel to ensure consistency. Acquisition parameters and processing was undertaken as previously reported12. CHI-square, Mann-Whitney and Kruskal-Wallis tests were used for statistical analysis.Results and Discussion
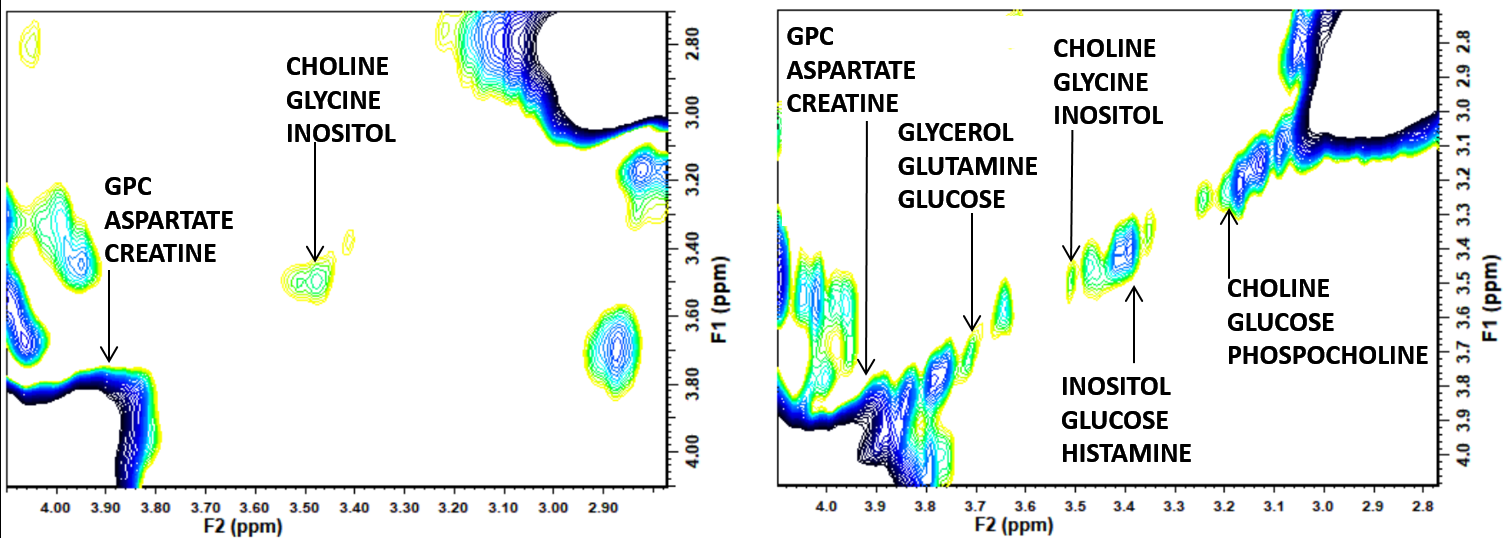
The mean age of participants was 42.40 years (SD 11.95; range 20-72) with sixty-nine percent being pre-menopausal (44/64; one participant with unknown status). BI-RADS breast density distribution was as follows: 9 of the 65 were classed as type a (mainly fatty); 25 as type b (scattered fibroglandular tissue); 21 as type c (heterogenously dense) and 10 as type d (extremely dense). Analysis was undertaken of low density (types a and b) and high density (types c and d) groups. IBIS scores were compared between low and high density groups, and there was a significant difference in the average scores. The low density group had an average IBIS score of 24.6 (range 2.7 - 17.1) and the high density group had an average score of 40.1 (range 2.7 – 33.0; p=0.001). This is likely due to the weighting that the IBIS algorithm applies depending on breast type, in combination with family history and demographic data input into the calculator. Women in the high density group were younger than those in the low density group (p=0.004). Twenty of thirty-one participants in the high density group were pre-menopausal compared to eighteen of thirty-three in the low-density group (p=0.025). BMI was significantly higher in participants in the low density group (p<0.001). Typical 2D COSY from the low density and high density group is shown in Figure 1 and 2. The chemical differences between the two cohorts are listed in Table 1. Multiple differences were measured between the two density groups, including differences in MR-visible cholesterol, triglyceride backbone and unsaturation. There was only one statistically significant difference between pre- and post-menopausal women, with a 140% increase in cross peak G detected in post-menopausal individuals (p=0.025). No spectral differences were noted between groups with and without any family history of breast cancer.Conclusion
The issue of breast tissue chemistry as it relates to breast density is an important one. Our research found that women with BI-RADS category a and b (low density breast tissue) demonstrated statistically significant differences in various spectral regions compared to those with category c and d (high density breast tissue). The differences included an increase in MR-visible metabolites, as well as MR-visible cholesterol with an increase in breast tissue density. Only one spectral difference was recorded between pre- and postmenopausal women. Various other spectral changes relating to triglyceride composition were also measured. The significance of lipid and metabolite variations between low and high breast density cohorts requires further investigation in a larger, more varied population. In vivo 2D COSY offers a non-invasive way of measuring breast tissue chemistry, without the use of Gadolinium-based contrast media.Acknowledgements
Advance
Queensland, Queensland Government; Translational Research Institute (TRI); Queensland University of
Technology (QUT); Princess Alexandra Hospital; Siemens Healthineers
References
(1) McCormack, V. A.; dos Santos Silva, I. Breast density and parenchymal patterns as markers of breast cancer risk: a meta-analysis. Cancer Epidemiology and Prevention Biomarkers 2006, 15 (6), 1159. (2) Vachon, C. M.; Van Gils, C. H.; Sellers, T. A.; Ghosh, K.; Pruthi, S.; Brandt, K. R.; Pankratz, V. S. Mammographic density, breast cancer risk and risk prediction. Breast Cancer Research 2007, 9 (6), 217. (3) Boyd, N. F.; Martin, L. J.; Yaffe, M. J.; Minkin, S. Mammographic density and breast cancer risk: current understanding and future prospects. Breast cancer research 2011, 13 (6), 223. (4) Byrne, C.; Schairer, C.; Wolfe, J.; Parekh, N.; Salane, M.; Brinton, L. A.; Hoover, R.; Haile, R. Mammographic Features and Breast Cancer Risk: Effects With Time, Age, and Menopause Status. JNCI: Journal of the National Cancer Institute 1995, 87 (21), 1622. (5) Ballard-Barbash, R.; Taplin, S. H.; Yankaskas, B. C.; Ernster, V. L.; Rosenberg, R. D.; Carney, P. A.; Barlow, W. E.; Geller, B. M.; Kerlikowske, K.; Edwards, B. K. Breast Cancer Surveillance Consortium: a national mammography screening and outcomes database. AJR. American journal of roentgenology 1997, 169 (4), 1001. (6) D’orsi, C.; Bassett, L.; Berg, W.; Feig, S.; Jackson, V.; Kopans, D. Breast imaging reporting and data system: ACR BI-RADS-mammography. American College of Radiology (ACR), Reston 2003, 230. (7) Vacek, P. M.; Geller, B. M. A prospective study of breast cancer risk using routine mammographic breast density measurements. Cancer Epidemiology and Prevention Biomarkers 2004, 13 (5), 715. (8) Boyd, N. F.; Martin, L. J.; Bronskill, M.; Yaffe, M. J.; Duric, N.; Minkin, S. Breast Tissue Composition and Susceptibility to Breast Cancer. Journal of the National Cancer Institute 2010, 102 (16), 1224. (9) Mulsow, J.; Lee, J.; Dempsey, C.; Rothwell, J.; Geraghty, J. G. Establishing a Family Risk Assessment Clinic for Breast Cancer. Breast Journal 2009, 15, S33. (10) Radiology, A. C. o. ACR BI-RADS® Atlas Fifth Edition, Quick reference. 2013. (11) Tyrer, J.; Duffy, S. W.; Cuzick, J. A breast cancer prediction model incorporating familial and personal risk factors. Statistics in medicine 2004, 23 (7), 1111. (12) Ramadan, S.; Arm, J.; Silcock, J.; Santamaria, G.; Buck, J.; Roy, M.; Leong, K. M.; Lau, P.; Clark, D.; Malycha, P.et al. Lipid and Metabolite Deregulation in the Breast Tissue of Women Carrying BRCA1 and BRCA2 Genetic Mutations. Radiology 2015, 275 (3), 675.Figures
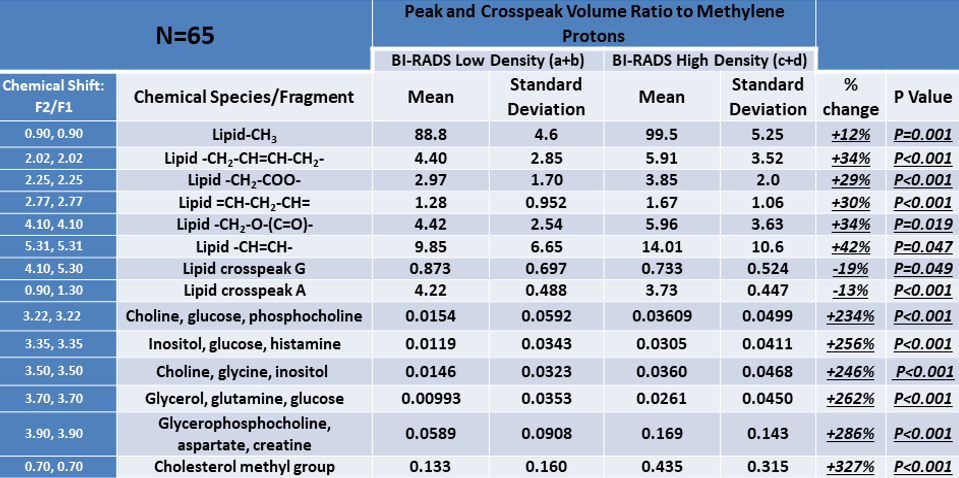

Figure 1: Full 2D COSY spectra from a low breast density (left) and a high breast density (right) participant. (F2/F1: 0.0 ppm to 6.0 ppm)
For crosspeak assignment see reference 12 - Ramadan et al (2015)