0376
Fatty Acid Methylene T2 Can be Used to Separate Activatable Brown Adipose Tissue from Clavicular and Subcutaneous White Adipose Tissue in Humans1Biomedical and Metabolic Imaging Branch, NIDDK/NIH, Bethesda, MD, United States, 2Translational Physiology Section, Diabetes, Endocrinology, and Obesity Branch, NIDDK/NIH, Bethesda, MD, United States, 3Energy Metabolism Section, Diabetes, Endocrinology, and Obesity Branch, NIDDK/NIH, Bethedsa, MD, United States
Synopsis
Localized 1H-MRS was used to determine relaxation properties of fatty acid (FA) resonances in supraclavicular adipose tissue and distal white adipose tissue (WAT). Blinded to MRS results 18FDG-PETwas used to detect cold activated metabolism to identify active brown adipose tissue (BAT). Using the T2 of the FA methylene t a cutoff value of 76 ms this T2 can be used to distinguish BAT from distal or supraclavicular WAT with 85% sensitivity and 95% specificity
INTRODUCTION
Brown adipose tissue (BAT) in humans can be identified with 18FDG-PET after activation by cold or drugs(1). There is a need for development of an imaging method to identify BAT without the need for radiation or cold stimulation Some promising MRI based methods are based on T2* or water content, but there is still a need for cold activation(2) and validation with PET due to biological variance in water content of BAT and method dependence of the imaging derived T2*. We used PRESS localized 1H-MRS relaxometry to characterize the lipid and water signals in 18FDG-PET proven cold activatable BAT in humans and white adipose tissue (WAT) to identify biophysical and biochemical differences between these tissues that can be used to reliably identify metabolically activatable BAT.METHODS
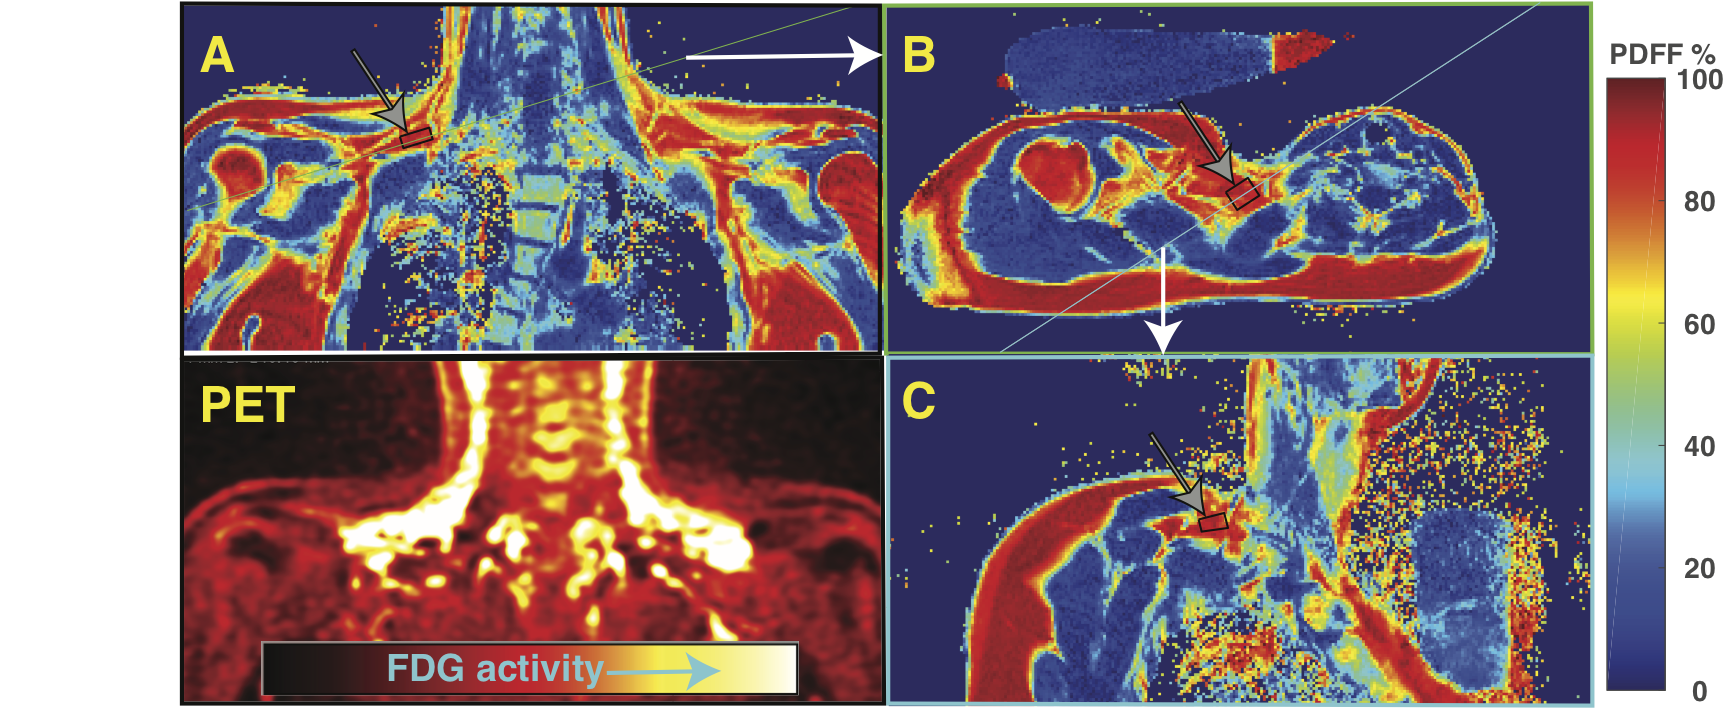
Healthy lean subjects (age 35±15 years, thirteen male and eight female) were scanned in a Siemens 3T scanner with a neck coil combined with a flex array surface coil placed over the clavicular area. Spaces between coil and subject were filled with saline bags to improve shimming and coil loading. After B0 field mapping high resolution (1·6x 1·6 mm) VARPRO(3) water-fat images were recorded on coronal and transverse orientations. Additional water-fat images were then recorded on oblique coronal and transverse slices through selected BAT areas with a 3 mm slice thickness to allow the placement of MRS volumes for PRESS purely in supraclavicular adipose tissue. MRS volumes were crossed by up to four distinct water-fat image slice planes (see figure 1). Series of PRESS localized 1H spectra were recorded to measure the T2 and T1 relaxation of 1H resonances with a logarithmic series or 16 TEs between 24 and 200ms and a fully relaxed spectrum at TE 24 ms to gauge the T1(5). The measurement was repeated three times for each location. Spectra were analyzed with AMARES time domain fitting(6) using a thirteen peak model for water and triglyceride resonances. Linear regression was used to determine the T2 and relaxation corrected spin densities of the spectral components and the proton density fat fraction( PDFF). A subsequent 18FDG-PET exam after cold stimulation was used to identify metabolically active BAT regions. Two radiologists blinded to the MRS results matched the supraclavicular locations of MRS to the PET images to identify MRS locations that were successfully placed within active BAT regions and MRS locations in supraclavicular adipose tissue that showed no activity with PET (NAT). Results from these BAT regions were compared with results from NAT and distal subcutaneous WAT.RESULTS
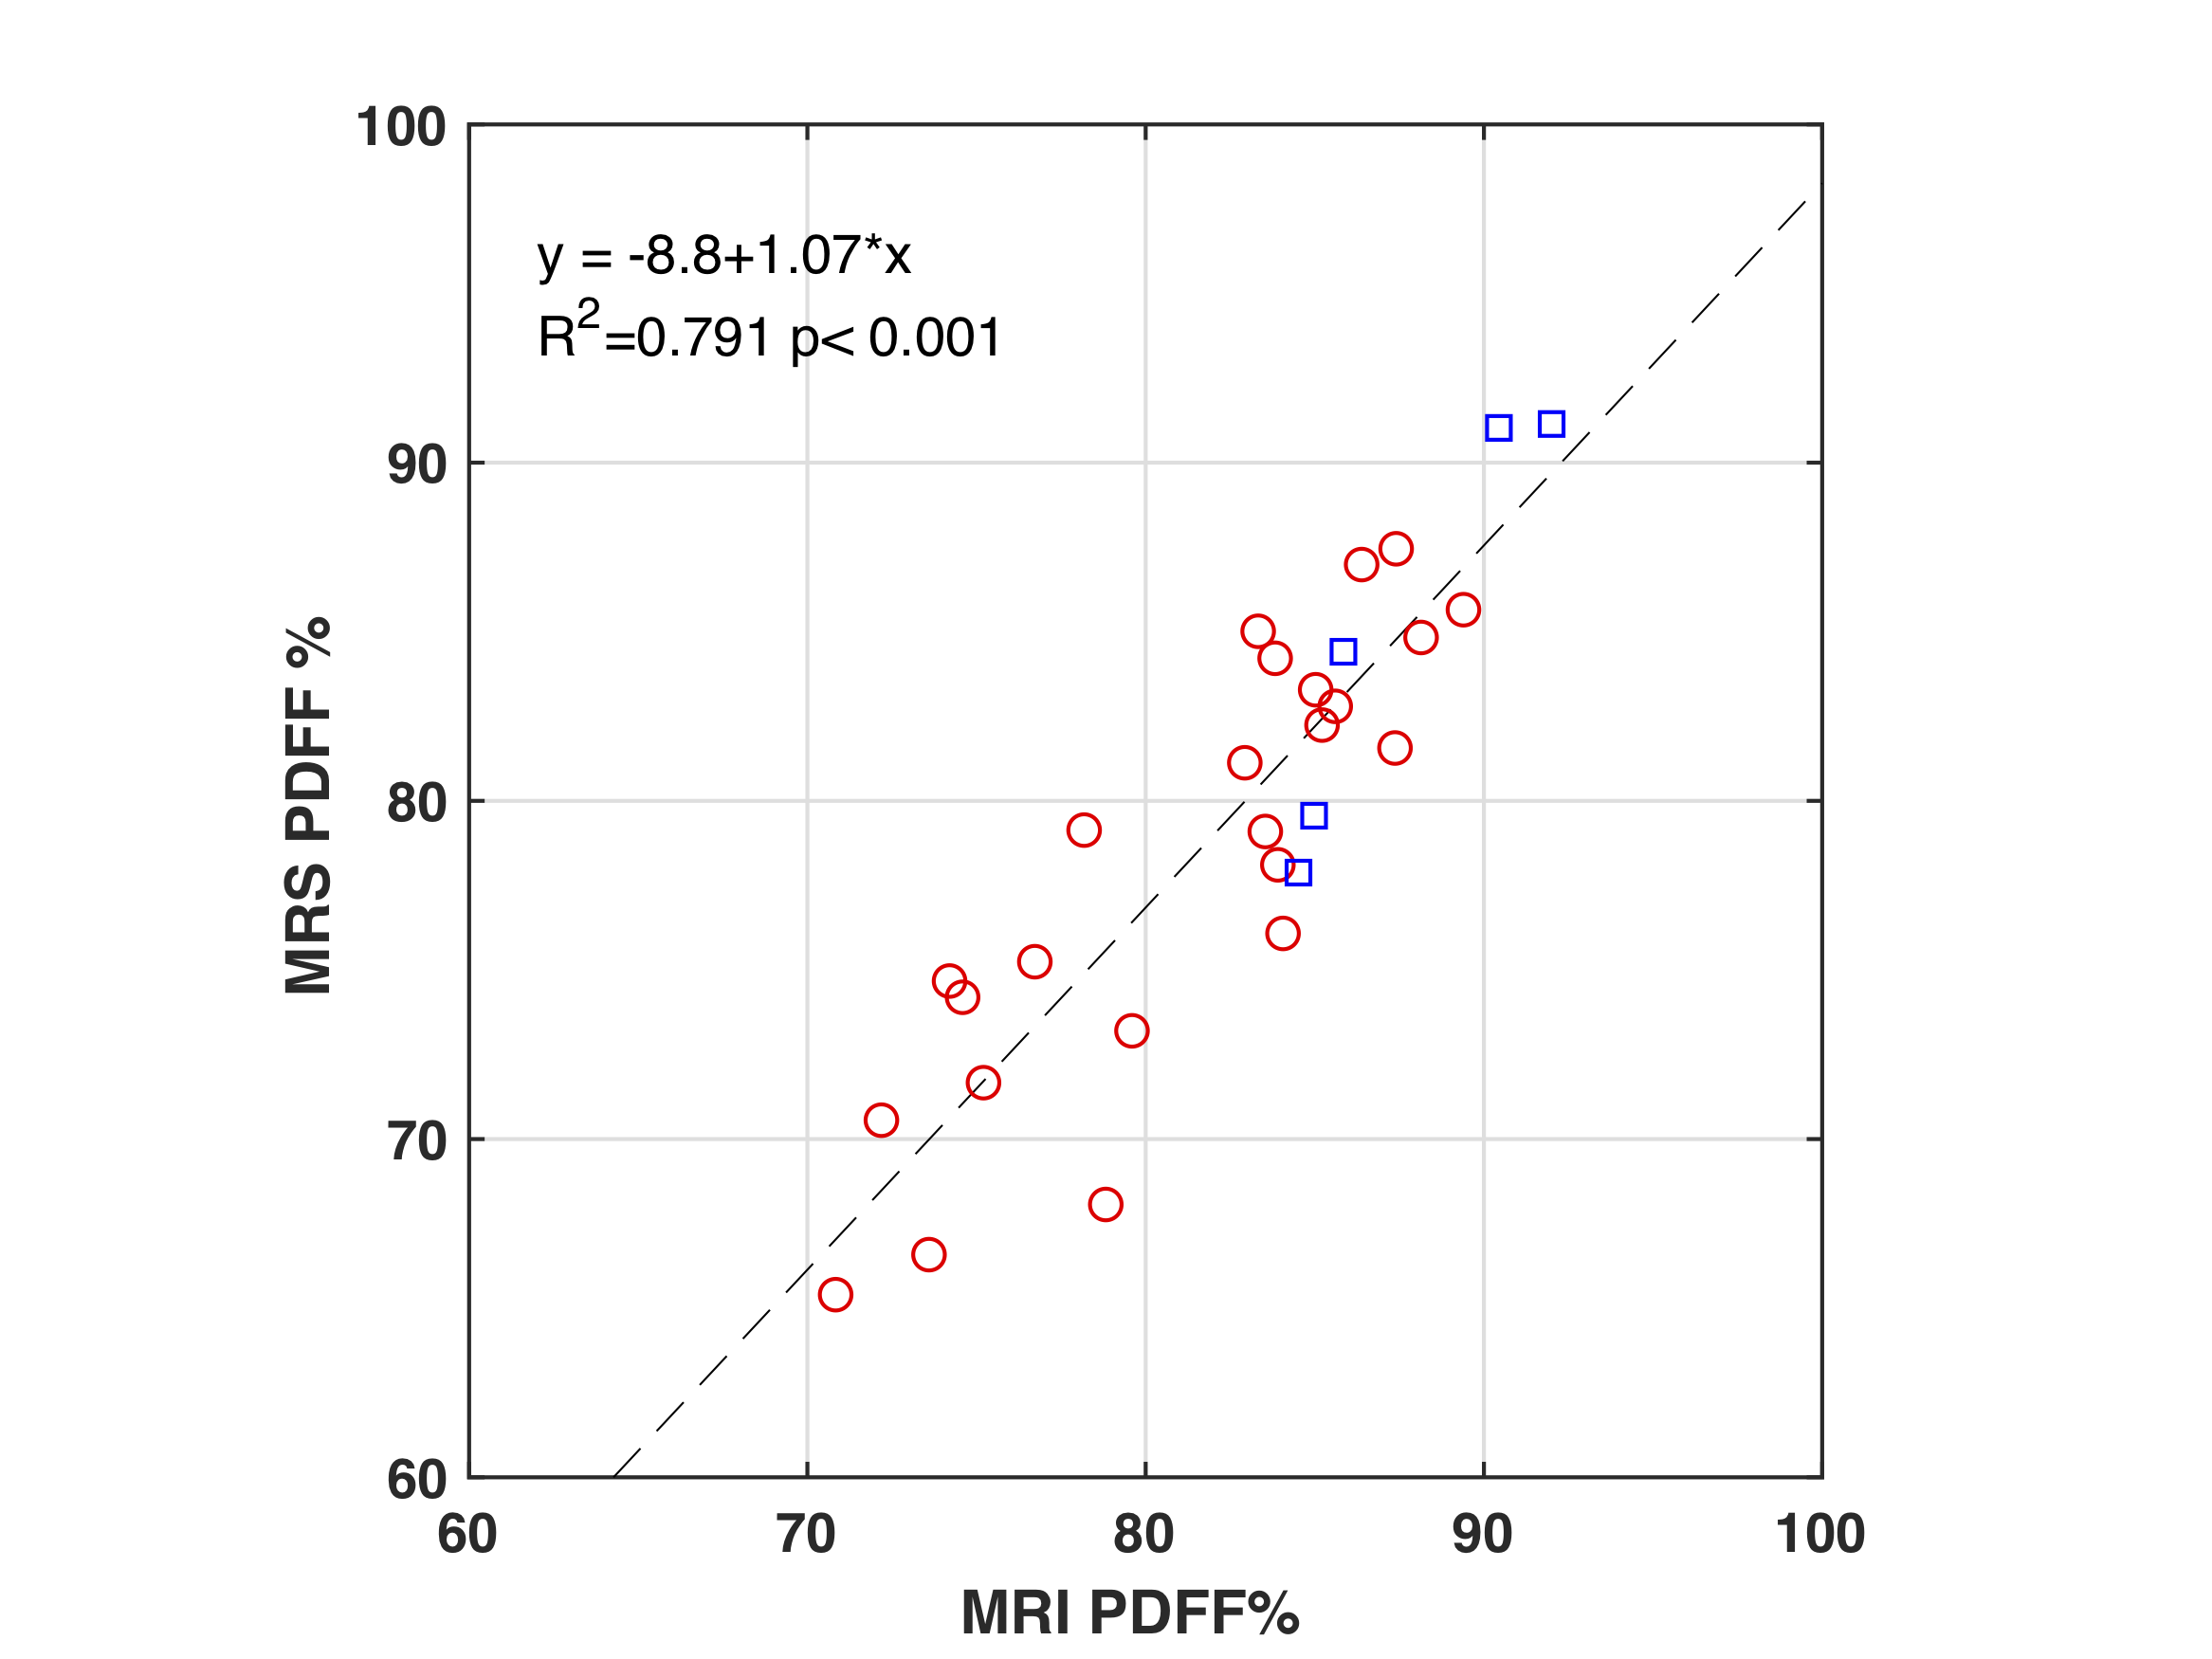
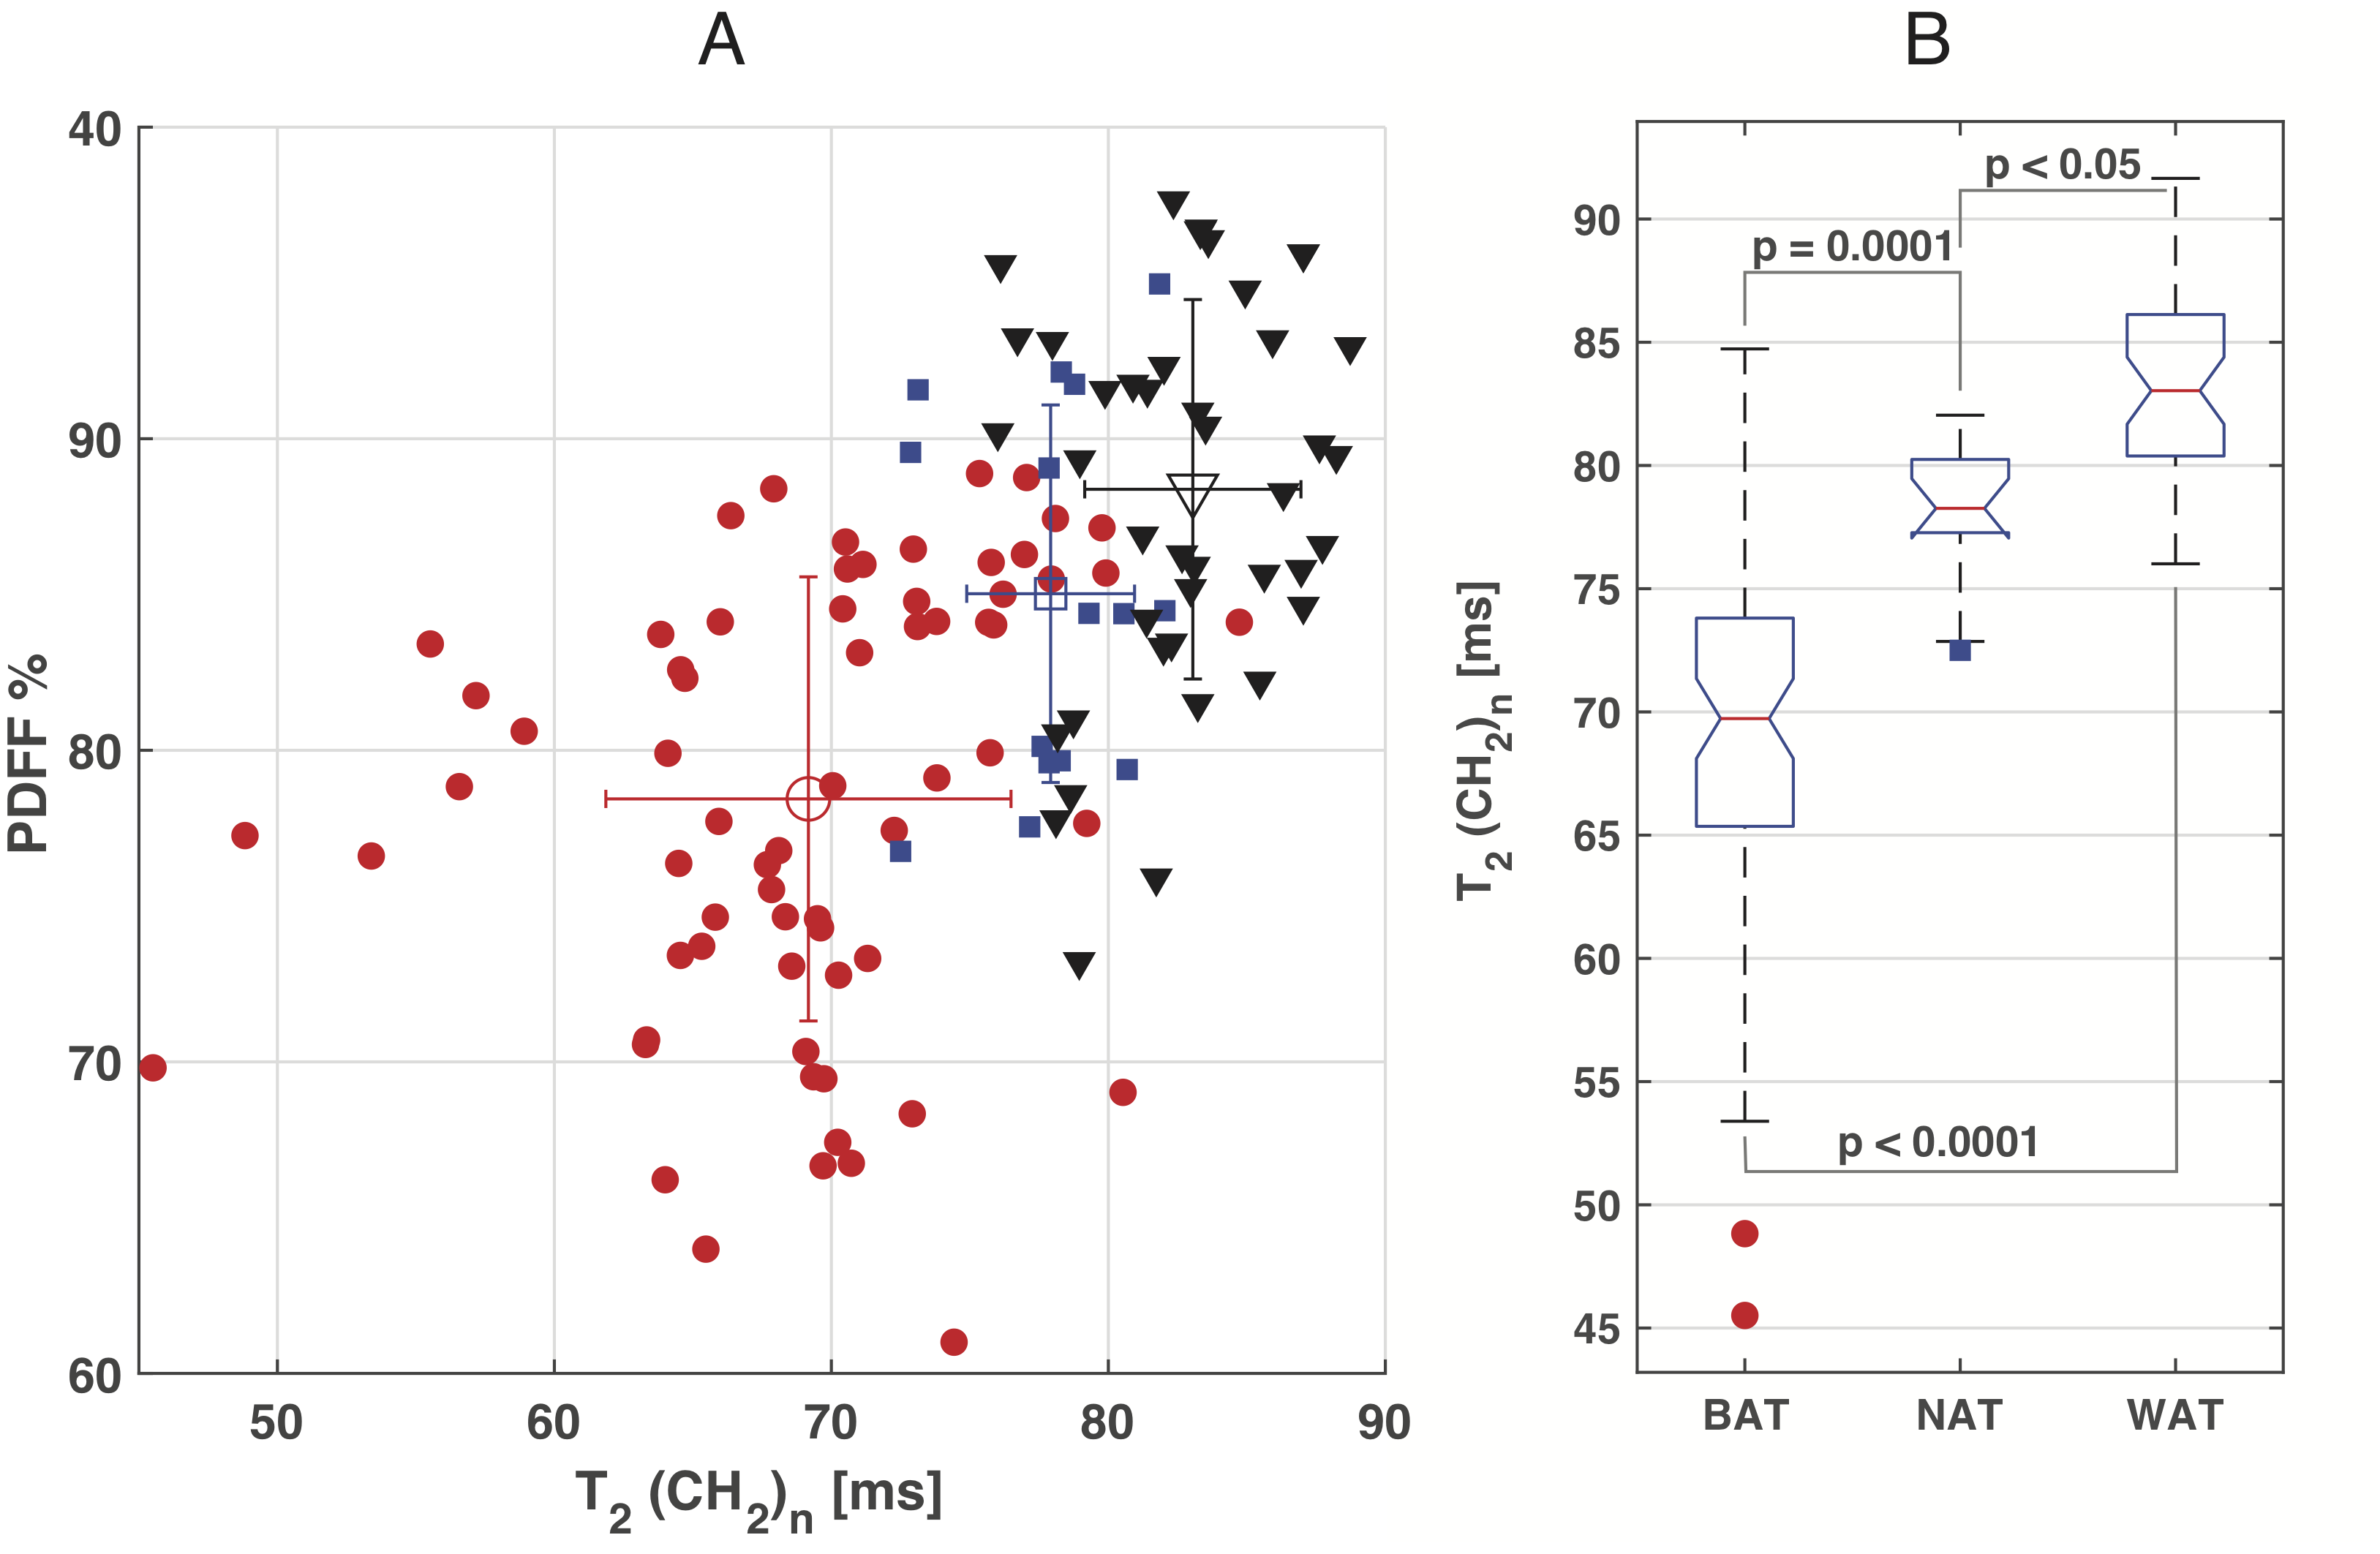
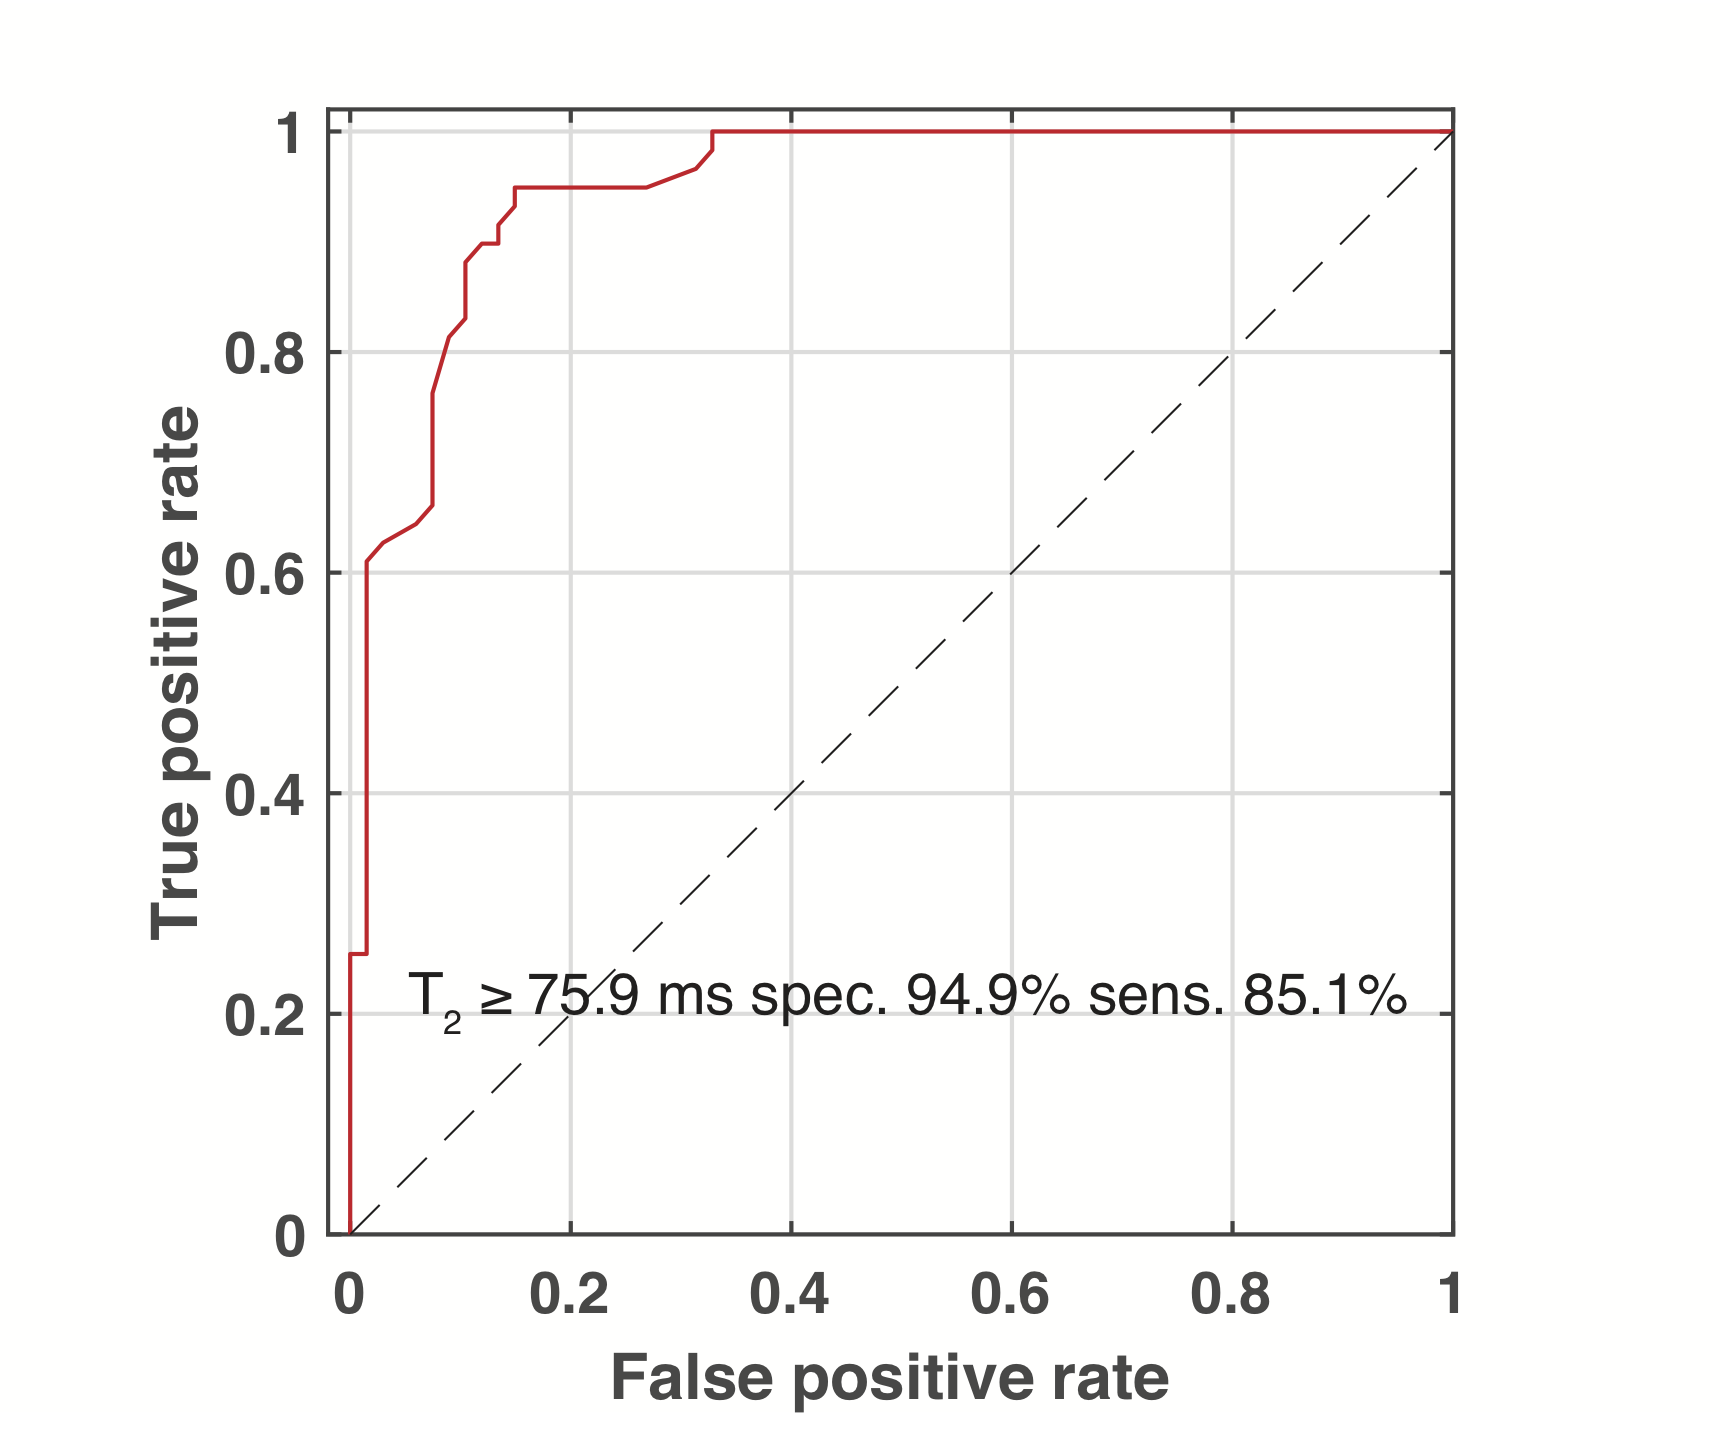
18FDG-PET showed active BAT coinciding with MRS targeted areas sixteen subjects (8 male, 8 female, age 31±12). In these subjects 24 MRS volumes were observed for a total of 67 relaxometry series. Four male subjects (age 58±6) showed no activity on PET. Fifteen relaxometry series were recorded in five MRS volumes of NAT in these subject. An additional 44 relaxometry series were recorded in fifteen MRS volumes placed in distal subcutaneous WAT. The MRS derived PDFF compared with the average PDFF of all pixels in cross sections of all intersecting water-fat images with linear regression with an R2 of 0.791 (see figure 2). Both methods of determining PDFF show considerable overlap between BAT and NAT. Figure 3A is a cluster plot of all the individual methylene T2 of the main lipid (CH2)n resonance at 1.3 ppm and PDFF measurements in BAT, NAT, and WAT regions. The T2 of the in BAT regions (BAT 69 ± 7, N=67 range 46-85) was significantly shorter compared to NAT (78± 3 N=15 range 73- 82, p= 0.001) and shorter than in WAT (83± 4 N=44 range 76- 92, p < 0.001). Boxplots of these groups of discrete measurements are shown in figure 3B. A Receiver Operator Characteristic (ROC) curve for classifying BAT versus NAT or WAT constructed from these data are shown in figure 5C. The area under curve (AUC) found with this analysis was 0.950 (95% confidence limits (CL) 0.896-0.981, p < 0.0001) against the null hypothesis of AUC = 0.5. With a cutoff value of 76 ms the methylene T2 can be used to distinguish BAT form WAT or NAT with 85% sensitivity and 95% specificity (see figure 4).DISCUSSION
The MRI and MRS derived PDFF show that water content of BAT shows too much variance to be used reliably as an indicator of active BAT. The methylene T2 does work as a parameter to reliably separate BAT from NAT and WAT. Notably, this differentiation works in BAT that is not activated for the MR protocol as is required with PETCONCLUSION
These results enable the development of MR based methods for identification and quantification of BAT in humans without the need for radiation or cold activation.Acknowledgements
No acknowledgement found.References
1. Cypess AM, Weiner LS, Roberts-Toler C, et al. Activation of human brown adipose tissue by a β3-adrenergic receptor agonist. Cell Metab. 2015;21:33–38 doi: 10.1016/j.cmet.2014.12.009.
2. Iris Chen Y-C, Cypess AM, Chen Y-C, et al. Measurement of Human Brown Adipose Tissue Volume and Activity Using Anatomic MR Imaging and Functional MR Imaging. J. Nucl. Med. 2013;54:1584–1587 doi: 10.2967/jnumed.112.117275.
3. Hernando D, Haldar JP, Sutton BP, Ma J, Kellman P, Liang Z-P. Joint estimation of water/fat images and field inhomogeneity map. Magn. Reson. Med. 2008;59:571–80 doi: 10.1002/mrm.21522.
4. Bottomley PA. Spatial localization in NMR spectroscopy in vivo. Ann N Y Acad Sci 1987;508:333–348.
5. Ouwerkerk R, Cypess A, Chen K, et al. Spin Densities and Relaxation Parameters of the Spectral Components of Brown Fat and Subcutaneous Fat with Localized 1H-MRS at 3T . In: Proceedings of the Twentyfifth Meeting of the International Society of Magnetic Resonance in Medicine. 2017.p3436
6. Vanhamme L, van den Boogaart A, Van Huffel S. Improved method for accurate and efficient quantification of MRS data with use of prior knowledge. J. Magn. Reson. 1997;129:35–43.
Figures