0374
Quantification of phenylalanine with 1H MRS using optimized acquisition conditions and downfield background modeling1Departments of Radiology and Biomedical Research, University of Bern, Bern, Switzerland, 2Department of Diabetes, Endocrinology, Clinical Nutrition and Metabolism, Bern University Hospital, University of Bern, Bern, Switzerland, 3Support Center for Advanced Neuroimaging, University Institute of Diagnostic and Interventional Neuroradiology Inselspital, Bern, Switzerland, 4Division of Neuropediatrics, Development & Rehabilitation, Pediatric University Hospital, University of Bern, Bern, Switzerland
Synopsis
For the quantification of the low-concentration metabolite phenylalanine (Phe) in patients with phenylketonuria using 1H magnetic resonance spectroscopy, optimal acquisition parameters and fitting procedures are crucial. Using a large voxel size and short TE helps to increase the signal-to-noise-ratio and allows restriction to a measurement time of 12min. Using the comparison of healthy controls vs. patients affords modeling of the unknown downfield region to develop a robust fitting model. Low CRLB of around 0.004mM proved the good precision of the quantification results, yielding cohort values of 0.019±0.01mM in controls and 0.142±0.02mM in patients.
Introduction
Phenylketonuria (PKU) is an inborn error of metabolism causing increased phenylalanine (Phe) concentrations in the brain, which has been quantified using 1H MR spectroscopy (MRS) mostly at 1.5 T starting in the 90s1. Still, the low concentration of Phe and the broad, unknown background signals in the downfield region that overlay with the Phe signal make Phe quantification challenging in patients, let alone healthy controls. Using acquisition and fitting conditions optimized for 3T MRS of global brain pathology2 helps to increase the effective SNR. Measuring at longer echo times (TE) may reduce the impact of the background signals, but has to be weighed against the loss in SNR for the Phe response. Simultaneous evaluation of spectra from healthy controls and patients with PKU helps to stabilize quantification of Phe content in presence of larger background signals at short TE and is used to investigate potential implication of other metabolites.Methods
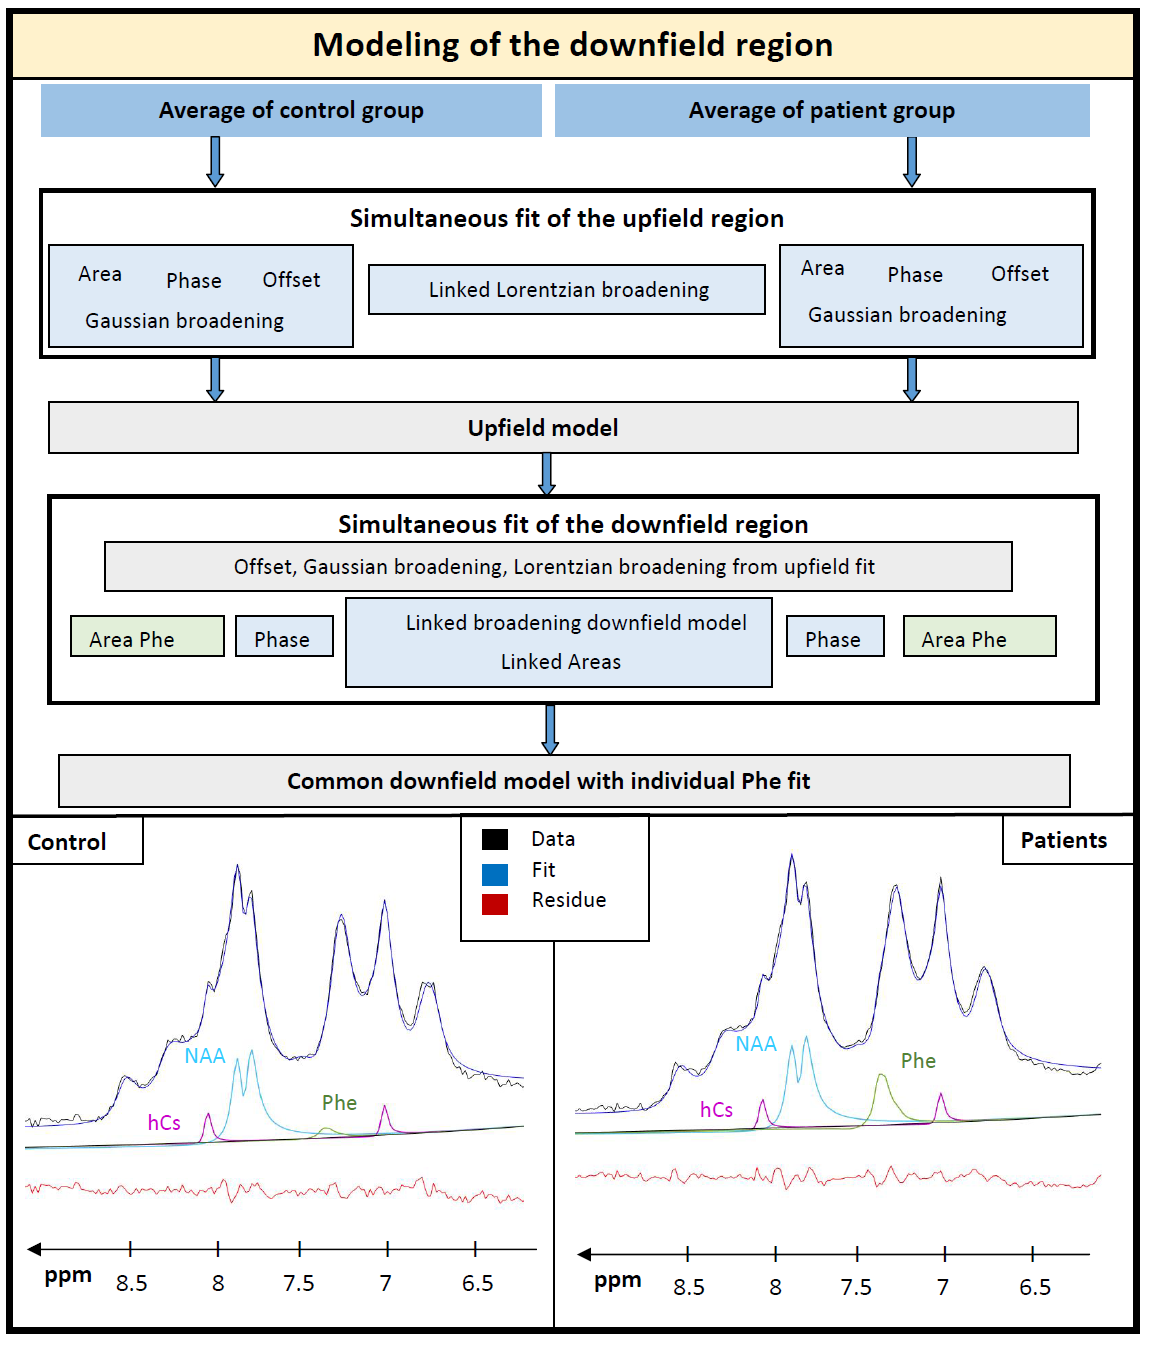
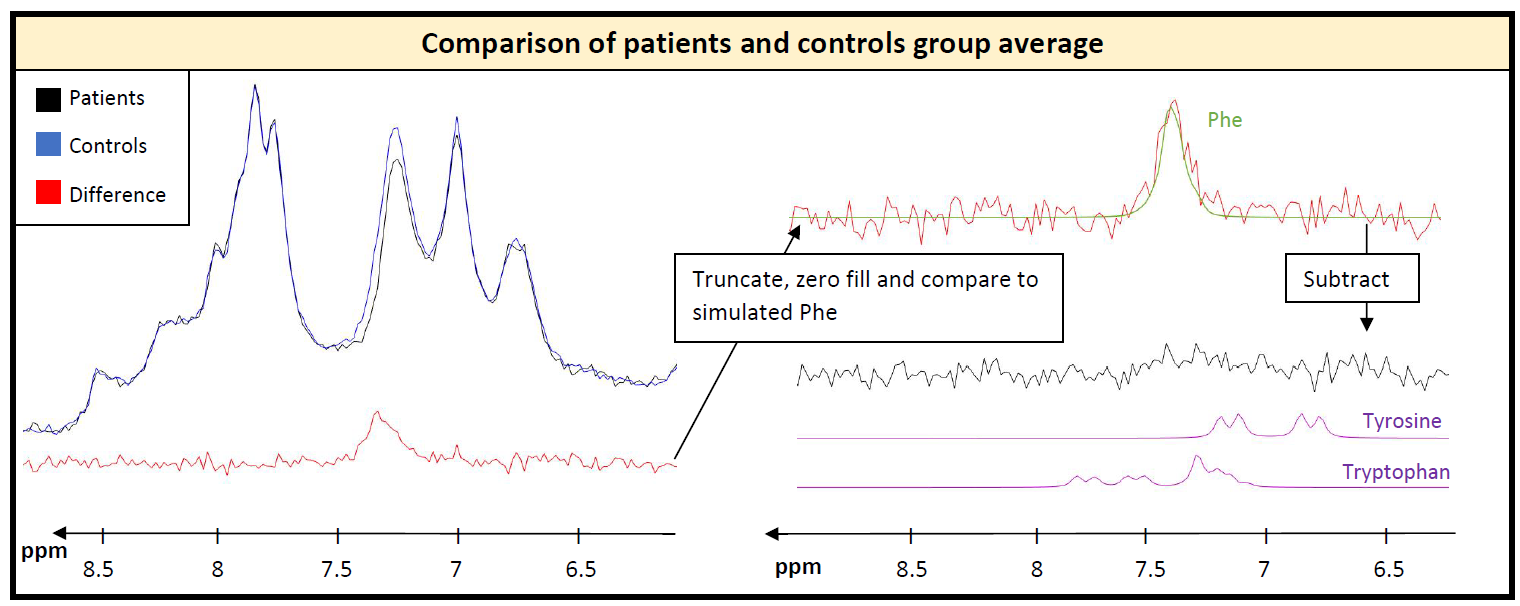
In framework of PICO-Study (interventional study investigating effects of Phe on cognition and brain): 6 healthy controls (27±4yrs) and 6 adult patients (35±8 yrs, classical PKU, all on Phe-restricted diet with aminoacid supplements), 3T MR scanner (Prisma, Siemens, Germany), 64 channel headcoil (44 channels used), shim option “brain”, semi-LASER localization3, 256 acquisitions (12 min), TE 35ms, TR 2500ms, voxel size 65-77cm3; excitation frequency 7.3ppm; one additional healthy subject at TE 35ms and 60ms. Data processing using JMRUI4. Fitting and CRLB calculation in FiTAID5. Fitting model included 19 metabolites simulated in VESPA6 for applied semiLASER conditions; upfield macromolecular background fitted using equally spaced Voigt-lines.For the downfield region, known responses of homocarnosine (hCs) (resonance frequencies from Ref7) and N-acetylaspartate (NAA) were included while the remaining resonances were modeled with 10 lines (adjustable Lorentzian and Gaussian broadening) and heuristically optimized simultaneously for patients and controls. Figure 1 describes the procedure of using the average spectra from both groups to define a common background resonance model. For evaluating Phe in single subjects, the downfield background model was held fixed (including hCs and NAA) except for variable overall area with frequency offset and widths taken from upfield fit. Metabolite concentrations are referenced to a total creatine (tCr) content of 8mM8.
Results and Discussion
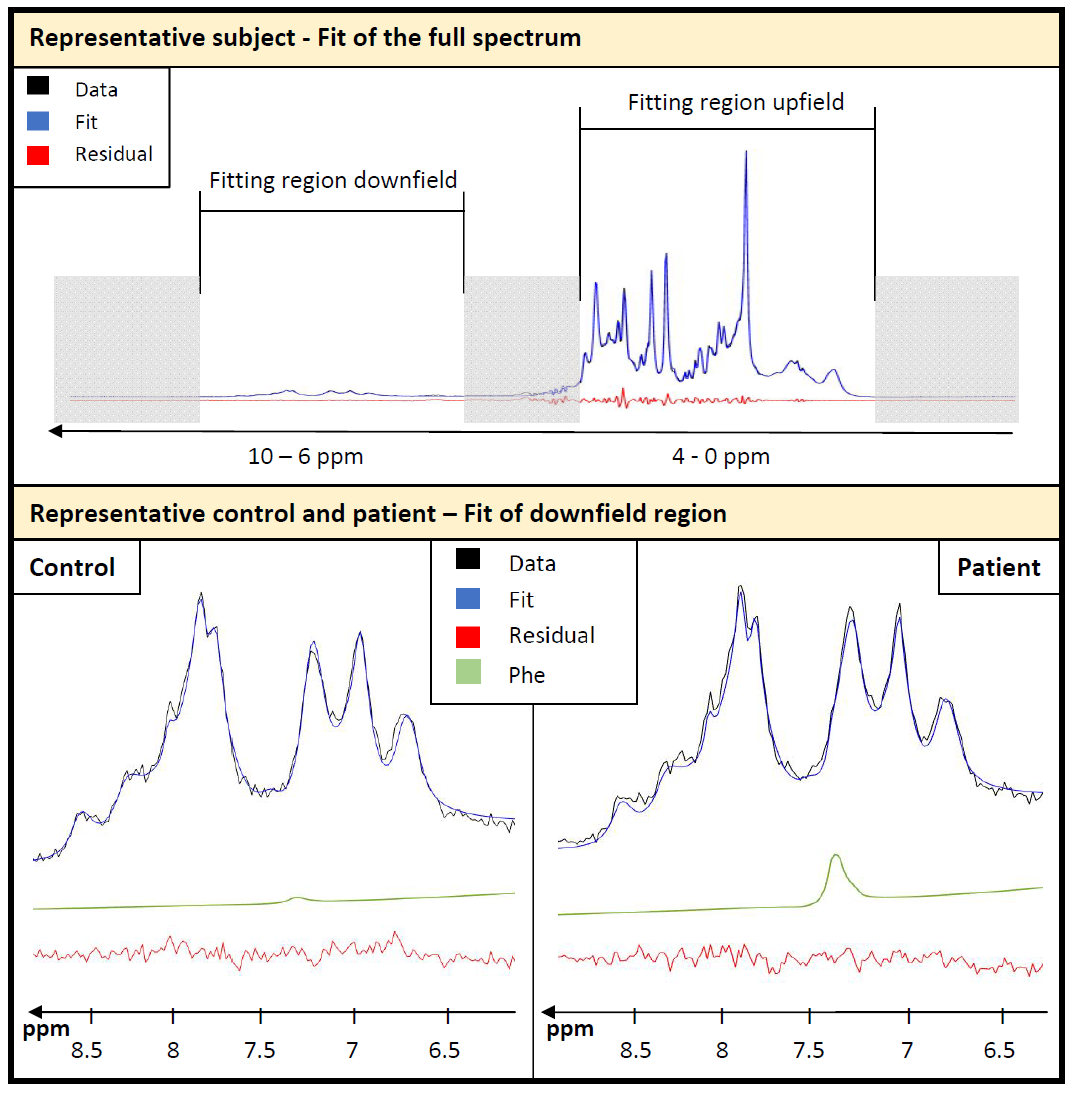
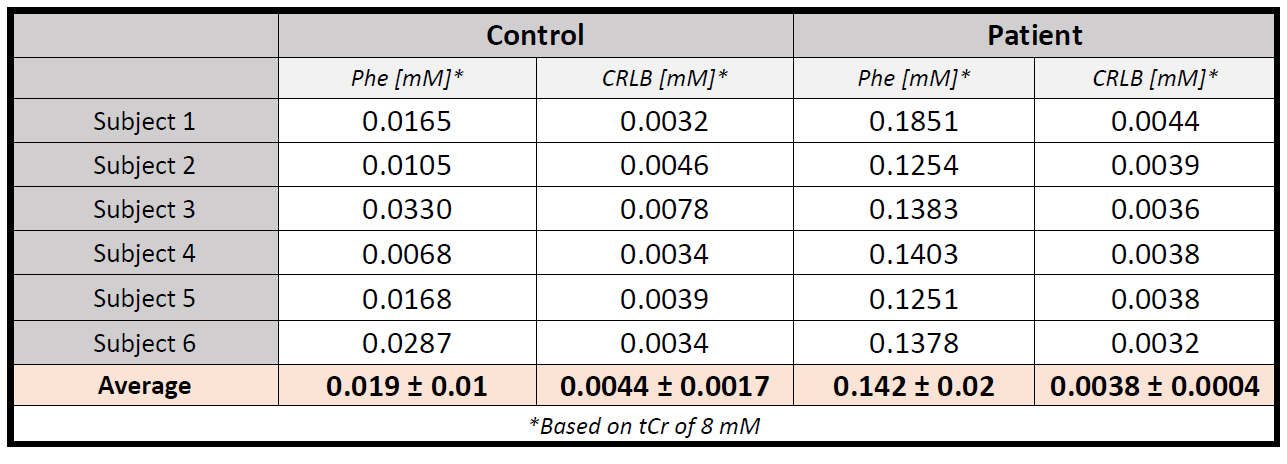
The modeling strategy for the downfield spectrum is shown in Figure 1. Under the premise that downfield background signals are identical for both groups (verified below by inspecting the difference spectrum), a simultaneous fit of both average spectra allows for the definition of the background signal without interfering with the overlapping Phe response. Figure 2 shows the fit results for the whole spectral range for a representative subject and zooms in downfield for a patient and a control demonstrating good fitting performance with no major residues in the region around the Phe peak.Table 1 contains the quantification results for Phe for all subjects incl. fit uncertainty (CRLB). The Phe content for patients is in the expected range with substantial inter-individual differences as expected for different blood Phe levels9. For healthy controls, the levels found are considerably and significantly (p<0.000001) lower and with 20µM somewhat below what is listed as the normal value (50µM) from biopsy data10. The CRLB of ~4µM on average for both groups indicates that the suggested downfield fit model allows quantification of Phe with high precision and the small standard deviation of 10µM from within the control group confirms this. For all other metabolites, no significant differences were found.
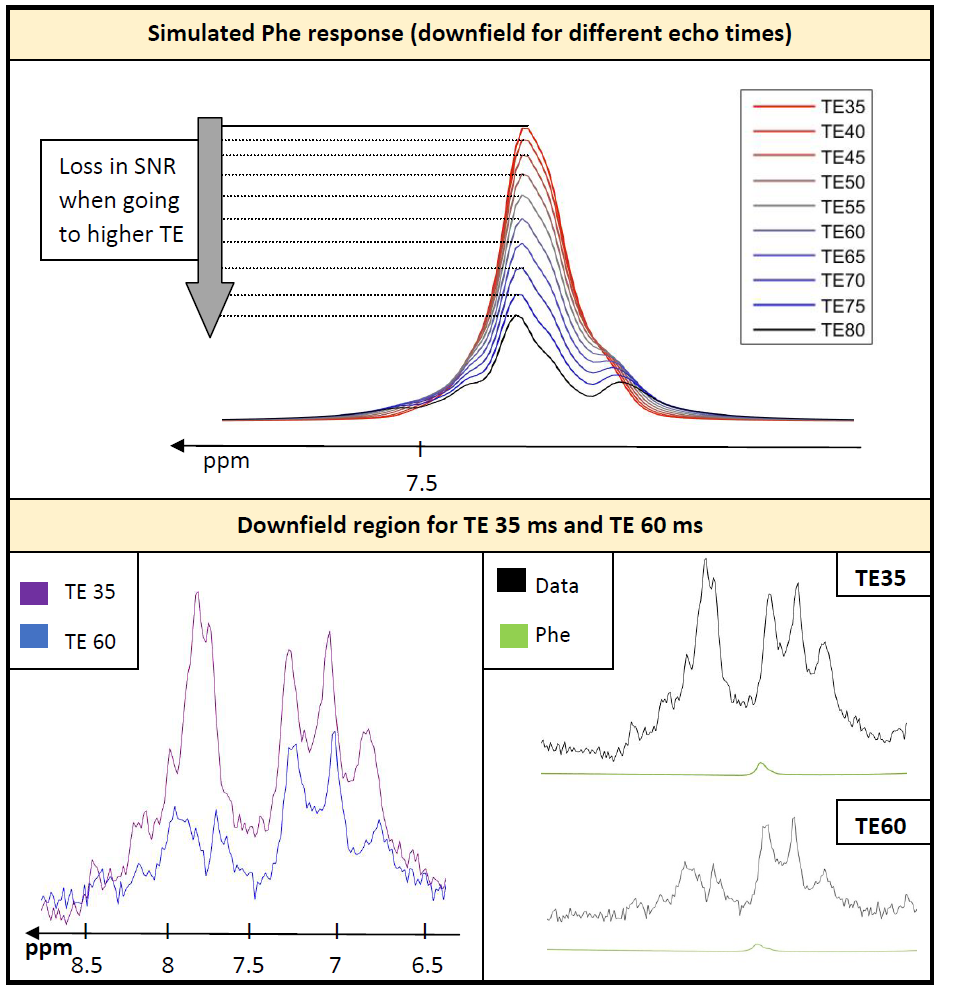
Simulation of Phe for different TEs (35-80ms) in Figure 3 illustrates the loss in SNR due to J-evolution in the strong coupling pattern for higher TE even without considering T2-decay. The comparison of data recorded at 35ms and 60ms TE visualizes the decrease of the downfield baseline but also the loss in SNR regarding Phe. Comparing the simulated Phe response for the fitted Phe content of 0.04mM shows that the underlying background signal remains high compared to the Phe signal at the longer TE.
Figure 4 shows the averaged difference spectra between patients and controls. The Phe resonance can clearly be identified. Apart from that, no relevant other spectral features can be discerned, proving that the proposed method of using a linked model for both groups to define the baseline is justified. When subtracting the simulated Phe signal from the difference, no other spectral features emerge that might be caused by further differences in the metabolite profile between the two groups, which could have been speculated for11,12.
Conclusion
The quantification of Phe was possible in both healthy controls and adult patients with PKU with only 12min scan time using optimized acquisition and fitting procedures. An optimized downfield baseline model was found, providing robust and consistent fitting of Phe with good precision, while a potential offset due to inaccurate background modeling cannot be excluded. Measuring at a short TE of 35ms is reasonable and shifting to longer TE with somewhat smaller background signal, but also lower SNR, is not recommended. Although spectral differences between the current groups are minimal besides those for Phe, it remains of interest to investigate potential concentration alterations for other metabolites for patients with more severe symptoms or higher blood Phe levels or patients with other diffuse metabolic disease.Acknowledgements
This work is supported by the Swiss National Science Foundation (SNSF #320030‐175984).
The semi-LASER sequence was developed by Edward J. Auerbach and Malgorzata Marjańska and kindly provided by the University of Minnesota under a C2P agreement.
The PICO study (https://clinicaltrials.gov/ct2/show/NCT03788343) is supported by the University Hospital Bern.
References
1. Kreis, R. 1H Magnetic resonance spectroscopy of cerebral phenylalanine content and its transport at the blood-brain barrier. In: Neural Metabolism in Vivo, edited by I. Y. Choi and R. Gruetter. New York: Springer 2012;1117–1134.
2. Hoefemann, M., Adalid, V., Kreis, R. Optimizing acquisition and fitting conditions for 1H MR spectroscopy investigations in global brain pathology. NMR Biomed. 2019;e4161:1–11.
3. Marjańska, M. & Auerbach, E. CMRR Spectroscopy Package. Available at: https://www.cmrr.umn.edu/spectro/.
4. Stefan, D. et al. Quantitation of magnetic resonance spectroscopy signals: The jMRUI software package. Meas. Sci. Technol. 2009;20: 104035.
5. Chong, D. G. Q., Kreis, R., Bolliger, C. S., Boesch, C., Slotboom, J. Two-dimensional linear-combination model fitting of magnetic resonance spectra to define the macromolecule baseline using FiTAID, a Fitting Tool for Arrays of Interrelated Datasets. MAGMA. 2011;24: 147–164.
6. Soher, B. J., Semanchuk, P., Todd, D., Steinberg, J., Young, K. VeSPA: Integrated applications for RF pulse design, spectral simulation and MRS data analysis. in Proceedings of the 19th Annual Meeting of ISMRM, Montreal, Canada, 2011. p. 1410.
7. Rothman, D. L., Behar, K. L., Prichard, J. W., Petroff, O. A. C. Homocarnosine and the measurement of neuronal pH in patients with epilepsy. Magn Reson Med. 1997;32: 924–929.
8. van de Bank, B. L. et al. Multi-center reproducibility of neurochemical profiles in the human brain at 7T. NMR Biomed. 2015;28: 306–316.
9. Kreis, R., Zwygart, K., Boesch, C., Nuoffer, J. Reproducibility of cerebral phenylalanine levels in patients with phenylketonuria determined by 1H-MR spectroscopy. 2009;16:11–16.
10. Clarke D.D., Lajtha A.L., Maker. H.S. Intermediary metabolism. in Basic Neurochemistry: Molecular, Cellular, and Medical Aspects, 4th Ed. (Siegel GJ, Agranoff BW, Albers RW, Fisher SK, Uhler MD (Eds.))Raven Press New York. 1989; 541–564.
11. Luciana, M., Sullivan, J., Nelson, C. A. Associations between phenylalanine-to-tyrosine ratios and performance on tests of neuropsychological function in adolescents treated early and continuously for phenylketonuria. Child Dev. 2001;72: 1637–1652.
12. Drummond, K. N., Michael, A. F., Good, R. A. Tryptophan metabolism in a patient with phenylketonuria and scleroderma: A proposed explanation of the indole defect in phenylketonuria. Canad. Med. Ass. J. 1966;94: 834–838.
Figures